

Abstract
Biofilms are surface-mounted, multicellular communities of microbes. Biofilms are often associated with chronic infections that resist treatment, evade the immune system, and damage host tissue. An essential characteristic of the biofilm state is that constituent organisms are bound in a polymeric matrix. This matrix gives the system spatial structure and clusters bacteria near each other, facilitating intercellular interactions. The Pseudomonas aeruginosa strain PAO1 is widely studied as a model biofilm-forming organism. The polymeric matrix of PAO1 biofilms is dominated by two bacteria-produced extracellular polymers, Pel and Psl. We use a combination of optical and atomic force microscopy to examine the roles of these polymers in very early biofilm development. In agreement with other researchers, we find that Psl mediates strong attachment to a glass surface. We find that Pel alone can mediate some attachment, but not as permanent as that mediated by Psl. Unexpectedly, we find that Pel promotes symmetric attachment, in the form of rod-shaped bacteria lying down flat on the surface, and that the presence of Pel makes attachment forces more short-ranged than they are with Psl alone. We suggest that these effects may result from synergistic interactions of Pel with the Psl polymeric matrix.
Introduction
Biofilms are surface-associated multicellular communities of unicellular bacteria and yeast that are housed within a complex matrix of exopolysaccharide (EPS) materials synthesized by the microbes. EPS materials bind cells to one another and to the surface; the EPS matrix also acts to protect cells from chemical and physical hazards in the environment.1–8 Bacterial biofilms have high clinical impact because they facilitate growth and immune evasion on host tissues and implanted medical devices. Furthermore, the biofilm phenotype is typically less susceptible to antibiotic treatment than planktonic counterparts. Pseudomonas aeruginosa is an ubiquitous opportunistic human pathogen that infects the lungs of cystic fibrosis (CF) patients with biofilms that resist both the host immune response and drug treatment.2, 9 However, early in biofilm development, the bacteria are still vulnerable to antibiotics or clearance.10 In the canonical model of biofilm formation,11, 12 planktonic, rod-shaped P. aeruginosa first attach to a surface end-on, in what is known as non-permanent or reversible attachment. Later, cells lie down flat on the surface and attachment becomes permanent. Since permanent attachment is a prerequisite for all subsequent steps in biofilm formation, preventing permanent attachment would synergize with existing and developing antibiotic treatments. A better fundamental understanding of the process of permanent attachment and the specific biological elements involved would aid the development of strategies designed to prevent or delay permanent attachment.
We use a combination of optical microscopy, force measurements using an atomic force microscope (AFM), and automated data analysis to characterize the surface attachment of P. aeruginosa early in biofilm formation. We use isogenic deletion mutants to elucidate the roles of the two primary EPS materials, Pel and Psl. Consistent with previous work,6, 13–16 we find that the EPS element Psl is the primary mediator of permanent adhesion to the surface. Unexpectedly, we find that Pel helps promote the bacteria lying flat on the surface. Force measurements indicate that Pel does so by making the adhesive force short-ranged and localized. Our observations indicate that permanent attachment has two components, permanent adhesion to the surface and lying down flat on the surface, and that the former can occur without the latter.
Experimental
Bacteria and media
We use wild-type (WT) P. aeruginosa strain PAO1, five single-gene deletion strains in the PAO1 background, PAO1 Δpel (B1A) and PAO1 Δpel (kpelA), PAO1 Δpsl, PAO1 ΔfliC, PAO1 ΔpilA, and one double-gene deletion strain, PAO1 ΔpelΔpsl (strains courtesy of Prof. Matthew Parsek, University of Washington, Seattle).17 The two Δpel mutants were used to check for a difference in behavior of an in-frame deletion versus an out-of-frame deletion, but no substantial difference was observed (see This journal is c The Royal Society of Chemistry [year] Figures S1 and S2). Bacteria were streaked from frozen stock onto LB-Miller agar plates (5 g yeast extract, 10 g tryptone, 10 g sodium chloride, and 15 g agar per litre of Millipore water) and incubated at room temperature. Single colonies were inoculated into 4 mL minimal medium18 with 36 mM disodium succinate as the sole carbon source and incubated at 37 °C in 20 mm glass culture tubes on an orbital shaker (Labnet Orbit 1000) with a 19 mm circular orbit operating at 200–250 rpm. (Disodium succinate is added by filter sterilization; media with succinate is stored at 4 °C for no more than two weeks prior to use.)
Sample Preparation
We grew the cultures in culture tubes to an OD600 of 0.3, as measured by a Thermo Spectronic Genesys 20 Spectrophotometer, which corresponds approximately to mid-exponential growth phase. We then volumetrically diluted the culture, by adding sterile medium, by a factor of either 50,000× or 500,000×. We prepared samples for microscopy by placing an adhesive spacer (SecureSeal SS1X13) onto an uncoated glass slide, followed by addition of a few drops of the diluted culture and covering with a glass cover slip to seal the chamber. Prior to use, we cleaned the cover slips by 5 minutes of sonication in a solution of 150 g of potassium hydroxide (KOH) dissolved in 450 mL of ethanol, followed by further sonication and rinsing in deionized water.
Optical Microscopy
The bacteria were imaged using an Olympus IX71 inverted microscope in phase contrast mode; the microscope stage is enclosed within an incubator chamber heated to 30 °C. For better spatial resolution, monochromatic green light was used for illumination. We use a 60× oil-immersion objective in combination with an internal 1.6× multiplier that increases the effective magnification. Images were captured with a QImaging EXi Blue CCD camera controlled by a computer running QCapture Pro 6. An exposure time of 0.2 seconds and a frame rate of one frame per 30 seconds sufficed to capture most motion of the bacteria on the surface and avoid blurring. Rapidly spinning bacteria were excluded from the analysis. Images were assembled into time-lapse movies using the Fiji distribution of ImageJ software.19, 20
Five movies each of WT bacteria and Δpel are reported on here, and two movies each of the Δpsl, ΔpelΔpsl, ΔfliC, and ΔpilA mutants. Our experiments began with a single isolated bacterium or a just-divided pair in the field of view. With time, bacterial division and attachment of additional cells caused the number of bacteria in the field of view to increase. The total number of bacteria surveyed per experiment was ~50–150 over 5–10 hours; daughter cells are counted as separate bacteria from the parent.
Tracking and Analysis
To track the individual bacteria in the time-lapse movies, we used a modified version of the IDL colloid-tracking software from Crocker and Grier21, which was altered to account for elongated particles rather than spherical ones.22 The tracking software outputs the centre position, velocity, orientation, length, and aspect ratio of each bacterium. Matlab was used to analyse the tracking data and automatically sort the tracking output into three categories: well-tracked bacteria, bad tracking, and self-cohering pairs of bacteria. The most common cause for bad tracking was bacterial cell division. For a given bacterium, typically one or two frames worth of data were discarded at division. Dividing bacteria were also identified manually for subsequent analysis.
Dwell times are measured manually for bacteria present within the first 5 hours of growth and normalized by dividing by the mean doubling time measured for each strain in the same time window. To get better statistics, the window was extended to 7 hours for the ΔpelΔpsl bacteria because so few doublings were observed.
For cohesion lifetime measurements, we define a cohesive pair to be two side-by-side bacteria that overlap at least half a body length and are within 10° of parallel. These cohesive pairs are automatically identified by our Matlab routines from the tracking output.
AFM force measurements
AFM data were gathered using a Veeco MultiMode Scanning Probe Microscope controlled by a NanoScope IV and PicoForce Control Module (Veeco, Santa Barbara, CA). V-shaped Si3N4 cantilevers with oxide-sharpened tips (Olympus, spring constant of 0.17 N/m) were used for all AFM force measurements. The spring constants of the cantilevers were determined using the thermal noise technique provided with the instrument software. The AFM cantilever was mounted in a fluid cell probe holder and was prepared as follows: first, the cantilever was immersed in 0.1% poly-L-lysine solution (Sigma) for 45 minutes; next, the excess liquid was carefully drawn off the probe by wicking with a Kimwipe, and the tip was allowed to dry for 10 minutes; third, a drop of bacterial culture was placed on the cantilever and allowed to sit for 30 minutes; finally, the probe was gently rinsed with phosphate buffered saline (PBS), leaving a small drop of PBS on the cantilever. Poly-L-lysine, a cationic polymer, acts to immobilize bacteria on the cantilever tip.23, 24
A glass cover slip, pre-cleaned as for the optical microscopy, served as the substrate for force curve measurements, which were performed in PBS. The cantilever tip was repeatedly brought down into contact with the glass substrate, left in contact for some time, and then pulled off, approximately 100 times for each experiment (between 74 and 112 usable curves in each experiment). The deflection of the cantilever during retraction was used to measure adhesion. For the data reported here, the AFM probe was moved over a vertical distance of 4 μm, the rate of approach and retraction was 10 μm/s, and the time on the surface was 1 s.
Results and discussion
Three primary EPS elements, Psl, Pel, and alginate, have been found to contribute to biofilm formation in P. aeruginosa; however, alginate has been shown not to be a significant component of biofilm of WT strain PAO1.6, 25, 26 Previous work with PAO1 has shown that Psl is important for surface adherence and structuring the biofilm6, 14–16, 27–29 and that Pel contributes to intercellular cohesion and also has protective functions.7 To our knowledge, a role for Pel in the adhesion of PAO1 to surfaces has not previously been identified. A study of another WT P. aeruginosa strain, PAK, found that Pel is critical for surface attachment, but only in mutants lacking pili.6, 7, 30, 31
Earlier studies of the roles of Pel and Psl have often used optical microscopy as their primary methodology.6, 7, 13, 17 Our approach differs in several ways that influence the effects we are able to observe. First, earlier work has focused on biofilm development after one or more days of growth6, 7, 13, 17 while here we are concerned with the first hours just after initial attachment to the surface. Second, our use of a high-magnification objective and single-cell tracking and analysis permits elucidation of the behaviours of single cells at length scales smaller than those accessible to the lower magnifications that are well-adapted to studying larger structures in a biofilm.6, 7, 13, 17 Third, we continuously monitor bacteria under the microscope, allowing us to measure dynamic properties as well as static ones.
Knocking out pel or psl impairs adhesion to the surface
The first dynamic property we measure is the surface dwell time, or the length of time that a cell remains on the surface. We measure this for each individual cell, restarting the dwell time counter from zero upon cell division or upon detachment and reattachment. Histograms of the dwell times of the WT, Δpsl, and ΔpelΔpsl knockout strains show that the WT normalized dwell times are strongly peaked around 1 (Figure 1, solid red line). This peak contains 93% of all the dwell times measured, indicating that most bacteria remain on the surface through an entire division cycle. The normalized dwell times of the ΔfliC and ΔpilA mutants are very similar to those of the WT (Figure S3). However, for the ΔpelΔpsl mutants, over half of the dwell times are less than 20% of the mean doubling time and very few complete a full division cycle (Figure 1, green dash-dot line). This agrees with our qualitative observations that the ΔpelΔpsl mutants frequently detach from the surface and swim elsewhere, while the WT generally remain on the surface once they settle there. The Δpsl mutants fall somewhere in between WT and ΔpelΔpsl, with about 25% of the dwell times less than 20% of the mean doubling time, and about 50% in a peak close to 1 as well (Figure 1, dotted orange line). This suggests that Pel confers some adhesion to the surface, although less than that conferred by Psl. That Psl is the primary EPS element that confers surface adhesion is consistent with the observation that the distribution of normalized dwell times for Δpel mutants (Figure 1, blue dashed line) does not significantly differ from that of WT.
Fig. 1.
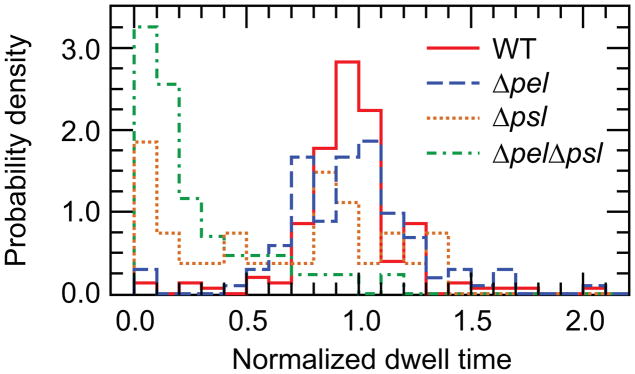
Normalized dwell time histograms. Dwell times are normalized to the mean doubling time measured for each strain. WT and Δpel bacteria typically complete entire doubling cycles without detaching. The Δpsl mutant detaches more frequently, and the ΔpelΔpsl bacteria rarely complete a division cycle without detaching. Measured doubling times are WT: 59.4 min; Δpel: 82.5 min; Δpsl: 51.4 min; ΔpelΔpsl: 66.5 min.
Tilting up off the surface reflects an asymmetry in adhesion
Adhesion to a surface can be symmetric, so that bacteria either lie down flat or stand on-end, or asymmetric, so that bacteria are attached at one end and tilting up. The bacterial aspect ratio (aspect ratio = length divided by width) projected onto the horizontal surface can act as a proxy measure of the amount of tilting. Shifts in the position and shape of the main peak indicate differences in the amount of time the population spends tilting off the surface. Projected aspect ratio is also coupled to the length of the cells. Rod-shaped P. aeruginosa grows lengthwise and manual measurements of bacteria give the length of newly-divided bacteria as about 1.75–2 μm, for WT and for mutants. The manually-measured width of the bacteria is about 0.85–0.9 μm. Image processing before tracking disproportionately erodes the width, leading to tracked widths of about 0.7 μm that exaggerate tracked projected aspect ratios. A newly-divided bacterium that lies down flat on the surface will have a minimum tracked projected aspect ratio of about 2.5. Smaller values unambiguously indicate bacteria lifting an end off of the surface. Longer bacteria with an end off the surface may also yield tracked projected aspect ratios above 2.5.
For the WT bacteria, the main peak of the histogram of tracked projected aspect ratio is at about 4, and only 2.5% of the aspect ratio counts fall below 2.5 (Figure 2a and 2b, solid red lines). Aspect ratio histograms of ΔfliC and ΔpilA are not significantly different from that of WT (Figure S4). For Δpsl, the position of the main peak, which contains about 70% of the counts, is not significantly shifted from that of WT and the shape is similar. Thus, the adhesion to the surface of Δpsl is primarily symmetric. A high peak around 1 (Figure 2a, dotted orange line), corresponds to bacteria standing on end and results in 29% of the counts falling below 2.5.
Fig. 2.

Analysis of tracked projected aspect ratio measurements for WT and knockout bacteria. (a) Normalized histograms of the aspect ratios of WT, Δpsl, and ΔpelΔpsl. The position of the main peak for ΔpelΔpsl is shifted to the left of the main peak for WT and Δpsl, indicating that ΔpelΔpsl spend more time tilting up off the surface. For Δpsl, a second peak near 1 corresponds to bacteria standing on end. (b) Normalized histograms of the tracked projected aspect ratios of WT and Δpel. For Δpel, the position of the main peak is shifted to the left, indicating that these bacteria spend more time tilted up than do the WT
Precise estimates of the tilt angles are complicated by the limited depth of field of the microscopy images, as detailed in the Supplementary Materials and Figure S5.
Knocking out pel makes attachment to the surface non-symmetric
In contrast, the main peak of the ΔpelΔpsl tracked projected aspect ratio histogram is shifted to a smaller value than that of the WT (Figure 2a, green dash-dot line) and the shape of the distribution changes to become more asymmetric, increasing the bias toward low tracked projected aspect ratios. Even without a high peak at 1, 22% of the counts are below the 2.5 threshold, indicating that the ΔpelΔpsl strain spends nearly an order of magnitude more of their time on the surface tilted up than do the WT. Similarly, the location of the main peak of the histogram of tracked projected aspect ratios for Δpel is also shifted to a smaller value than that for the WT and the shape of the distribution becomes more asymmetric, increasing the bias toward lower aspect ratios (Figure 2b, dashed blue line). Including the small shoulder at 1.4, 22% of the Δpel projected aspect ratio counts are below the threshold of 2.5, indicating that the Δpel bacteria also spend about an order of magnitude more of their time on the surface tilting up than do the WT. We also observe that the Δpel bacteria are more likely than the WT to form disorganized, three-dimensional piles of bacteria. This may be related to the tendency to raise one end, which could facilitate a bacterium resting partially atop an adjacent bacterium.
Our observations suggest that Pel is important for making adhesion to the surface symmetric along the length of the bacterium, so that bacteria lie down flat. Lying flat is often considered a signature of permanent attachment. However, as the Δpel bacteria do not detach from the surface more often than the WT, we conclude that the surface adhesion component of permanent attachment can occur independently of the bacteria lying flat on the surface.
Knocking out pel makes adhesion to the surface less short-ranged
To investigate how Pel might act to promote symmetric, flat adhesion, we use an AFM to measure forces exerted in pulling bacteria off a surface and compare symmetrically-adhering WT with non-symmetrically-adhering Δpel and ΔpelΔpsl. Retraction force curves for WT bacteria typically have a single primary force maximum (Figure 3a, red solid line). A histogram of maximum peak forces shows that, of the strains we study, the WT bacteria give the highest values, with the histogram peaked around 2.3 nN (Figure 3b, red solid line). The maximum force is typically exerted at a height between 10 nm and 45 nm above the surface, most commonly ~20 nm (Figure 3c, red solid line). We define the range over which adhesion acts as the first height location at which the adhesion force returns to zero; neglecting occasional secondary peaks, this corresponds to complete detachment from the surface. For WT, the histogram of adhesion’s range is peaked at ~100 nm (Figure 3d, red solid line).
Fig. 3.

AFM measurements of force during retraction from a glass surface for WT, Δpel, and ΔpelΔpsl. (a) Representative individual force curves, showing representative features of each type. The ΔpelΔpsl force curve is smaller and shorter-ranged than the WT. The Δpel curve has a smaller maximum force, but is much longer-ranged than the WT. (b) Histograms of maximum forces. WT has the largest forces, followed by Δpel, then ΔpelΔpsl. (c) Histograms of the separation at maximum force. Nearly all ΔpelΔpsl curves peak at less than 5 nm separation, while WT range between 5 nm and 45 nm. There is no apparent peak for Δpel. (d) Histograms of the range of adhesion force. Again, ΔpelΔpsl is shifted to smaller values relative to WT, while Δpel ranges are widely spread with no clear peak. In (c) and (d), the last bin contains all measurements with values greater than that shown on the x-axis, so the apparent peak of Δpel at those bins is not real.
For the Δpel mutants, the force curves are much less regular, with many more secondary maxima (Figure 3a, blue dashed line). A histogram of the maximum forces measured in ~100 trials shows that this distribution is broader than that of the WT and peaked at a force of around 1.9 nN (Figure 3b, blue dashed line), ~17% weaker than the peak of the corresponding WT histogram (Figure 3b, red solid line). The secondary force maxima often differ from the primary force maximum by less than 10%, which makes the height above the surface at which the maximum force occurs a measurement of doubtful utility for this strain; correspondingly, a histogram of measurements of the height corresponding to maximum force shows no peak (Figure 3c, blue dashed line). These observations indicate that the adhesion force is de-localized compared with the adhesion force of the WT. This interpretation is in agreement with measurements of adhesion range: the Δpel measurements nearly all show a range of adhesion of over 300 nm and 25% have a range of over 1 μm (Figure 3d, blue dashed line), which is an order of magnitude greater than the most-common range measured for WT.
The additive effect of knocking out psl is seen in the retraction curves from ΔpelΔpsl. These have a smaller maximum force at shorter height above the surface (Figure 3a, green dash-dot line). The peak force exerted is reduced to less than 50% of the WT value and less than 60% of the Δpel value (Figure 3b, green dash-dot line). The height above the surface at which maximum adhesive force is exerted is reduced to ~25% of the WT value (Figure 3c, green dash-dot line). The range over which adhesive force is exerted is reduced to ~50% of the WT value (Figure 3d, green dash-dot line).
In summary, knocking out pel alone reduces the maximum adhesive force only minimally, usually by less than 20%. This agrees well with our measured dwell times (Figure 1) that show that Δpel knockouts dwell on the surface as permanently as do WT bacteria. It also agrees well with our inference (from comparing dwell times of Δpsl with those of ΔpelΔpsl, Figure 1) that Pel can confer some adhesivity on its own. However, by far the most striking result of these force curve measurements is that knocking out pel extends the range of the adhesive force to a length comparable to that of a bacterium. This agrees well with our tracked projected aspect ratio measurements that show that Δpel and ΔpelΔpsl knockouts are at least ten times more likely to be tilted up off the surface than are the WT. Thus, we infer that for WT PAO1, which expresses both Pel and Psl, Pel does not itself confer most of the adhesivity to surfaces, but rather makes Psl-originating adhesion short-ranged and phenomenologically symmetric (to optical microscopy) along the length of rod-shaped P. aeruginosa. We speculate that the Pel may be involved in cross-linking the Psl, making the adhesion shorter-ranged and stronger, and that without Pel, the Psl forms a less-structured matrix which maintains a more consistent adhesion force over a longer distance from the surface.
Knocking out pel impairs inter-bacterial cohesions
Previous studies have shown that Pel is important for cell–cell cohesions in maturing biofilms that are at least a day old. To compare Pel’s cohesive role with its adhesive role in very early biofilm formation, we measure the lifetimes of cohesions between pairs of WT bacteria and between pairs of Δpel knockout bacteria. Cohesion lifetime is the intercellular counterpart to the surface dwell times we measured in Figure 1. The longest cohesion recorded in a Δpel movie was 31.5 minutes, while there were several longer cohesions in the WT movies, up to 64 minutes. Cohesion lifetime datasets follow exponential distributions, suggesting that exiting a cohesion may be described by a Poisson process; in contrast, WT and Δpel surface dwell times are dominated by the doubling time of the bacteria, which has a roughly Gaussian distribution. We fit exponential distributions of the form
| (1) |
to the raw cohesion lifetime data to get a measure of the average cohesion lifetime. Fitting to all the data, we get means of μ = 5.52 min and μ = 4.00 min and non-overlapping 99% confidence intervals of 4.91–6.25 min and 3.50–4.60 min for WT and Δpel, respectively. Histograms of the lifetimes, plotted as points at the centre of each bin, and the exponential distribution fits are shown in Figure 4. From these measurements, we find that knocking out pel shortens the lifetime of inter-bacterial cohesions by ~18%–28%. If we compare this to the ~1000% increase in the time that Δpel bacteria spend tilting up (Figure 2b and associated discussion), we find that the effect of Pel on surface adhesion is greater than its effect on intercellular cohesion for very early biofilm development.
Fig. 4.

Normalized histograms of cohesion lifetimes of WT and Δpel. Lines are exponential distribution fits to the data. The solid red line is a fit to all of the WT data, while the dotted line is a fit only to WT lifetimes of less than 32 minutes. Excluding longer cohesions eliminates any possibility of biasing that may result from cohesions longer than the longest Δpel cohesion and decreases the mean to 4.88 min, 20% above the Δpel mean. The 99% confidence interval of WT changes to 4.34–5.53 min, which overlaps with the 99% confidence interval of Δpel. However, the 95% confidence intervals of the truncated WT fit (4.46–5.37) and Δpel fit (3.61–4.45) lie just outside of one another. The solid blue line is a fit to all of the Δpel data.
Conclusions
We find that the Pel polysaccharide is important to surface adhesion in very early stages of PAO1 biofilm development by mediating the transition to bacteria lying flat on the surface. Pel does so by making the force of adhesion to the surface shortranged and phenomenologically (to optical microscopy) symmetric along the length of the rod-shaped bacterium. Unlike previous work studying the PAK strain of Pseudomonas aeruginosa, the effects of Pel on surface adhesion that we observe occur in the presence of pili and other motility appendages.6, 7, 30, 31 Along with this observation, we document that bacteria can be permanently adhered to the surface without lying down flat. We therefore suggest that the “permanent attachment” stage of biofilm formation should be thought of as having two sub-components, permanent adhesion and lying flat.
Supplementary Material
Acknowledgments
The authors thank Prof. Matthew Parsek (University of Washington, Seattle) for the bacterial strains. D.P. was supported by NIH grant GM068855-02. B.J.C., T.W.T., H.H.L, D.A.H, and V.D.G. were supported by startup funds from the University of Texas at Austin.
References
- 1.Parsek MR, Singh PK. Annual Review of Microbiology. 2003;57:677–701. doi: 10.1146/annurev.micro.57.030502.090720. [DOI] [PubMed] [Google Scholar]
- 2.Costerton JW, Stewart PS, Greenberg EP. Science. 1999;284:1318–1322. doi: 10.1126/science.284.5418.1318. [DOI] [PubMed] [Google Scholar]
- 3.O’Toole GA. Journal of Bacteriology. 2003;185:2687–2689. doi: 10.1128/JB.185.9.2687-2689.2003. [DOI] [PMC free article] [PubMed] [Google Scholar]
- 4.Ophir T, Gutnick DL. Applied and Environmental Microbiology. 1994;60:740–745. doi: 10.1128/aem.60.2.740-745.1994. [DOI] [PMC free article] [PubMed] [Google Scholar]
- 5.Ryder C, Byrd M, Wozniak DJ. Current Opinion in Microbiology. 2007;10:644–648. doi: 10.1016/j.mib.2007.09.010. [DOI] [PMC free article] [PubMed] [Google Scholar]
- 6.Yang L, Hu Y, Liu Y, Zhang J, Ulstrup J, Molin S. Environmental Microbiology. 2011;13:1705–1717. doi: 10.1111/j.1462-2920.2011.02503.x. [DOI] [PubMed] [Google Scholar]
- 7.Colvin KM, Gordon VD, Murakami K, Borlee BR, Wozniak DJ, Wong GCL, Parsek MR. Plos Pathogens. 2011;7:e1001264. doi: 10.1371/journal.ppat.1001264. [DOI] [PMC free article] [PubMed] [Google Scholar]
- 8.Mann EE, Wozniak DJ. FEMS Microbiology Reviews. 2012;36:893–916. doi: 10.1111/j.1574-6976.2011.00322.x. [DOI] [PMC free article] [PubMed] [Google Scholar]
- 9.Singh PK, Schaefer AL, Parsek MR, Moninger TO, Welsh MJ, Greenberg EP. Nature. 2000;407:762–764. doi: 10.1038/35037627. [DOI] [PubMed] [Google Scholar]
- 10.Wolcott RD, Rumbaugh KP, James G, Schultz G, Phillips P, Yang Q, Watters C, Stewart PS, Dowd SE. Journal of wound care. 2010;19:320–328. doi: 10.12968/jowc.2010.19.8.77709. [DOI] [PubMed] [Google Scholar]
- 11.O’Toole G, Kaplan HB, Kolter R. Annual Review of Microbiology. 2000;54:49–79. doi: 10.1146/annurev.micro.54.1.49. [DOI] [PubMed] [Google Scholar]
- 12.Palmer RJ, Jr, White DC. Trends in Microbiology. 1997;5:435–440. doi: 10.1016/S0966-842X(97)01142-6. [DOI] [PubMed] [Google Scholar]
- 13.Ghafoor A, Hay ID, Rehm BHA. Applied and Environmental Microbiology. 2011;77:5238–5246. doi: 10.1128/AEM.00637-11. [DOI] [PMC free article] [PubMed] [Google Scholar]
- 14.Jackson KD, Starkey M, Kremer S, Parsek MR, Wozniak DJ. Journal of Bacteriology. 2004;186:4466–4475. doi: 10.1128/JB.186.14.4466-4475.2004. [DOI] [PMC free article] [PubMed] [Google Scholar]
- 15.Ma L, Jackson KD, Landry RM, Parsek MR, Wozniak DJ. Journal of Bacteriology. 2006;188:8213–8221. doi: 10.1128/JB.01202-06. [DOI] [PMC free article] [PubMed] [Google Scholar]
- 16.Byrd MS, Pang B, Mishra M, Swords WE, Wozniak DJ. mBio. 2010;1:e00140–10. doi: 10.1128/mBio.00140-10. [DOI] [PMC free article] [PubMed] [Google Scholar]
- 17.Colvin KM, Irie Y, Tart CS, Urbano R, Whitney JC, Ryder C, Howell PL, Wozniak DJ, Parsek MR. Environmental Microbiology. 2012;14:1913–1928. doi: 10.1111/j.1462-2920.2011.02657.x. [DOI] [PMC free article] [PubMed] [Google Scholar]
- 18.Heydorn A, Nielsen AT, Hentzer M, Sternberg C, Givskov M, Ersboll BK, Molin S. Microbiology. 2000;146:2395–2407. doi: 10.1099/00221287-146-10-2395. [DOI] [PubMed] [Google Scholar]
- 19.Rasband WS. ImageJ. U.S. National Institutes of Health; Bethesda, Maryland, USA: 1997–2012. [Google Scholar]
- 20.Schindelin J, Arganda-Carreras I, Frise E, Kaynig V, Longair M, Pietzsch T, Preibisch S, Rueden C, Saalfeld S, Schmid B, Tinevez JY, White DJ, Hartenstein V, Eliceiri K, Tomancak P, Cardona A. Nature Methods. 2012;9:676–682. doi: 10.1038/nmeth.2019. [DOI] [PMC free article] [PubMed] [Google Scholar]
- 21.Crocker JC, Grier DG. Journal of Colloid and Interface Science. 1996;179:298–310. [Google Scholar]
- 22.Gibiansky ML, Conrad JC, Jin F, Gordon VD, Motto DA, Mathewson MA, Stopka WG, Zelasko DC, Shrout JD, Wong GCL. Science. 2010;330:197–197. doi: 10.1126/science.1194238. [DOI] [PubMed] [Google Scholar]
- 23.Touhami A, Jericho MH, Boyd JM, Beveridge TJ. Journal of Bacteriology. 2006;188:370–377. doi: 10.1128/JB.188.2.370-377.2006. [DOI] [PMC free article] [PubMed] [Google Scholar]
- 24.Atabek A, Liu Y, Pinzon-Arango PA, Camesano TA. Colloids and Surfaces B: Biointerfaces. 2008;67:115–121. doi: 10.1016/j.colsurfb.2008.08.013. [DOI] [PubMed] [Google Scholar]
- 25.Flemming HC, Neu TR, Wozniak DJ. J Bacteriol. 2007;189:7945–7947. doi: 10.1128/JB.00858-07. [DOI] [PMC free article] [PubMed] [Google Scholar]
- 26.Wozniak DJ, Wyckoff TJO, Starkey M, Keyser R, Azadi P, O’Toole GA, Parsek MR. Proceedings of the National Academy of Sciences. 2003;100:7907–7912. doi: 10.1073/pnas.1231792100. [DOI] [PMC free article] [PubMed] [Google Scholar]
- 27.Ma L, Conover M, Lu H, Parsek MR, Bayles K, Wozniak DJ. PLoS Pathogens. 2009;5:e1000354. doi: 10.1371/journal.ppat.1000354. [DOI] [PMC free article] [PubMed] [Google Scholar]
- 28.Ma L, Wang S, Wang D, Parsek MR, Wozniak DJ. FEMS Immunology & Medical Microbiology. 2012;65:377–380. doi: 10.1111/j.1574-695X.2012.00934.x. [DOI] [PubMed] [Google Scholar]
- 29.Yang L, Hengzhuang W, Wu H, Damkiar S, Jochumsen N, Song Z, Givskov M, Hoiby N, Molin S. FEMS Immunology & Medical Microbiology. 2012;65:366–376. doi: 10.1111/j.1574-695X.2012.00936.x. [DOI] [PubMed] [Google Scholar]
- 30.Friedman L, Kolter R. Molecular Microbiology. 2004;51:675–690. doi: 10.1046/j.1365-2958.2003.03877.x. [DOI] [PubMed] [Google Scholar]
- 31.Vasseur P, Vallet-Gely I, Soscia C, Genin S, Filloux A. Microbiology. 2005;151:985–997. doi: 10.1099/mic.0.27410-0. [DOI] [PubMed] [Google Scholar]
Associated Data
This section collects any data citations, data availability statements, or supplementary materials included in this article.