

Abstract
The Cree communities of James Bay are at risk for contracting infectious diseases transmitted by wildlife. Data from serological testing for a range of zoonotic infections performed in the general population (six communities), or trappers and their spouses (one community), were abstracted from four population-based studies conducted in Cree territory (Quebec) between 2005 and 2009. Evidence of exposure to Trichinella species, Toxoplasma gondii, Toxocara canis, Echinococcus granulosus, Leptospira species, Coxiella burnetii and Francisella tularensis was verified in all communities, whereas antibodies against Sin Nombre virus and California serogroup viruses (Jamestown Canyon and snowshoe hare viruses) were evaluated in three and six communities, respectively. Seroprevalence varied widely among communities: snowshoe hare virus (1% to 42%), F tularensis (14% to 37%), Leptospira species (10% to 27%), Jamestown Canyon virus (9% to 24%), C burnetii (0% to 18%), T gondii (4% to 12%), T canis (0% to 10%), E granulosus (0% to 4%) and Trichinella species (0% to 1%). No subject had serological evidence of Sin Nombre virus exposure. These data suggest that large proportions of the Cree population have been exposed to at least one of the targeted zoonotic agents. The Cree population, particularly those most heavily exposed to fauna, as well as the medical staff living in these regions, should be aware of these diseases. Greater awareness would not only help to decrease exposures but would also increase the chance of appropriate diagnostic testing.
Keywords: California serogroup viruses, Coxiella burnetii, Cree, Echinococcus granulosus, Francisella tularensis, Jamestown Canyon virus, Leptospira, Seroprevalence, Sin Nombre virus, Snowshoe hare virus, Toxocara canis, Toxoplasma gondii, Trichinella, Zoonosis
Abstract
Les communautés cries de la Baie James sont vulnérables aux maladies infectieuses transmises par les animaux sauvages. Les données tirées des tests sérologiques sur une série de zoonoses effectués dans la population générale (six communautés) ou chez les trappeurs et leur conjointe (une communauté) ont été extraites de quatre études en population menées en territoire cri, au Québec, entre 2005 et 2009. Les manifestations d’exposition aux espèces de Trichinella, au Toxoplasma gondii, au Toxocara canis, à l’Echinococcus granulosus, aux espèces de Leptospira, au Coxiella burnetii et au Francisella tularensis ont été vérifiées dans toutes les communautés, tandis que les anticorps contre le virus Sin Nombre et les virus du sérogroupe Californie (virus Jamestown Canyon et snowshoe hare) ont été évalués dans trois et six communautés, respectivement. La séroprévalence variait considérablement selon les communautés, comme suit : virus snowshoe hare (1 % à 42 %), F tularensis (14 % à 37 %), espèces de Leptospira (10 % à 27 %), virus Jamestown Canyon (9 % à 24 %), C burnetii (0 % à 18 %), T gondii (4 % à 12 %), T canis (0 % à 10 %), E granulosus (0 % à 4 %) et espèces de Trichinella (0 % à 1 %). Aucun sujet n’avait de manifestation sérologique d’exposition au virus Sin Nombre. Ces données laissent supposer que de fortes proportions de la population crie ont été exposées à au moins l’un des agents zoonotiques ciblés. La population crie, notamment les peuples les plus exposés aux animaux sauvages, ainsi que le personnel médical qui habite dans ces régions, devrait connaître ces maladies. Une meilleure sensibilisation contribuerait non seulement à réduire les expositions, mais accroîtrait également la possibilité de tests diagnostiques pertinents.
The James Bay territory covers an area of 350,000 km2, extending from the 49th to the 55th parallel. This region is home to more than 12,000 indigenous Cree grouped into nine communities in northwestern Quebec (Figure 1). The traditional eating habits of the Cree are based on everything that nature offers in their territory including a range of game meats, fish and wild berries. However, their dietary regimen has changed dramatically over the past 25 years, driven in large part by the development of hydroelectric power generation systems and other northern development activities. The diet of the Cree population now includes an increasing proportion of store-bought foods (1,2). Despite this, they remain attached to their traditional practices of hunting, fishing and trapping. These activities keep them in close contact with wildlife and expose them to potential risks of zoonotic diseases.
Figure 1).
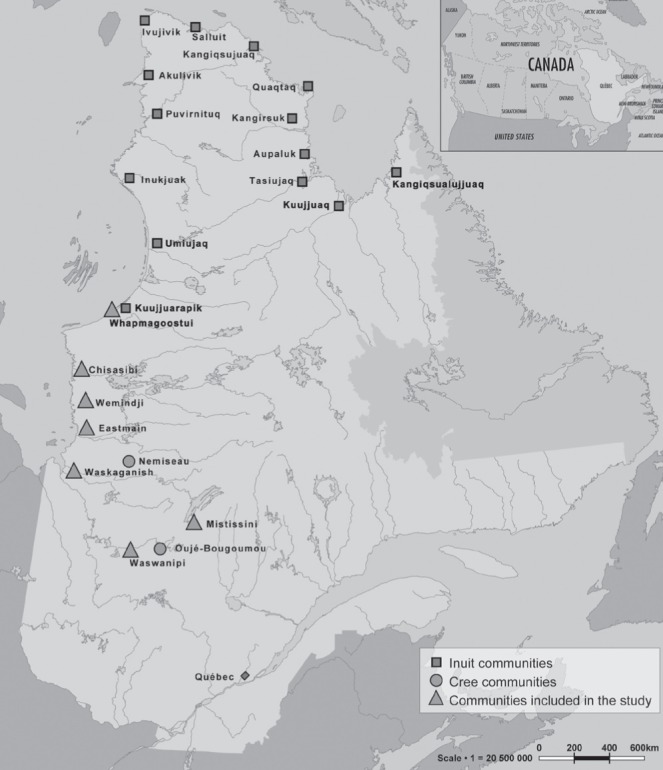
Cree and Inuit communities of Quebec. Source: Graphics Services, Centre de recherche, Centre hospitalier universitaire de Québec, Quebec, Quebec
Zoonoses are an important public health concern. It has recently been estimated that 75% of emerging infectious diseases in humans over the past 10 years were caused by pathogens from animals or animal products (3). Thus, it is prudent to periodically monitor the prevalence of some zoonotic pathogens in the Cree communities. The pathogens targeted for study were chosen based on the long-term persistence of antibodies, permitting past infections to be documented along with known or likely epidemiological risk. Selection of the specific zoonoses was made in collaboration with Quebec public health authorities in the Cree territories.
From 2005 to 2009, four different datasets were collected in seven Cree communities of Quebec. Some data from these studies have already been published (4–6) (Table 1). The main objective of the present study was to provide an overview of the seroprevalences of targeted zoonoses in these Cree communities.
TABLE 1.
Summary of zoonotic pathogens studied in Cree communities (2005–2009)
| Pathogen | Waswanipi/Whapmagoostui 2009 | Chisasibi/Waskaganish* 2008 | Eastmain/Wemindji† 2007 | Mistissini‡ 2005 | |||
|---|---|---|---|---|---|---|---|
|
|
|
|
|||||
| Waswanipi | Whapmagoostui | Chisasibi | Waskaganish | Eastmain | Wemindji | ||
| Coxiella burnetii | 1 | 1 | 0 | 0 | 0 | 0 | 0 |
| Leptospira species | 1 | 1 | 0 | 0 | 0 | 0 | 0 |
| Francisella tularensis | 1 | 1 | 0 | 0 | 0 | 0 | 0 |
| Echinococcus granulosus | 1 | 1 | 0 | 0 | 0 | 0 | 0 |
| Toxocara canis | 1 | 1 | 0 | 0 | 0 | 0 | 0 |
| Toxoplasma gondii | 1 | 1 | 0 | 0 | 0 | 0 | 0 |
| Trichinella species | 1 | 1 | 0 | 0 | 0 | 0 | 0 |
| California serogroup§ | 1 | 1 | 1 | 1 | 0 | 0 | – |
| JC virus | 1 | 1 | 1 | 1 | 0 | 0 | – |
| SSH virus | 1 | 1 | 1 | 1 | 0 | 0 | – |
| Sin Nombre virus | – | – | – | – | 0 | 0 | 0 |
METHODS
Data were collected on seven of the nine Cree communities in Quebec (Figure 1) at four different time points: Mistissini in 2005, Eastmain/Wemindji in 2007, Chisasibi/Waskaganish in 2008 and Waswanipi/Whapmagoostui in 2009. These studies were conducted in the setting of the “Nituuchischaayihtitaau Aschii Multi-Community Environment and Health Longitudinal Study in Iiyiyiu Aschii”, a survey designed to gather social and other information on a variety of themes, including zoonoses (7). With the exception of the Mistissini study (5), which focused on a voluntary sample of 50 hunters and their wives, study subjects in other investigations were randomly selected from the general population based on the census lists of each community. The following age categories were considered: children between zero and seven years of age, children between eight and 14 years of age, teenagers and adults between 15 and 39 years of age and adults >40 years of age. Weights were assigned to each stratum to ensure adequate population representation (6,7). However, individuals ≥18 years of age were eligible for inclusion in the zoonoses study, except in Eastmain/Wemindji where the age criterion was ≥15 years (4). The protocol of the “Nituuchischaayihtitaau Aschii Multi-Community Environment and Health Longitudinal Study in Iiyiyiu Aschii” was approved by the Research Committee of the Cree Board of Health and Social Services of James Bay and by the Ethics Committee of the Research Centre of Centre hospitalier universitaire de Québec (Quebec, Quebec).
The zoonoses targeted included three bacterial infections (Coxiella burnetii, Francisella tularensis and Leptospira species) and four parasitic infections (Echinococcus granulosus, Toxocara canis, Toxoplasma gondii and Trichinella species). The Sin Nombre virus was also targeted in three communities (Mistissini in 2005 and Eastmain/Wemindji in 2007) along with two mosquito-borne bunyaviruses of the California serogroup (Jamestown Canyon [JC] and snowshoe hare [SSH] viruses) (8) in all communities (Eastmain/Wemindji in 2007, Chisasibi/Waskaganish in 2008 and Waswanipi/Whapmagoostui in 2009) except Mistissini.
Immunoglobulin (Ig) G antibodies against Trichinella species, T canis, E granulosus (SCI Inc, USA), T gondii (AxSYM, Abbott Diagnostics, USA), Leptospira species and C burnetii (Virion\Serion, Serion Immundiagnostica GmbH, Germany) were detected using ELISA. Antibodies against F tularensis were detected using tube agglutination testing (9,10). For California serogroup viruses, in Eastmain/Wemindji, noncommercial Centers for Disease Control and Prevention-based ELISAs were undertaken to detect IgM and IgG (11). The presence of JC and SSH virus-specific antibodies in ELISA-positive samples was confirmed by plaque reduction neutralization tests (PRNT) (12). The same methods were used in Chisasibi/Waskaganish, but IgM was not tested. Finally, after protocol modification at the National Microbiology Laboratory, in Waswanipi/Whapmagoostui, only PRNT confirmatory serology was conducted immediately to detect IgG/neutralizing antibodies against California serogroup viruses. Samples with PRNT titres ≥1:20 were deemed to be positive. In cases in which only PRNT was used (Waswanipi/Whapmagoostui) and a serum sample indicated a positive neutralizing titre for both JC and SSH viruses, the exposure was attributed to the virus with the highest titres, and the lower titres were considered to be indicative of cross-reactions. If PRNT titres ≥1:20 were found for both viruses, the subject was considered to be positive for the California serogroup, with unspecified viral type. Because IgG ELISAs were used to screen for California serogroup antibody in initial studies involving several of the communities, IgG ELISA was compared with PRNT (considered as the test of reference) for a subset of 60 samples (40 positive and 20 negative by PRNT) selected randomly from Waswanipi and Whapmagoostui (approximately equal numbers from each community) to determine the sensitivity and the specificity of IgG ELISA. Criteria for the interpretation of serological analyses are presented in Table 2.
TABLE 2.
Criteria for the interpretation of serology analyses
| Pathogens |
Criteria
|
||
|---|---|---|---|
| Negative | Equivocal | Positive | |
| Optical density | |||
| Trichinella species | <0.25 | ≥0.25 to <0.35 | ≥0.35 |
| Toxocara canis | <0.25 | ≥0.25 to <0.35 | ≥0.35 |
| Echinococcus granulosus | <0.35 | ≥0.35 to <0.45 | ≥0.45 |
| Sin Nombre virus (IgG/IgM): serum diluted 1:400 | <0.30 | ≥0.30 to <1.0 | ≥1.0 |
| IgG, IU/mL | |||
| Leptospira species | <5 | ≥5 to ≤9 | >9 |
| Coxiella burnetii | <20 | ≥20 to <30 | ≥30 |
| Toxoplasma gondii | <2 | ≥2 to <3 | ≥3 |
| Titres | |||
| Francisella tularensis | <1/20 | – | ≥1/20 |
| California serogroup* | <1/20 | – | ≥1/20 |
Serology for snowshoe hare and Jamestown Canyon viruses. These titres correspond to confirmatory serology (plaque reduction neutralization tests [PRNT]) on serum samples diluted 1:20 and greater; Immunuglobulin (Ig) G and IgM ELISAs were performed at serum dilutions of 1:400 as screening assays for Eastmain/Wemindji, and screening IgG ELISAs were performed for Chisasibi/Waskaganish. Only PRNT assays were performed to detect IgG/neutralizing antibodies against California serogroup viruses in serum collected from residents of Waswanipi/Whapmagoostui
Given the importance of timing in zoonoses, the seroprevalence data were stratified according to year of collection and community. The variable ‘zoonosis’ was created to describe positive results for any of the pathogens tested. The exact binomial 95% CIs (13) for the prevalence of exposure to the different pathogens along with the sensitivity and specificity of IgG ELISA were calculated using SAS version 9.2 (SAS Institute, USA).
RESULTS
For studies in which participants were selected from the general population, percentage of participation of the total adult populations (≥18 years of age for all studies, except in Eastmain/Wemindji where the criterion was ≥15 years of age) ranged from 28.5% to 60.1% (57.5% in Eastmain, 60.1% in Wemindji, 32.5% in Chisasibi, 31.1% in Waskaganish, 28.5% in Waswanipi and 39.4% in Whapmagoostui).
Table 3 presents the results of serological analyses and Table 4 presents the seropositive individuals stratified according to the number of positive results for the different pathogens. Overall, participants who exhibited serological evidence of at least one zoonosis ranged from 42% in Wemindji to 82% in Waswanipi. Variations in seroprevalence were relatively high for the different pathogens, particularly for SSH virus (1% to 42%), F tularensis (14% to 37%), Leptospira species (10% to 27%), JC virus (9% to 24%), C burnetii (0% to 18%), T gondii (4% to 12%) and T canis (0% to 10%). Seroprevalences of <5% were observed for E granulosus (0% to 4%) and Trichinella species (0% to 1%). In general, seroprevalences were lower for the parasitic zoonoses. No subject showed serological evidence of Sin Nombre virus exposure in the three communities in which it was investigated.
TABLE 3.
Seroprevalence of zoonoses in Cree communities
| Waswanipi/Whapmagoostui 2009 | Chisasibi/Waskaganish 2008 | Eastmain/Wemindji 2007 | Mistissini* 2005 (n=50) | ||||
|---|---|---|---|---|---|---|---|
|
|
|
|
|||||
| Waswanipi (n=91) | Whapmagoostui (n=89) | Chisasibi (n=166) | Waskaganish (n=101) | Eastmain (n=111) | Wemindji (n=140) | ||
| Coxiella burnetii | 0 (0–4.0) | 0 (0–4.1) | 6 (2.5–10.2) | 2 (0.2–7.0) | 1 (0.02–4.9) | 2 (0.5–6.2) | 18 (8.6–31.4) |
| Leptospira species | 10 (4.6–18.0) | 19 (13.4–31.3) | 27 (20.2–34.3) | 16 (9.4–24.7) | 21 (13.6–29.5) | 25 (18.2–33.2) | 14 (5.8–26.7) |
| Francisella tularensis | 24 (15.8–34.3) | 37 (27.1–48.0) | 16 (10.6–22.4) | 22 (14.3–31.4) | 20 (12.9–28.5) | 14 (9.1–21.5) | 26 (16.0–43.5) |
| Echinococcus granulosus | 4 (1.2–10.9) | 3 (0.7–9.5) | 1 (0.02–3.4) | 1 (0.0–5.4) | 4 (1.5–10.2) | 3 (0.8–7.2) | 0 (0–0.7.1) |
| Toxocara canis | 6 (1.8–12.4) | 0 (0–4.1) | 1 (0.02–3.4) | 10 (4.9–17.5) | 5 (2.0–11.4) | 1 (0.2–5.1) | 4 (0.5–13.7) |
| Toxoplasma gondii | 12 (6.2–20.6) | 12 (6.3–21.0) | 12 (7.7–18.3) | 4 (1.1–9.9) | 5 (2.0–11.4) | 5 (2.0–10.0) | 10 (3.3–21.8) |
| Trichinella species | 0 (0–4.0) | 1 (0.03–6.1) | 0 (0–2.2) | 0 (0–3.6) | 0 (0–3.3) | 1 (0.2–5.1) | 0 (0–7.1) |
| California serogroup† | 65 (54.1–74.6) | 44 (33.7–55.3) | 17 (11.1–23.0) | 29 (20.2–38.6) | 10 (5.1–17.0) | 9 (5.0–15.4) | – |
| JC virus | 19 (11.3–28.2) | 24 (15.4–34.1) | 13 (8.6–19.6) | 23 (15.0–32.2) | 10 (3.8–14.8) | 9 (4.5–14.5) | – |
| SSH virus | 42 (31.5–52.6) | 14 (7.3–22.6) | 3 (1.0–7.0) | 6 (2.2–12.5) | 3 (0.2–6.4) | 1 (0.2–5.1) | – |
| Sin Nombre virus | – | – | – | – | 0 (0–3.3) | 0 (0–2.6) | 0 (0–7.1) |
| Zoonosis‡ | 82 (73.0–89.6) | 75 (65.0–83.8) | 51 (45.4–60.7) | 60 (55.6–74.4) | 50 (40.8–60.1) | 42 (34.1–51.1) | 46 (31.4–60.8) |
Data presented as % zoonoses (95% CI).
Sample of hunters and their wives;
Serology tested for snowshoe hare (SSH) and Jamestown Canyon (JC) viruses;
Results positive for at least one of the pathogens tested
TABLE 4.
Seropositive individuals stratified according to the number of positive results for the different pathogens in Cree communities
| Frequency | Waswanipi (n=91) | Whapmagoostui (n=89) | Chisasibi (n=166) | Waskaganish (n=101) | Eastmain (n=111) | Wemindji (n=140) | Mistissini (n=50) |
|---|---|---|---|---|---|---|---|
| One pathogen | 45 (50) | 36 (41) | 53 (32) | 45 (45) | 40 (36) | 38 (27) | 20 (40) |
| Two pathogens | 25 (28) | 27 (30) | 23 (14) | 13 (13) | 14 (13) | 16 (11) | 3 (6) |
| Three pathogens | 5 (6) | 4 (5) | 9 (5) | 3 (3) | 2 (2) | 4 (3) | 0 (0) |
| Four or more pathogens | 0 (0) | 0 (0) | 0 (0) | 0 (0) | 0 (0) | 1 (1) | 0 (0) |
| Total | 75 (82) | 67 (75) | 85 (51) | 61 (60) | 56 (51) | 59 (42) | 23 (46) |
Data presented as n (%)
Table 5 compares the IgG ELISA and PRNT results for detection of California serogroup virus antibody in sera from residents of Waswanipi/Whapmagoostui. Overall, in the sample of 60 participants, the California serogroup virus (JC + SSH) IgG ELISA had a sensitivity of 77.5% and a specificity of 100% when compared with PRNT assays used for the detection of antibody to these viruses.
TABLE 5.
Immunoglobulin G (IgG) ELISA sensitivity and specificity for detection of antibodies to California serogroup viruses
Jamestown Canyon (JC) virus IgG ELISA sensitivity: 18 of 21=85.7% (95% CI 63.7 to 97.0). Snowshoe hare (SSH) virus IgG ELISA sensitivity: 13 of 19=68.4% (95% CI 43.5 to 87.4). California serogroup virus: IgG ELISA sensitivity (JC+SSH): 31 of 40=77.5% (95% CI 61.6 to 89.2); IgG ELISA specificity (JC+SSH): 20 of 20=100% (95% CI 83.2 to 100).
− Negative; PRNT Plaque reduction neutralization test;
+ Positive
DISCUSSION
Given the varying participation rates in these different studies, which can influence the external validity of results, comparisons between the documented prevalence should be interpreted with caution. Nevertheless, data from such studies can help to estimate the relative importance of the findings reported here, and we believe that the current study provides a contemporary portrait of zoonotic infections in the Cree communities.
More than three-quarters of the total population studied were seropositive for at least one of the zoonotic organisms among participants from Waswanipi (82%) and Whapmagoostui (75%). The proportion in Waswanipi was higher than in other communities except Whapmagoostui. The proportion of the latter, in turn, was higher than Chisasibi, Eastmain, Wemindji and Mistissini. These high proportions in Waswanipi/Whapmagoostui were most likely related to the high prevalence of infection by California serogroup viruses (especially SSH) using PRNT, which is more sensitive than IgG ELISA. Based on the comparative data shown in Table 5, the JC IgG ELISA used was only slightly less sensitive than PRNT, while the SSH IgG ELISA would have missed approximately 30% of the positive samples. Overall, our initial IgG ELISA screening protocol may have missed approximately 20% of positive California serogroup participants, making comparison of global seroprevalence difficult among the different studies. Even if the confidence intervals are wide (Table 5) due to the relatively small sample size, these results were obtained on a random sample representing one-third of the participants (60 of 180) of Waswanipi/Whapmagoostui. When the California serogroup viruses were excluded from the computation, 47% and 54% of the study participants tested positive for at least one pathogen in Waswanipi and Whapmagoostui, respectively. These results were more comparable with the results from other Cree communities.
Table 6 summarizes studied zoonotic pathogens along with information on reservoirs and modes of transmission adapted for Canada and northern regions. Of the infections investigated in the present study, leptospirosis, tularemia, Q fever, trichinellosis, Hantavirus infection and the encephalitis caused by arthropods are all notifiable diseases in Quebec. Even if the design of our survey does not allow for documentation of the clinical consequences of the infections investigated, our serological results suggest that many participants from the Cree communities under study had been exposed to one or more of these pathogens (Leptospira species, F tularensis, JC and SSH viruses, C burnetii and Trichinella species). However, not a single case of any of these infections had been reported from the Cree territories between 1990 and 2006 (14), indicating that these individuals had experienced few or no symptoms, had not sought care and/or had not been appropriately diagnosed.
TABLE 6.
Summary of studied zoonotic pathogens, with information on vectors and reservoir adapted for northern regions
| Pathogen | Distribution | Reservoir | Mode of transmission |
|---|---|---|---|
| Toxoplasma gondii | Worldwide | Felids (definitive host); other mammals (including marine mammals) and birds (intermediate hosts) | Consuming undercooked infected meat or oocysts from dirt and soil (children), ingesting water contaminated by oocysts, transplacental |
| Echinococcus granulosus | Worldwide rural areas | Canids (final host) Intermediate host (moose/deer-sylvatic cycle) |
Exposure to dog feces (hand-to-mouth transfer). Dogs shed eggs in feces after consuming internal organs of infected mammals |
| Toxocara canis | Worldwide | Dogs (definite host) | Consuming eggs in contaminated soil (children), contact with dogs feces, contaminated material (eg, unwashed raw vegetables) |
| Trichinella species | Worldwide | Bears, walrus, pigs | Ingestion of partially cooked or raw meat |
| Francisella tularensis | Nothern hemisphere | Muskrats, rabbits, hares, voles, rodents, ticks | Inoculation of skin, conjunctival sac, oropharyngial mucosa by contaminated material, handling/ingesting insufficiently cooked meat, tick bites |
| Leptospira species | Worldwide | Wild or domestic animals: dogs, rats, raccoons, swine, cattle | Contact of the skin or mucous membranes with material contaminated by urine of infected animals, exposure to contaminated water through water sports |
| Coxiella burnetii | Worldwide | Sheeps, goats, cattle, cats, dogs, birds, wild mammals | Airborne dissemination from dust contaminated by placental tissues, birth fluids or excreta from infected animals. |
| Jamestown Canyon virus | North America | Wild ungulates, especially white-tailed deer, and mosquitoes | Contact with infected mosquitoes |
| Snowshoe hare virus | North America, Eastern Asia | Wild mammals including snowshoe hares and mosquitoes | Contact with infected mosquitoes |
| Sin Nombre virus | North America | Deer mice (Peromyscus maniculatus) | Aerosolized deer mice excreta |
Even when the methods for detecting California viruses were modified, the proportions of JC virus seroprevalence were comparable among studies, although the sample size was small. The higher prevalence in Whapmagoostui (24%) and Waskaganish (23%) suggests a more conducive environment for mosquitoes and/or deer. Evidence of exposure to SSH virus was particularly high in Waswanipi (42%). Seroprevalences were lower and comparable among other communities (range 1% to 14%). This latter difference is likely due, at least in part, to the diagnostic methods used in testing sera from residents of Waswanipi/Whapmagoostui (ie, higher sensitivity of PRNT versus IgG ELISA for SSH virus). Nevertheless, the overall seroprevalence of the California viruses in these communities appeared to be quite high, a finding consistent with previous studies showing significant seroprevalence of California serogroup viruses in other regions within North American (15,16).
Our findings suggest that exposures to F tularensis and Leptospira species are frequent in the Cree population. Seroprevalence for F tularensis in Whapmagoostui was relatively high, particularly when compared with the seroprevalence for this bacterium in Chisasibi and Wemindji. In Canada, contact with rabbits was the most common cause of human tularemia before the 1950s, while later, contact with the water-living muskrats grew in importance (17). Handling muskrats has also been associated with the seroprevalence of F tularensis in southern Quebec (18). Leptospira species seropositivity was comparable in all communities, although the proportions documented in Chisasibi (27%) and Wemindji (25%) were higher than that of Waswanipi, which had the lowest seroprevalence. Rodents and dogs are well-known vectors for Leptospira species (19,20). Although weaker, evidence of exposure to Leptospira species has also been reported in wolves in Alaska (USA) and the Yukon (21), and among bobcats and lynx in Quebec (22).
Exposure to C burnetii was high among the trappers of Mistissini. Although Waswanipi is geographically close to Mistissini (Figure 1), no antibodies against C burnetii were detected in the Waswanipi population. Therefore, greater exposure of the Mistissini hunters to fauna probably explains the difference. Lévesque et al (17) noted a similar seroprevalence of C burnetii (15%) among both 165 trappers and an equal number of controls in the Quebec City area of southern Quebec, but the latter population was more exposed to domestic and farm animals, known vectors of bacterial infection (18).
The seroprevalences of T gondii were comparable in all communities, ranging from 4% to 12%. These figures are lower than the 59.8% recently reported in the population of Nunavik (23), and are even lower than or in the same range as those documented in several industrialized countries (24,25). Whapmagoostui is located in the same area as the Inuit village of Kuujjuarapik (Figure 1), where seroprevalence was 87% (23), yet antibodies to T gondii were found in only 12% of Whapmagoostui residents. The difference in prevalence estimates between the Nunavik and Cree communities is most likely explained by different dietary and culinary habits. Inuit consume raw meat regularly, which markedly increases their risk of exposure. Felids are known to be definitive host for T gondii. However, domestic or wild felids are rare in northern Quebec, particularly in Nunavik, which raises questions as to transmission mechanisms of the parasite in this region. Simon et al (26) provided evidence for marine environment involvement in the transmission of T gondii.
The seroprevalence of the other parasites targeted in Cree communities was relatively low. Globally, T canis seroprevalence was comparable among all sites; however, there were some differences. The proportion of individuals exposed to T canis was clearly higher in Waskaganish than in Chisasibi and Whapmagoostui. Dogs are the main reservoir of T canis(27–30); hence, the presence of stray village dogs may increase the risk of exposure. Overall, E granulosus and Trichinella species seroprevalences were generally below 5% in the Cree territories of Quebec. Although a recent study found a higher incidence for echinococcosis among individuals living north of the 55th parallel (2.9 per million per year) (31), we could identify only a single published case in the literature among the Cree people in Quebec, from 1955 (32). A seroprevalence of 3% in a sample of hospitalized Cree patients from several communities was reported by Tanner et al (33) during the 1980s, and Messier et al (34) have noted a relatively high seroprevalence (8%) among the Inuit of Nunavik. Antibodies against Trichinella species were not detected in the populations of Waswanipi, Chisasibi, Waskaganish or Mistissini. Only one and two seropositive subjects were identified in Whapmagoostui and Wemindji, respectively. These data indicate infrequent exposure to this parasite among the Cree.
CONCLUSION
The serological data assembled here strongly suggest that a large proportion of the Cree population of Quebec has been exposed to at least one of the targeted zoonotic agents. The Cree, particularly inhabitants heavily exposed to fauna, as well as the medical staff living in these regions, should be aware of these diseases. Greater awareness would help to both decrease exposure and increase the chances of appropriate diagnostic testing.
Acknowledgments
This scientific communication is a report from the Nituuchischaayihtitaau Aschii Multi-Community Environment and Health Longitudinal Study in Iiyiyiu Aschii supported by the Cree people of northern Quebec, the Cree First Nations and the Cree Board of Health and Social Services of James Bay through financial contributions from Niskamoon Corporation.
REFERENCES
- 1.Kuhnlein HV, Receveur O, Soueida R, Egeland GM. Arctic indigenous peoples experience the nutrition transition with changing dietary patterns and obesity. J Nutr. 2004;134:1447–53. doi: 10.1093/jn/134.6.1447. [DOI] [PubMed] [Google Scholar]
- 2.Willows ND. Determinants of healthy eating in Aboriginal peoples in Canada: The current state of knowledge and research gaps. Can J Public Health. 2005;96(Suppl 3):S32–6. S6–41. [PubMed] [Google Scholar]
- 3.WHO . Report of the WHO/FAO/OIE joint consultation on emerging zoonotic diseases in collaboration with the Health Council of the Netherland. May 3 to 5 2004. Geneva, Switzerland, Ref: WHO/CDS/CPE/ZFK/2004.9; 2004. [Google Scholar]
- 4.Campagna S, Levesque B, Anassour-Laouan-Sidi E, et al. Seroprevalence of 10 zoonotic infections in 2 Canadian Cree communities. Diagn Microbiol Infect Dis. 2011;70:191–9. doi: 10.1016/j.diagmicrobio.2011.01.009. [DOI] [PubMed] [Google Scholar]
- 5.Levesque B, Messier V, Bonnier-Viger Y, et al. Seroprevalence of zoonoses in a Cree community (Canada) Diagn Microbiol Infect Dis. 2007;59:283–6. doi: 10.1016/j.diagmicrobio.2007.06.002. [DOI] [PubMed] [Google Scholar]
- 6.Sampasa-Kanyinga H, Levesque B, Anassour-Laouan-Sidi E, et al. Zoonotic infections in native communities of James Bay, Canada. Vector Borne Zoonotic Dis. 2012;12:473–81. doi: 10.1089/vbz.2011.0739. [DOI] [PubMed] [Google Scholar]
- 7.Bonnier-Viger Y, Dewailly E, Egeland GM, Nieboer E, Pereg D. Nituuchischaayihtitaau Aschii Multi-community environment-and-health longitudinal study in Iiyiyiu Aschii: Mistissini, Technical report: Summary of activities, results and recommendations. Niskamoon corporation and Cree Board of Health and Social Services of James Bay 2007. < www.creehealth.org/sites/default/files/Environmental%20Health%20Study-%20Technical%20Report%20of%20Mistissini.pdf> (Accessed July 25, 2012).
- 8.Artsob H. Distribution of California serogroup viruses and virus infections in Canada. In: Calisher CH, Thompson WH, editors. California Serogroup Viruses. New York: Alan R Liss Inc; 1983. pp. 77–290. [PubMed] [Google Scholar]
- 9.Snyder M. Immune response to Francisella. In: Rose NR, Friedman H, editors. Manual of Clinical Immunology. 2nd edn. Washington, DC: American Society for Microbiology; 1980. pp. 479–81. [Google Scholar]
- 10.Stewart S. Tularemia. In: Balows A, Hausler WS Jr, editors. Diagnostic Procedures for Bacterial, Mycotic, and Parasitic Infections. 6th edn. Washington, DC: American Public Health Association; 1981. pp. 705–14. [Google Scholar]
- 11.Martin DA, Muth DA, Brown T, Johnson AJ, Karabatsos N, Roehrig JT. Standardization of immunoglobulin M capture enzyme-linked immunosorbent assays for routine diagnosis of arboviral infections. J Clin Microbiol. 2000;38:1823–6. doi: 10.1128/jcm.38.5.1823-1826.2000. [DOI] [PMC free article] [PubMed] [Google Scholar]
- 12.Calisher CH, Karabatsos N, Dalrymple JM, et al. Antigenic relationships between flaviviruses as determined by cross-neutralization tests with polyclonal antisera. J Gen Virol. 1989;70:37–43. doi: 10.1099/0022-1317-70-1-37. [DOI] [PubMed] [Google Scholar]
- 13.He X, Wu S. Confidence Intervals for the Binomial Proportion with Zero Frequency. PharmaSUG. 2009. < www.pharmasug.org/download/papers/SP10.pdf> (Accessed August 2, 2012).
- 14.Carlin R. Notifiable Disease (MADO) Report for 1990 to 2006 for the Cree Territory of James Bay (Eeyou Istchee) Cree Board of Health and Social Services of James Bay. 2007 [Google Scholar]
- 15.Walters LL, Tirrell SJ, Shope RE. Seroepidemiology of California and Bunyamwera serogroup (Bunyaviridae) virus infections in native populations of Alaska. Am J Trop Med Hyg. 1999;60:806–21. doi: 10.4269/ajtmh.1999.60.806. [DOI] [PubMed] [Google Scholar]
- 16.Grimstad PR, Calisher CH, Harroff RN, Wentworth BB. Jamestown Canyon virus (California serogroup) is the etiologic agent of widespread infection in Michigan humans. Am J Trop Med Hyg. 1986;35:376–86. doi: 10.4269/ajtmh.1986.35.376. [DOI] [PubMed] [Google Scholar]
- 17.Martin T, Holmes IH, Wobeser GA, Anthony RF, Greefkes I. Tularemia in Canada with a focus on Saskatchewan. Can Med Assoc J. 1982;127:279–82. [PMC free article] [PubMed] [Google Scholar]
- 18.Levesque B, De Serres G, Higgins R, et al. Seroepidemiologic study of three zoonoses (leptospirosis, Q fever, and tularemia) among trappers in Quebec, Canada. Clin Diagn Lab Immunol. 1995;2:496–8. doi: 10.1128/cdli.2.4.496-498.1995. [DOI] [PMC free article] [PubMed] [Google Scholar]
- 19.Prescott JF, McEwen B, Taylor J, Woods JP, Abrams-Ogg A, Wilcock B. Resurgence of leptospirosis in dogs in Ontario: Recent findings. Can Vet J. 2002;43:955–61. [PMC free article] [PubMed] [Google Scholar]
- 20.Brown K, Prescott J. Leptospirosis in the family dog: A public health perspective. CMAJ. 2008;178:399–401. doi: 10.1503/cmaj.071097. [DOI] [PMC free article] [PubMed] [Google Scholar]
- 21.Zarnke RL, Ver Hoef JM, DeLong RA. Serologic survey for selected disease agents in wolves (Canis lupus) from Alaska and the Yukon Territory, 1984–2000. J Wildl Dis. 2004;40:632–8. doi: 10.7589/0090-3558-40.4.632. [DOI] [PubMed] [Google Scholar]
- 22.Labelle P, Mikaelian I, Martineau D, et al. Seroprevalence of leptospirosis in lynx and bobcats from Quebec. Can Vet J. 2000;41:319–20. [PMC free article] [PubMed] [Google Scholar]
- 23.Messier V, Levesque B, Proulx JF, et al. Seroprevalence of Toxoplasma gondii among Nunavik Inuit (Canada) Zoonoses Public Health. 2009;56:188–97. doi: 10.1111/j.1863-2378.2008.01177.x. [DOI] [PubMed] [Google Scholar]
- 24.Tenter AM, Heckeroth AR, Weiss LM. Toxoplasma gondii: From animals to humans. Int J Parasitol. 2000;30:1217–58. doi: 10.1016/s0020-7519(00)00124-7. [DOI] [PMC free article] [PubMed] [Google Scholar]
- 25.Nash JQ, Chissel S, Jones J, Warburton F, Verlander NQ. Risk factors for toxoplasmosis in pregnant women in Kent, United Kingdom. Epidemiol Infect. 2005;133:475–83. doi: 10.1017/s0950268804003620. [DOI] [PMC free article] [PubMed] [Google Scholar]
- 26.Simon A, Chambellant M, Ward BJ, et al. Spatio-temporal variations and age effect on Toxoplasma gondii seroprevalence in seals from the Canadian Arctic. Parasitology. 2011;138:1362–8. doi: 10.1017/S0031182011001260. [DOI] [PubMed] [Google Scholar]
- 27.Mandarino-Pereira A, de Souza FS, Lopes CW, Pereira MJ. Prevalence of parasites in soil and dog feces according to diagnostic tests. Vet Parasitol. 2010;170:176–81. doi: 10.1016/j.vetpar.2010.02.007. [DOI] [PubMed] [Google Scholar]
- 28.Glickman LT, Schantz PM. Epidemiology and pathogenesis of zoonotic toxocariasis. Epidemiol Rev. 1981;3:230–50. doi: 10.1093/oxfordjournals.epirev.a036235. [DOI] [PubMed] [Google Scholar]
- 29.Barriga OO. A critical look at the importance, prevalence and control of toxocariasis and the possibilities of immunological control. Vet Parasitol. 1988;29:195–234. doi: 10.1016/0304-4017(88)90126-4. [DOI] [PubMed] [Google Scholar]
- 30.Wolfe A, Wright IP. Human toxocariasis and direct contact with dogs. Vet Rec. 2003;152:419–22. doi: 10.1136/vr.152.14.419. [DOI] [PubMed] [Google Scholar]
- 31.Gilbert NL, Dare OK, Libman MD, Muchaal PK, Ogden NH. Hospitalization for trichinellosis and echinococcosis in Canada, 2001–2005: The tip of the iceberg? Can J Public Health. 2010;101:337–40. doi: 10.1007/BF03405298. [DOI] [PMC free article] [PubMed] [Google Scholar]
- 32.Begin BG, Guy R, Raymond O. [Hydatid cyst of the lung in the province of Quebec; two autochthonous cases.] Union Med Can. 1956;85:664–71. [PubMed] [Google Scholar]
- 33.Tanner CE, Staudt M, Adamowski R, Lussier M, Bertrand S, Prichard RK. Seroepidemiological study for five different zoonotic parasites in northern Quebec. Can J Public Health. 1987;78:262–6. [PubMed] [Google Scholar]
- 34.Messier V, Lévesque B, Proulx J-F, et al. Zoonotic diseases, drinking water and gastroenteritis in Nunavik: A brief portrait. Nunavik Regional Board of Health and Social Services. 2007 [Google Scholar]