

Abstract
For some species, climate change has altered environmental conditions away from those in which life-history strategies evolved. In such cases, if adaptation does not keep pace with these changes, existing life-history strategies may become maladaptive and lead to population declines. We use life-history theory, with a specific emphasis on breeding strategies, in the context of the trophic match–mismatch framework to form generalizable hypotheses about population-level consumer responses to climate-driven perturbations in resource availability. We first characterize the income and breeding traits of sympatric caribou and muskoxen populations in western Greenland, and then test trait-based hypotheses about the expected reproductive performance of each population during a period of high resource variability at that site. The immediate reproductive performance of income breeding caribou decreased with trophic mismatch. In contrast, capital breeding muskoxen were relatively unaffected by current breeding season resource variability, but their reproductive performance was sensitive to resource conditions from previous years. These responses matched our expectations about how capital and income breeding strategies should influence population susceptibility to phenological mismatch. We argue for a taxon-independent assessment of trophic mismatch vulnerability based on a life-history strategy perspective in the context of prevailing environmental conditions.
Keywords: trophic mismatch, life-history theory, climate change, capital–income breeding, Ovibos moschatus, Rangifer tarandus
1. Introduction
Rapid climate change has increased the global frequency of extreme weather [1–3], driven uneven shifts in the phenology of coexisting taxa [4–6], and altered the relationship between physical cues and ecological processes [7–9]. The trophic mismatch concept (reviewed in [10–12]) examines the population-level consequences of climate-driven phenological asynchrony between consumer resource requirements and the availability of these resources during the consumer's breeding period. Trophic mismatch affects diverse taxa in numerous environments [13–19], but demonstrating generality in patterns among species or populations has proved elusive [8,12]. Here, we employ a case study based on a long-term dataset to integrate concepts from life-history theory, focusing specifically on life-history traits that form the basis of breeding strategies, with the trophic match–mismatch framework. We promote simplified, generalizable and testable hypotheses about consumer population-level responses to climate-driven perturbations of resource environments.
(a). Breeding strategies and match–mismatch
Reproduction is constrained by fundamental trade-offs linked with resource acquisition and subsequent allocation to offspring production and provisioning [20]. Capital- and income-breeding strategies mark endpoints of a continuum of solutions to these trade-offs that are distinguished by the degree to which an organism relies on stored energy to finance reproductive costs [21,22]. A capital breeder primarily invests in offspring production from its own resource reserves, which are acquired prior to reproduction. By contrast, an income breeder relies on financing its reproductive costs from resources acquired from the environment during the breeding period [21,22]. Purely capital- or income-breeding birds and mammals are uncommon [23], but interpretation of life-history traits, particularly those associated with breeding, allow for a priori classification of individuals as more representative of one strategy than the other [21,22].
As climate change continues to affect the predictability of seasonal resource pulses relative to consumer breeding phenology, consumer demographic responses [10,12] may vary according to their breeding strategy [22]. For example, we predict that the reproductive performance of an income breeder will exhibit an immediate positive response to an increasing trophic match, but an immediate negative response to an increasing trophic mismatch. In contrast, while capital breeder reproductive performance may respond to increasing trophic match, it should be relatively insensitive to increasing mismatch in the year of offspring production. This is because capital breeders finance a critical portion of their reproductive costs with energetic capital accrued prior to costly breeding phases, and as a result their reproductive performance during a given breeding period is comparatively less dependent on phenological synchrony with environmental resource availability (figure 1). Ultimately, however, changes in resource dynamics at any point in the year may affect capital acquisition and capital storage costs that can have a cascading impact on future reproductive performance.
Figure 1.

Match–mismatch framework adjusted by reproductive strategy. The match–mismatch framework depicted above was modified to display the difference in exogenous (i.e. environmental) resource acquisition requirements of capital and income breeders during their breeding period. Endogenous (i.e. stored energetic capital) reproductive resource stores and costs are not pictured. Match and mismatch scenarios for income and capital breeders alternate by panel. (a) A temporal match between the peak environmental resource needs of income breeders with environmental resource availability/quality. It also depicts a temporal ‘mismatch’ between the peak environmental resource needs of capital breeders and available environmental resources. These scenarios are reversed in (b). Note the contrasts in energetic mismatch (non-overlapping areas) between capital breeders and environmental resources ((a), minimal) and income breeders and environmental resources ((b), extensive). (Online version in colour.)
(b). Case study: large herbivores in the Arctic
Rapid warming has already strongly affected plant phenology in the Arctic [24–26] and, by extension, Arctic herbivores [18,19,25,27]. Muskoxen (Ovibos moschatus) and caribou (Rangifer tarandus) are the only large herbivore species that are resident in and breed in Arctic tundra environments, yet they have markedly contrasting life-history traits and reproductive strategies that place them on opposing sides of the capital–income breeder continuum [28,29]. Using a literature review, we classify West Greenland caribou as income breeders and muskoxen generally as capital breeders on the basis of differences in their life-history traits (sensu [22]) drawing specific focus to differences in calving phenology, body composition and size, metabolic rate, factors that influence conception and general patterns of productivity (table 1). In this case study, we use this classification system and a long-term dataset from ongoing research in low-Arctic West Greenland [40] to explore our general predictions about capital- and income-breeder responses to environmental perturbations. Specifically, we focus on the reproductive performance of sympatric caribou and muskox populations during a period of sustained warming. As income breeders, caribou should display immediate negative consequences of trophic mismatch during and shortly following their breeding season, whereas muskox reproductive performance should be little impacted by the timing of resource availability in the year of offspring production.
Table 1.
A summary of the trait and other local-population characteristics identified in the literature review that informed our a priori classification of West Greenland caribou and muskoxen as income and capital breeders, respectively.
| trait | West Greenland caribou/muskoxen population characteristic | reference(s) |
|---|---|---|
| calving phenology | caribou: synchronized with resource phenology | [30,31] |
| muskoxen: several weeks prior to resource availability | ||
| infant mortality | more variable in caribou than muskoxen | [28] |
| lactation phenology | caribou: peak lactation one week post-calvingmuskoxen: begins two to three weeks before vegetation emergence | [32,33] |
| age at first reproduction | variable, but caribou generally earlier (require less capital reserve) | [34,35] |
| body fat's influence on conception probability | muskoxen: more sensitive to body condition caribou: more sensitive to recent nutrition | [28,36–38] |
| range usage | caribou: integrate resource uncertainty through space via migration/high-mobility muskoxen: integrate uncertainty in resource quality through time by residency, prolonged browsing | [18,28,39] |
| metabolism and gut retention time | muskoxen: low metabolic rate, slow but highly efficient extraction of resources from forage | [28,32,39] |
| caribou: faster metabolic rate, rapid but comparatively less efficient gut processing |
2. Material and methods
(a). Phenology and herbivore productivity data
Near-daily records of plant community emergence and herbivore calving progression were collected between May and June for 11 years (1993, 2002–2011) at a long-term research site situated near a shared caribou and muskox calving ground in low-Arctic West Greenland (67.11° N, 50.34° W) [40]. Calf production was recorded annually for both caribou and muskoxen several weeks after the conclusion of their respective calving seasons, and thus after the critical period of early calf mortality had passed [41]. All observational and analytical methods quantifying phenological data are consistent with previous reports from this site [19] as is our method for calculating caribou calf production [18,19,30,42,43].
Annual muskox calf production, similar to that of caribou, is reported as the post-calving ratio of calves to total individuals observed in the roughly 20 km2 calving area. The large post-calving herd(s) of caribou makes a comprehensive calf census possible on a single day in late June, but because resident muskoxen are dispersed in small family groups throughout the post-calving season, we used the annual maximum single day ratio of calf to total individuals from ad libitum censuses of the study area repeated throughout June.
(b). Quantifying the phenology of trophic interactions (match–mismatch)
The phenology of caribou calving is tightly coupled with vegetation phenology [30,44]. The annual extent of synchrony between caribou calving and vegetation emergence constitutes the trophic mismatch index [19]. This index is quantified as the proportion of plant species emergent in the community, averaged across twelve 0.5 m2 long-term monitoring plots that are spread across three sites separated by several hundred metres encompassing differing microclimates [19], on the date of 50 per cent caribou births [42,45]. Said another way, this index quantifies the resource state at the midpoint of the annual season of caribou parturition. Annual estimates of trophic mismatch therefore vary between zero and unity, with higher values indicating increasingly earlier vegetation emergence with respect to the peak of the caribou calving season and thus increasing mismatch [19].
Unlike caribou, muskoxen calve four to eight weeks prior to the plant growing season throughout their circumarctic range [31,46,47]. At the study site, muskox calving occurs before our initiation of fieldwork each year. To quantify trophic mismatch for muskoxen, we used a conservative estimate of the end date of the focal population's calving period [34] and calculated the difference between this and the observed annual date of 50 per cent plant species emergent for each year. This metric quantifies the duration of the window between the latest possible onset of lactation (i.e. parturition) and the midpoint of the vegetation emergence season, a date when offspring provisioning costs can first be reliably sourced from the environment rather than solely from endogenous stores. This index therefore only reflects interannual variation in vegetation emergence, with larger numbers indicating a longer delay between the estimated end of the calving period and the observed timing of environmental resource availability in a given year. There is little published information available about the patterns and drivers of interannual variation in the timing of muskox calving, so at present, we are unable to factor this potential bias into our analyses.
(c). Relating trophic asynchrony to herbivore demographic response
To link herbivore calf production to the degree of phenological asynchrony (mismatch) between herbivore calving and vegetation emergence, we conducted multiple- and simple-linear regression in the R statistical computing environment [48] incorporating mismatch terms in current and previous years for each herbivore population. Previous studies have documented the critical relevance of density dependence in both Rangifer [36,49–51] and muskoxen [50,52,53] population dynamics, so current and 1-year lagged calving season abundances were included as covariates during model construction. Seasonal herbivore abundance was calculated as the maximum number of individuals of each species seen on a single day at the study site throughout May–June. There are no apex predators in this system, and regulated hunting is restricted to the late summer and winter seasons; therefore, no top-down factors were included in our models. Furthermore, we examined each time series for temporal trends and repeated our analyses with detrended data when necessary to isolate potential drivers of interannual variation in calf productivity from those primarily related to trends.
3. Results
(a). Variation in vegetation and herbivore phenology
Over the 11-year study period, the date of 50 per cent plant species emergence ranged over a 19-day window with a mean date of June 1 (day of year 151.8 ± 6.4; figure 2a). In contrast, the midpoint of the caribou calving season showed little interannual variation around its mean of 6 June (day of year 156.8 ± 1.9) spanning a range of just 7 days over the same period (figure 2a). Among all years, the latest recorded date of 50 per cent plant species emergence was 1 day earlier than the latest recorded date of 50 per cent caribou births, but the earliest date of 50 per cent plant emergence occurred 13.5 days before the earliest recorded date of 50 per cent caribou births. The largest difference in a single season between the midpoint of vegetation emergence and midpoint of caribou births was 18 days. There was no correlation between the annual timing of vegetation emergence and caribou calving (Pearson's r = 0.23, p = 0.50; figure 2b). The midpoint of the local muskox calving season occurs in late April [31,54], prior to the onset of our field season and approximately six weeks before peak green-up (figure 2a). We therefore provide only a depiction of the duration of the muskox calving season (figure 2a) and an estimate of 13 May (day of year 133) as a conservative end-of-calving date on the basis of a literature review [31,34,46,54,55] to provide comparative trophic context to the calving phenology of each herbivore population.
Figure 2.
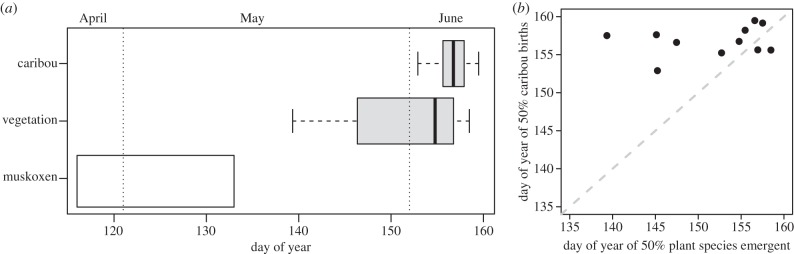
Variation in herbivore calving and vegetation phenology. (a) ‘Caribou’ and ‘vegetation’ show the range, quartiles and median of the date of 50% caribou calf births and date of 50% plant species emergence, respectively, from the years 1993, 2002–2011. ‘Muskoxen’ is a depiction of the approximate calving period of muskoxen at this site. A conservative end date of muskox calving was selected of May 13 (day of year 133). Vertical dotted lines signify the first day of May and June (non-leap years). (b) A 1 : 1 graph of caribou calving phenology versus vegetation phenology. If caribou calving phenology consistently tracked vegetation phenology these points would fall on the 1 : 1 line.
(b). Calf production
Caribou were marginally more productive than muskoxen (two-tailed Welch's two sample t-test, t = −1.621, d.f. = 14.34, p = 0.13) but exhibited greater interannual variability in calf production (one-tailed F-test: F = 3.04; d.f. = 9,9; p = 0.06; figure 3) and a higher maximum productivity (0.42 versus 0.30 calves/total individuals) across all years that both species were monitored. Muskox calf production increased significantly over this time (β1 = 0.02 ± 0.005, R2 = 0.61, p = 0.007), while caribou displayed a declining but non-significant trend in caribou calf production (β1 = −0.02 ± 0.014, R2 = 0.15, p = 0.28).
Figure 3.
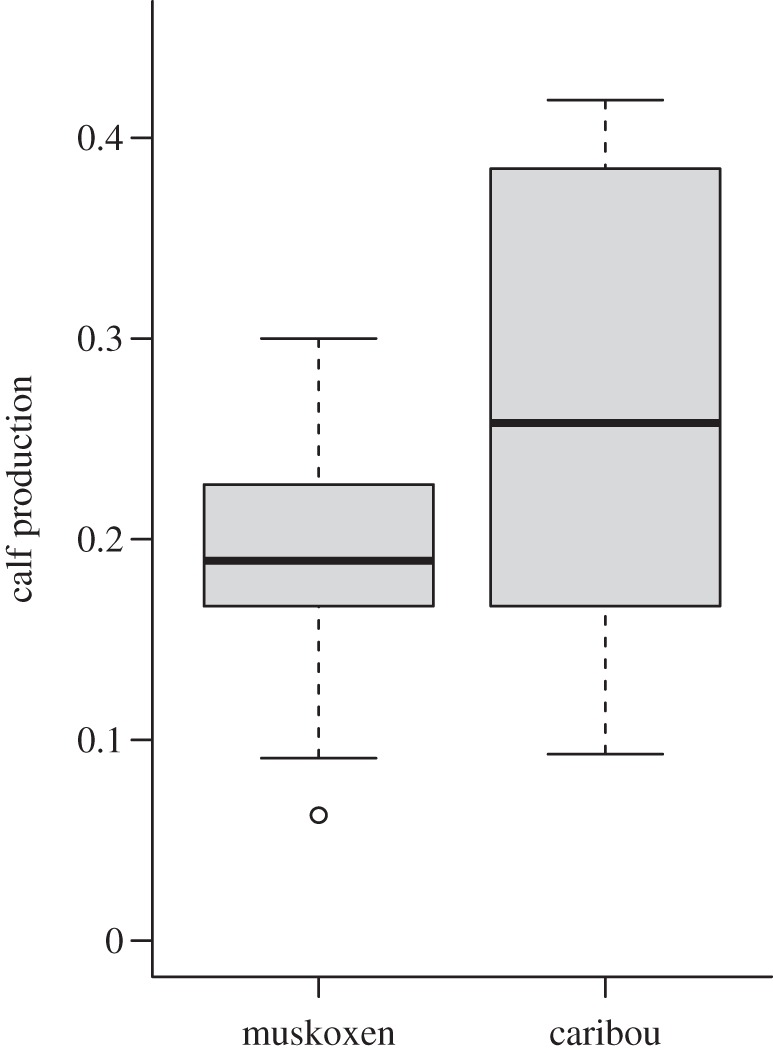
Variation in calf production for muskoxen and caribou in the Kangerlussuaq population from 2002 to 2011 (years with observations for both species). Boxplots depict the range, quartiles and median of calf production in each population.
(c). Relating magnitude of trophic mismatch to herbivore productivity
Caribou calf production was significantly negatively related to trophic mismatch in a given year (β1 = −0.55 ± 0.15, R2 = 0.60, p = 0.005), but not with that of the previous year (β1 = 0.33 ± 0.22, R2 = 0.24, p = 0.18). This contrasted with observed patterns of muskox calf production, which related negatively to the timing of vegetation emergence in the previous year (β1 = −0.0064 ± 0.0029, R2 = 0.41, p = 0.06), but displayed no relationship with vegetation emergence in the current year (β1 = −0.0037 ± 0.0037, R2 = 0.11, p = 0.34). The overall sign, magnitude and significance of these relationships persisted even after accounting for herbivore abundance (figure 4), a factor that, surprisingly, did not contribute to better model fits (see the electronic supplementary material, appendix A). Significant temporal trends existed in muskox calf production (p = 0.007) and trophic mismatch (p = 0.02), while caribou trophic mismatch displayed only a marginal trend (p = 0.08; electronic supplementary material, appendix B); only caribou calf production was significantly related to a detrended mismatch index (p = 0.003; electronic supplementary material, appendix C).
Figure 4.

Relating trophic mismatch and population abundance to calf production. Each panel shows the relationship between herbivore production and the population specific index of trophic mismatch in immediate (a,c) or previous (b,d) years after accounting for the effect of population abundance in the immediate year. Panels showing lagged effects of trophic mismatch contain two fewer data points (no 1993, 2002) due to analytical requirements for including the lagged effect. Subsetting the non-lagged panels to the same data series resulted in nearly identical relationships to those depicted here (see the electronic supplementary material, appendix A). Lines represent significant partial regression fits. (a,b) Show that caribou calf production is closely related to immediate mismatch conditions, whereas (c,d) demonstrate that muskoxen are more sensitive to the lagged consequences of mismatch. (Online version in colour.)
4. Discussion
As income breeders, caribou lose proportionally less forage energy to capital conversion and storage costs but experience more volatility in reproductive performance among years than muskoxen (figure 3). Iteroparous income breeders may hedge the risk of energetic shortfall even in highly variable resource environments if they express plasticity in parturition phenology capable of tracking resource variability [21,22], or if resource uncertainty varies about a long-term mean. Under the latter scenario, multiple reproductive opportunities may buffer intermittent reproductive failures in some years with strong reproductive performance in others. Neither situation exists in southwest Greenland, however, where a strong trend towards advancement of the timing of peak resource availability [26] may render income breeding for caribou maladaptive if calving phenology does not adjust to the consistently earlier timing of vegetation emergence. Indeed, recent evidence suggests that Rangifer lack the molecular clockwork that drives circadian rhythms in other mammals, and as a result calving phenology in this species may be constrained directly by photic cues [56]. This implies that caribou lack sufficient phenotypic plasticity in their ability to track long-term directional shifts in vegetation phenology (as in figure 2b), and that reducing trophic mismatch can therefore only be achieved via cross-generational selection.
For muskoxen in this population, the absence of an immediate effect of vegetation emergence on recruitment is consistent with our expectation for a capital breeder. The presence of a 1-year lagged effect of resource phenology not associated with density-dependent factors (figure 4d) can also be interpreted in the context of capital breeding. In contrast to caribou, muskoxen store a greater proportion of their total body mass as fat and will avoid conception when fat to body mass ratios drop below approximately 20 per cent, a threshold roughly two to four times higher than conception-inhibiting leanness in caribou [28,37]. As a result, extreme resource variability more commonly contributes to breeding pauses in muskoxen [34,57], whereas caribou reproductive performance is more strongly influenced by calf mortality [58–60].
In contrast to their North American conspecifics, the calving period of Palaearctic reindeer (also Rangifer tarandus) typically occurs several weeks prior to the onset of the spring resource pulse [51,61], a life-history trait associated with capital breeding [22]. Consistent with this classification, the reproductive performance of 19 semi-domestic reindeer populations in Norway increased as the result of widespread trophic match in years with earlier vegetation emergence [51]. Svalbard reindeer on the high-Arctic island of Spitsbergen exhibit capital breeding traits comparable with those of muskoxen [47,61]. Like muskoxen in southwestern Greenland, Svalbard reindeer fecundity increased during a multi-year warming period characterized by more favourable but less predictable environmental conditions outside of their breeding period [62].
Capital breeding marmot populations in the Rocky Mountains (Marmota flaviventris) and French Alps (Marmota marmota) provide further examples of life-history trait-driven population response to resource variability. Both of these closely related (phylogenetically) populations are emerging from hibernation earlier in response to shifting environmental conditions, and as a result, are experiencing longer growing seasons [63–65]. Marmots in the Rocky Mountains have capitalized on this longer growing season with increased seasonal capital accrual that has resulted in larger litter sizes [64]. In contrast, the positive effect of the longer growing season has been offset by higher capital storage costs associated with changing environmental conditions and a higher temperature-dependent metabolic rate in the French Alps marmot population, ultimately resulting in smaller litters there [65].
Changing trophic interactions, rather than the direct effects of weather on energy balance, are perhaps the best-documented proximate causes of climate-linked population declines and local extinctions [66]. The match–mismatch framework has traditionally formed the conceptual basis for describing climate-driven changes in trophic interactions [10,11], but few cross-species or -population comparative match–mismatch studies have been undertaken (but see [67]). Rather than focusing on species-level vulnerabilities, however, we argue for a taxon-independent assessment of trophic mismatch vulnerability based on a life-history strategy perspective in the context of prevailing environmental conditions.
Acknowledgement
We thank Nicholas Tyler and two reviewers for their helpful suggestions during the preparation of this manuscript.
Funding statement
This research was supported by a U.S. National Science Foundation (NSF) Graduate Research Fellowship to J.K., and by grants from NSF and the National Geographic Society Committee for Research and Exploration to E.P.
References
- 1.Pall P, Aina T, Stone DA, Stott PA, Nozawa T, Hilberts AG, Lohmann D, Allen MR. 2011. Anthropogenic greenhouse gas contribution to flood risk in England and Wales in autumn 2000. Nature 470, 382–386 (doi:10.1038/nature09762) [DOI] [PubMed] [Google Scholar]
- 2.Min S-K, Zhang X, Zwiers FW, Hegerl GC. 2011. Human contribution to more-intense precipitation extremes. Nature 470, 378–381 (doi:10.1038/nature09763) [DOI] [PubMed] [Google Scholar]
- 3.Francis JA, Vavrus SJ. 2012. Evidence linking Arctic amplification to extreme weather in mid-latitudes. Geophys. Res. Lett. 39 (doi:10.1029/2012GL051000) [Google Scholar]
- 4.Thackeray SJ, et al. 2010. Trophic level asynchrony in rates of phenological change for marine, freshwater and terrestrial environments. Glob. Change Biol. 16, 3304–3313 (doi:10.1111/j.1365-2486.2010.02165.x) [Google Scholar]
- 5.Root TL, Price JT, Hall KR, Schneider SH, Rosenzweig C, Pounds JA. 2003. Fingerprints of global warming on wild animals and plants. Nature 421, 57–60 (doi:10.1038/nature01333) [DOI] [PubMed] [Google Scholar]
- 6.Parmesan C, Yohe G. 2003. A globally coherent fingerprint of climate change impacts across natural systems. Nature 421, 37–42 (doi:10.1038/nature01286) [DOI] [PubMed] [Google Scholar]
- 7.Visser ME, Both C, Lambrechts MM. 2004. Global climate change leads to mistimed avian reproduction. In Birds and climate change, pp. 89–110 London, UK: Academic Press [Google Scholar]
- 8.Visser ME. 2010. Keeping up with a warming world; assessing the rate of adaptation to climate change. Proc. R. Soc. B 275, 649–659 (doi:10.1098/rspb.2007.0997) [DOI] [PMC free article] [PubMed] [Google Scholar]
- 9.Both C, Van Turnhout CAM, Bijlsma RG, Siepel H, Van Strien AJ, Foppen RPB. 2010. Avian population consequences of climate change are most severe for long-distance migrants in seasonal habitats. Proc. R. Soc. B 277, 1259–1266 (doi:10.1098/rspb.2009.1525) [DOI] [PMC free article] [PubMed] [Google Scholar]
- 10.Kerby JT, Wilmers CC, Post E. 2012. Climate change, phenology, and the nature of consumer–resource interactions: advancing the match/mismatch hypothesis. In Trait-mediated indirect interactions: ecological and evolutionary perspectives (eds Ohgushi T, Schmitz OJ, Holt RD.), pp. 508–525 Cambridge, UK: Cambridge University Press [Google Scholar]
- 11.Durant JM, Hjermann DO, Ottersen G, Stenseth NC. 2007. Climate and the match or mismatch between predator requirements and resource availability. Clim. Res. 33, 271–283 (doi:10.3354/cr033271) [Google Scholar]
- 12.Miller-Rushing AJ, Hoye TT, Inouye DW, Post E. 2010. The effects of phenological mismatches on demography. Phil. Trans. R. Soc. B 365, 3177–3186 (doi:10.1098/rstb.2010.0148) [DOI] [PMC free article] [PubMed] [Google Scholar]
- 13.Visser ME, van Noordwijk AJ, Tinbergen JM, Lessells CM. 1998. Warmer springs lead to mistimed reproduction in great tits (Parus major). Proc. R. Soc. Lond. B 265, 1867–1870 (doi:10.1098/rspb.1998.0514) [Google Scholar]
- 14.Visser ME, Holleman LJM. 2001. Warmer springs disrupt the synchrony of oak and winter moth phenology. Proc. R. Soc. Lond. B 268, 1–6 (doi:10.1098/rspb.2000.1322) [DOI] [PMC free article] [PubMed] [Google Scholar]
- 15.Winder M, Schindler DE. 2004. Climate change uncouples trophic interactions in an aquatic ecosystem. Ecology 85, 2100–2106 (doi:10.1890/04-0151) [Google Scholar]
- 16.Edwards M, Richardson AJ. 2004. Impact of climate change on marine pelagic phenology and trophic mismatch. Nature 430, 881–884 (doi:10.1038/nature02808) [DOI] [PubMed] [Google Scholar]
- 17.Durant JM, Hjermann DO, Anker-Nilssen T, Beaugrand G, Mysterud A, Pettorelli N, Stenseth NC. 2005. Timing and abundance as key mechanisms affecting trophic interactions in variable environments. Ecol. Lett. 8, 952–958 (doi:10.1111/j.1461-0248.2005.00798.x) [DOI] [PubMed] [Google Scholar]
- 18.Post E, Pedersen C, Wilmers CC, Forchhammer MC. 2008. Warming, plant phenology and the spatial dimension of trophic mismatch for large herbivores. Proc. R. Soc. B 275, 2005–2013 (doi:10.1098/rspb.2008.0463) [DOI] [PMC free article] [PubMed] [Google Scholar]
- 19.Post E, Forchhammer MC. 2008. Climate change reduces reproductive success of an Arctic herbivore through trophic mismatch. Phil. Trans. R. Soc. B 363, 2369–2375 (doi:10.1098/rstb.2007.2207) [DOI] [PMC free article] [PubMed] [Google Scholar]
- 20.Stearns SC. 1989. Trade-offs in life-history evolution. Funct. Ecol. 3, 259–268 (doi:10.2307/2389364) [Google Scholar]
- 21.Jönsson KI. 1997. Capital and income breeding as alternative tactics of resource use in reproduction. Oikos 78, 57–66 (doi:10.2307/3545800) [Google Scholar]
- 22.Stephens PA, Boyd IL, McNamara JM, Houston AI. 2009. Capital breeding and income breeding: their meaning, measurement, and worth. Ecology 90, 2057–2067 (doi:10.1890/08-1369.1) [DOI] [PubMed] [Google Scholar]
- 23.Sénéchal É, Bêty J, Gilchrist HG, Hobson KA, Jamieson SE. 2011. Do purely capital layers exist among flying birds? Evidence of exogenous contribution to Arctic-nesting common eider eggs. Oecologia 165, 593–604 (doi:10.1007/s00442-010-1853-4) [DOI] [PubMed] [Google Scholar]
- 24.Høye TT, Post E, Meltofte H, Schmidt NM, Forchhammer MC. 2007. Rapid advancement of spring in the high Arctic. Curr. Biol. 17, R449–R451 (doi:10.1016/j.cub.2007.04.047) [DOI] [PubMed] [Google Scholar]
- 25.Post E, et al. 2009. Ecological dynamics across the Arctic associated with recent climate change. Science 325, 1355 (doi:10.1126/science.1173113) [DOI] [PubMed] [Google Scholar]
- 26.Kerby J, Post E. Submitted Advancing plant phenology and reduced herbivore production in a terrestrial system associated with sea ice decline. Nat. Commun. [DOI] [PubMed] [Google Scholar]
- 27.Walther G-R, Post E, Convey P, Menzel A, Pamesan C, Beebee TJC, Fromentin J-M, Guldberg OH, Bairlein F. 2002. Ecological responses to recent climate change. Nature 416, 389–395 (doi:10.1038/416389a) [DOI] [PubMed] [Google Scholar]
- 28.Adamczewski JZ, Fargey PJ, Laarveld B, Gunn A, Flood PF. 1998. The influence of fatness on the likelihood of early-winter pregnancy in muskoxen (Ovibos moschatus). Theriogenology 50, 605–614 (doi:10.1016/S0093-691X(98)00165-4) [DOI] [PubMed] [Google Scholar]
- 29.Gustine DD, Barboza PS, Lawler JP. 2010. Dynamics of body protein and the implications for reproduction in captive muskoxen (Ovibos moschatus) during winter. Physiol. Biochem. Zool. 83, 687–697 (doi:10.1086/652729) [DOI] [PubMed] [Google Scholar]
- 30.Post E, Boving P-S, Pedersen C, MacArthur MA. 2003. Synchrony between caribou calving and plant phenology in depredated and non-predated populations. Can. J. Zool. 81, 1709–1714 (doi:10.1139/z03-172) [Google Scholar]
- 31.Flood PF, Tedesco SC. 1995. Relationship between conception date and latitude in muskoxen. Rangifer 17, 25–30 [Google Scholar]
- 32.Parker KL, White RG, Gillingham MP, Holleman DF. 1990. Comparison of energy metabolism in relation to daily activity and milk consumption by caribou and muskox neonates. Can. J. Zool. 68, 106–114 (doi:10.1139/z90-015) [Google Scholar]
- 33.White RG, Holleman DF, Tiplady BA. 1989. Seasonal body weight, body condition, and lactational trends in muskoxen. Can. J. Zool. 67, 1125–1133 (doi:10.1139/z89-162) [Google Scholar]
- 34.Olesen CR, Thing H, Aastrup P. 1994. Growth of wild muskoxen under two nutritional regimes in Greenland. Rangifer 1, 3–10 [Google Scholar]
- 35.Thing H. 1984. Feeding ecology of the West Greenland caribou (Rangifer tarandus) in the Sisimiut-Kangerlussuaq region. Dan. Rev. Game Biol. 12, 1–53 [Google Scholar]
- 36.Skogland T. 1984. Wild reindeer foraging-niche organization. Holarctic Ecol. 7, 345–379 [Google Scholar]
- 37.White RG, Rowell JE, Hauer WE. 1997. The role of nutrition, body condition, and lactation on calving success in muskoxen. J. Zool. 243, 13–20 (doi:10.1111/j.1469-7998.1997.tb05752.x) [Google Scholar]
- 38.Ronnegard L, Forslund P, Danell O. 2002. Lifetime patterns in adult female mass, reproduction, and offspring mass in semidomestic reindeer (Rangifer tarandus tarandus). Can. J. Zool. 80, 2047–2055 (doi:10.1139/z02-192) [Google Scholar]
- 39.Klein DR. 1992. Comparative ecological and behavioral adaptations of Ovibos moschatus and Rangifer tarandus. Rangifer 12, 47–55 (doi:10.7557/2.12.2.1016) [Google Scholar]
- 40.Post E. 2013. Ecology of climate change: the importance of biotic interactions. Princeton, NJ: Princeton University Press [Google Scholar]
- 41.Thing H. 1982. Structure and annual increase in a population of West Greenland caribou (Rangifer tarandus). Rangifer 2, 28–35 (doi:10.7557/2.2.2.410) [Google Scholar]
- 42.Caughley G. 1977. Analysis of vertebrate populations. London, UK: John Wiley & Sons [Google Scholar]
- 43.Post E, Klein DR. 1999. Caribou calf production and seasonal range quality during a population decline. J. Wildl. Manag. 63, 335–345 (doi:10.2307/3802517) [Google Scholar]
- 44.Skogland T. 1989. Comparative social organization of wild reindeer in relation to food, mates, and predator avoidance. Adv. Ethol. 29, 1–71 [Google Scholar]
- 45.Caughley G, Caughley J. 1974. Estimating median date of birth. J. Wildl. Manag. 38, 552–556 (doi:10.2307/3800889) [Google Scholar]
- 46.Latour PB. 1986. Observations on demography, reproduction, and morphology of muskoxen (Ovibos moschatus) on Banks Island, Northwest Territories. Can. J. Zool. 65, 265–269 (doi:10.1139/z87-041) [Google Scholar]
- 47.Adamczewski JZ, Flood PF, Gunn A. 1997. Seasonal patterns in body composition and reproduction of female muskoxen (Ovibos moschatus). J. Zool. 241, 245–269 (doi:10.1111/j.1469-7998.1997.tb01956.x) [Google Scholar]
- 48.R core development team 2012. R: a language and environment for statistical computing. Vienna, Austria: R Foundation for Statistical Computing [Google Scholar]
- 49.Ouellet JP, Douglas DC, Boutin S, Mulders R. 1997. A comparison of body condition and reproduction of caribou on two predator-free Arctic islands. Can. J. Zool. 75, 11–17 (doi:10.1139/z97-002) [Google Scholar]
- 50.Post E, Stenseth NC. 1999. Climatic variability, plant phenology, and northern ungulates. Ecology 80, 1322–1339 (doi:10.1890/0012-9658(1999)080[1322:CVPPAN]2.0.CO;2) [Google Scholar]
- 51.Tveraa T, Stien A, Bardsen B-J, Fauchald P. 2013. Population densities, vegetation green-up, and plant productivity: impacts on reproductive success and juvenile body mass in reindeer. PLoS ONE 8, 1–8 (doi:10.1371/journal.pone.0056450) [DOI] [PMC free article] [PubMed] [Google Scholar]
- 52.Forchhammer MC, Post E, Stenseth NC, Boertmann D. 2002. Long-term responses in Arctic ungulate dynamics to variation in climate and trophic processes. Popul. Ecol. 44, 113–120 (doi:10.1007/s101440200013) [Google Scholar]
- 53.Forchhammer M, Boertmann D. 1993. The muskoxen, Ovibos moschatus, in north and northeast Greenland: population trends and the influence of abiotic parameters on population dynamics. Ecography 16, 299–308 (doi:10.1111/j.1600-0587.1993.tb00219.x) [Google Scholar]
- 54.Olesen CR. 1993. Rapid population increase in an introduced muskox population, West Greenland. Rangifer 13, 27–32 (doi:10.7557/2.13.1.1069) [Google Scholar]
- 55.Pedersen CB, Aastrup P. 2000. Muskoxen in Angujaartorfiup Nunaa, West Greenland: monitoring, spatial distribution, population growth, and sustainable harvest. Arctic 53, 18–26 [Google Scholar]
- 56.Lu WQ, Meng QJ, Tyler NJC, Stokkan KA, Loudon ASI. 2010. A circadian clock is not required in an Arctic mammal. Curr. Biol. 20, 533–537 (doi:10.1016/j.cub.2010.01.042) [DOI] [PubMed] [Google Scholar]
- 57.Reynolds PE. 2001. Reproductive patterns of female muskoxen in northeatern Alaska. Alces 37, 403–410 [Google Scholar]
- 58.Skogland T. 1990. Density dependence in a fluctuating wild reindeer herd; maternal versus offspring effects. Oecologia 84, 442–450 [DOI] [PubMed] [Google Scholar]
- 59.Bergerud AT. 1994. Evolving perspectives on caribou population dynamics, have we got it right yet? Rangifer 9, 95–116 [Google Scholar]
- 60.Rognømo A, Markussen KA, Jacobsen E, Blix AS. 1983. Effects of improved nutrition in pregnant reindeer on milk quality, calf birth weight, growth, and mortality. Rangifer 3, 10–18 [Google Scholar]
- 61.Reimers E, Ringberg T, Sorumgard R. 1982. Body-composition of Svalbard reindeer. Can. J. Zool. 60, 1812–1821 (doi:10.1139/z82-235) [Google Scholar]
- 62.Tyler NJC, Forchhammer MC, Øritsland NA. 2008. Nonlinear effects of climate and density in the dynamics of a fluctuating population of reindeer. Ecology 89, 1675–1686 (doi:10.1890/07-0416.1) [DOI] [PubMed] [Google Scholar]
- 63.Inouye DW, Barr B, Armitage KB, Inouye BD. 2000. Climate change is affecting altitudinal migrants and hibernating species. Proc. Natl Acad. Sci. USA 97, 1630–1633 (doi:10.1073/pnas.97.4.1630) [DOI] [PMC free article] [PubMed] [Google Scholar]
- 64.Ozgul A, Childs DZ, Oli MK, Armitage KB, Blumstein DT, Olson LE, Tuljapurkar S, Coulson T. 2010. Coupled dynamics of body mass and population growth in response to environmental change. Nature 466, 482–485 (doi:10.1038/nature09210) [DOI] [PMC free article] [PubMed] [Google Scholar]
- 65.Tafani M, Cohas A, Bonenfant C, Gaillard JM, Allaine D. 2013. Decreasing litter size of marmots over time: a life-history response to climate change. Ecology 94, 580–586 (doi:10.1890/12-0833.1) [DOI] [PubMed] [Google Scholar]
- 66.Cahill AE, et al. 2012. How does climate change cause extinction? Proc. R. Soc. B 280, 1–9 (doi:10.1098/rspb.2012.1890) [Google Scholar]
- 67.Visser ME, et al. 2003. Variable responses to large-scale climate change in European Parus populations. Proc. R. Soc. Lond. B 270, 367–372 (doi:10.1098/rspb.2002.2244) [DOI] [PMC free article] [PubMed] [Google Scholar]