

Abstract
Alzheimer's disease (AD) is hallmarked by amyloid plaques, neurofibrillary tangles, and widespread cortical neuronal loss (Selkoe, 2001). The “amyloid cascade hypothesis” posits that cerebral amyloid sets neurotoxic events into motion that precipitate Alzheimer dementia (Hardy and Allsop, 1991). Yet, faithful recapitulation of all AD features in widely used transgenic (Tg) mice engineered to overproduce Aβ peptides has been elusive. We have developed a Tg rat model (line TgF344-AD) expressing mutant human amyloid precursor protein (APPsw) and presenilin 1 (PS1ΔE9) genes, each independent causes of early-onset familial AD. TgF344-AD rats manifest age-dependent cerebral amyloidosis that precedes tauopathy, gliosis, apoptotic loss of neurons in the cerebral cortex and hippocampus, and cognitive disturbance. These results demonstrate progressive neurodegeneration of the Alzheimer type in these animals. The TgF344-AD rat fills a critical need for a next-generation animal model to enable basic and translational AD research.
Introduction
Alzheimer's disease (AD) is the most common form of dementia in elderly populations and is hallmarked by progressive: (1) deposition of amyloid-β peptides (Aβ; cleaved from amyloid precursor protein, APP) as β-amyloid plaques, (2) formation of neurofibrillary tangles (NFTs; chiefly comprised of the hyperphosphorylated microtubule-associated protein tau), (3) chronic neuroinflammation, and (4) neuronal injury and loss (Selkoe, 2001). As initially proposed, the “amyloid cascade hypothesis” purports that Aβ deposition as “senile” amyloid plaques is the principal etiopathological event in AD (Hardy and Allsop, 1991). The hypothesis further posits that Aβ aggregation sets downstream pathophysiologic processes into motion that culminate in neuronal injury and loss and precipitate dementia of the Alzheimer type (Rozemuller et al., 1989; Hardy and Allsop, 1991). The strongest support for the hypothesis comes from human genetic evidence: all mutations in APP or presenilins 1 or 2 (PS1/PS2) that drive Aβ accumulation invariably cause early-onset AD (Selkoe, 2001).
Yet, one of the key critiques of the hypothesis is that the “gold standard” animal models of the disease, Aβ-overproducing Tg AD mice (Games et al., 1995; Hsiao et al., 1996; Sturchler-Pierrat et al., 1997; Holcomb et al., 1998; Mucke et al., 2000; Jankowsky et al., 2001), do not demonstrate robust tauopathy and neuronal loss unless additional human transgenes are included that are not linked to familial AD (Oddo et al., 2003; Padmanabhan et al., 2006; Colton et al., 2008; Wilcock et al., 2008). Thus, the core tenant of the amyloid cascade hypothesis—that cerebral Aβ is both necessary and sufficient for development of AD—remains controversial. Because rats are 4–5 million years closer to humans than mice in evolution (Yang et al., 2004), we hypothesized that they may provide a better animal model for AD. Here, we report the generation and characterization of transgenic rats bearing mutant human APP and PS1 (line TgF344-AD) that manifest the full spectrum of age-dependent AD pathologies in conjunction with cognitive disturbance.
Materials and Methods
Animals.
TgF344-AD rats were generated on a Fischer 344 background by co-injecting rat pronuclei with two human genes driven by the mouse prion promoter: “Swedish” mutant human APP (APPsw) and Δ exon 9 mutant human presenilin-1 (PS1ΔE9). Both constructs used have previously been reported (Jankowsky et al., 2001). Transgene integration was confirmed by genotyping and expression levels were evaluated by Western blot (WB) of brain homogenates. Line 19 was selected for colony expansion, aging, and detailed analyses based on highest overall transgene expression levels. TgF344-AD rats and wild-type (WT) littermates were housed and maintained at the Cedars-Sinai Medical Center Department of Comparative Medicine vivarium, and all experiments were conducted in compliance with protocols approved by the Institutional Animal Care and Use Committee. We did not observe gender differences on any of the measures reported, and therefore males and females were combined for all analyses. TgF344-AD rats are available upon request via material transfer agreement.
Neurological screen.
Rats were initially behaviorally evaluated by neurological screen, which consisted of a battery of neurological reflex tests: righting response after being placed on the dorsal side; eye blink (response to light touch with a small camel hair brush), ear twitch, and limb withdrawal in response to tactile stimuli (light touch with a gloved finger); orienting response to olfactory (exposure to orange extract) and visual stimuli (flashlight); and startle response following an auditory stimulus (a metal clicker). Responses were scored as being present or absent. Visual and tactile responses were also assessed. For visual and tactile placing, the rat was loosely held in a gloved hand. For visual placing, the animal was allowed to view the surface of a table while the head and forelimbs were slowly brought down to the surface. For tactile placing, the rat was prevented from viewing the surface of a table by holding its chin up, and the forelimbs were slowly brought down to the surface. Placing was assessed by counting the number of correct placements of the limbs across 10 trials. Approximately 5 min/rat was required to complete the neurological screen. All behavioral tests were of a cross-sectional design and were conducted by a blinded examiner. Furthermore, code was not broken until all analyses were completed.
Open field test.
Locomotor activity was evaluated using a standard open field test. The open field apparatus (San Diego Instruments) consisted of an open topped, clear Plexiglas box measuring 40.6 × 40.6 × 38 cm. A ring of photo beams and optical sensors surrounded the box. The optical sensors were connected to a computer by way of an input matrix, and breaks in the photo beams were automatically recorded and used as a measure of locomotor activity. The observation cages were cleaned before the first run of the day, between subjects, and after the last run of the day using tap water followed by ethanol. On the day of testing, rats in their home cages were brought into the experimental room. The level of illumination in the room during experimental testing was set at 325 lux. Rats remained in the experimental room for 30 min, after which each rat was placed into the center of the observation cage, and counting began immediately. Beam breaks (locomotion) were recorded in 5 min bins for 60 min. The apparatus was programmed to record both central (defined as a 30.5 × 30.5 cm region in the center of the box) as well as total beam breaks. Data were plotted as beam breaks during each 5 min interval. For statistical analysis, the scores of beam breaks across the 60 min session were summed for each subject.
Object recognition test.
An object recognition test was performed to assess learning and memory. During the sampling phase, rats were removed from their home cages and placed in the object recognition box, which contained two identical objects (A1 and A2) fixed to the floor. After 3 min, the rat was removed from the object recognition box and returned to its home cage. Objects A1 and A2 were also then removed from the box. Twenty minutes were allowed to elapse before the start of the 3 min choice phase. During the choice phase, rats were singly removed from their home cages and returned to the object recognition box, where two new objects (A3 and B) were fixed to the floor. Object A3 was identical to objects A1 and A2, whereas object B differed from objects A1, A2, and A3. A videotape recording was made of the sample and choice phases, and two raters independently rated the time each rat explored each of the objects during the sample and choice phases. The percentage time spent exploring the new object (C) during the choice phase corrected for any location preference during the sample phase was taken as a measure of memory. Exploration of an object was defined as when the rat directed its nose toward the object at a distance of <2 cm.
Barnes maze.
The Barnes maze is a widely accepted test of hippocampus-dependent spatial reference learning and memory in rats. The maze (San Diego Instruments) consisted of a circular platform (122 cm in diameter) with 20 holes evenly spaced around the perimeter, and an aversive stimulus (bright light) located overhead. A dark, recessed chamber (escape box) was located under one of the perimeter holes of the platform. “False” escape boxes, too small for the rat to enter but otherwise identical to the escape box, were oriented under the other holes. To create different learning paradigms, the escape box can be moved to a different location or the maze can be rotated. Photobeams and optical sensors surrounded each hole, and the optical sensors were connected to a computer by way of an input matrix, and breaks in the photo beams were automatically recorded. To begin the experiment, the rat was placed into a start tube (30.5 cm high and 20.3 cm in diameter) in the center of the maze. After a 30 s acclimation period, a bright spotlight was illuminated and the start tube was lifted off of the rat. The session ended when the rat entered the escape box, or after 3 min elapsed. Once the rat entered the escape box, the spotlight was turned off and the rat was allowed to remain in the box for 2 min. Training was repeated four times daily. The maze was rotated to change the position of the escape box by at least 90° each day, and the position of the small hole alignment remained consistent (i.e., one hole was always centered on the north edge). Rotation of the escape box forces the rat to use external spatial cues from the room rather than olfactory or local cues. During testing, the number of errors, the location of the first hole searched, and the latency to enter the goal box used to solve the maze were recorded. Errors were defined as searches of any hole that did not have the goal box beneath it. Searches included nose pokes and head deflections into a hole. However, successive pokes into the same hole were not counted as repeated errors. After 4 d of testing, 72 h were allowed to relapse before the animals are tested again for retention. After a single retention trial, the location of the box was shifted, and animals were retrained as above on the next day and the following day.
Reagents.
Antibodies against PS1 (clone NT1) and Aβ/APP (clones 6E10, 4G8, 12F4, 11A50, and 22C11), were obtained from Covance and were used at dilutions of 1:200 for immunohistochemistry (IHC) and 1:500 for Western blot (WB). Antibodies against abnormally phosphorylated tau (clones CP13 and PHF1, 1:50 for IHC, and 1:100 for WB) were generously supplied by P. Davies (Albert Einstein College of Medicine of Yeshiva University, Manhasset, NY); the oligomeric/conformational Aβ antibody (clone OC, 1:2500 for IHC) was a gift from D. H. Cribbs and C. G. Glabe (University of California, Irvine, CA), and clone A11 (1:500 for IHC) was obtained from Biosource. The pTau-PADRE pS396/404 antibody was made by immunizing rats with synthetic tau peptide (382-418) conjugated with the prototypical T cell epitope, PADRE (Think Peptides). An antibody against total tau (clone Tau-5, 1:500 for WB), phalloidin (AlexaFluor 647 conjugated, 1:40 for IHC), and ProLong Gold anti-fade mounting media with DAPI were obtained from Invitrogen. Antibody against Tuj1 (1:1000 for IHC and WB) was purchased from Sigma, and actin antibody (1:1000 for WB) was obtained from Millipore. An antibody against Iba1 (1:200 for IHC) was obtained from Wako Ltd. TUNEL stain was purchased from Roche and used in accordance with the manufacturer's instructions. Antibodies against total and cleaved Caspase-3 were obtained from Cell Signaling Technology (1:200 for IHC; 1:1000 for WB).
Tissue preparation.
Following cardiac perfusion with sterile ice-cold PBS, rat brains were rapidly isolated and bisected into hemispheres. One hemisphere was fixed in 4% paraformaldehyde (PFA) before routine processing and paraffin embedding for histochemical analyses. The remaining hemisphere was weighed, snap frozen, and homogenized in 2 ml of ice-cold lysis buffer (Cell Signaling Technology) supplemented with 1 mm phenylmethylsulfonyl fluoride for biochemical analyses. Briefly, brains were mechanically dissociated using an Ika disperser for 2 min and were allowed to stand for 15 min at 4°C. Following homogenization of snap-frozen hemispheres, samples were separated into two equal aliquots, which were then centrifuged at 10,000 × g for 15 min at 4°C and stored at −80°C. One aliquot was subjected to biochemical analysis for APP, Aβ, and Caspase-3, while the remaining aliquot was used for tau biochemical analysis. For EM, rats were perfused for 5 min at 120 mm Hg through the transcardial access using 4% buffered formalin freshly prepared from PFA mixed with 0.1% glutaraldehyde. Freshly isolated brains were post-fixed in the same solution overnight, infiltrated in a graded series of glycerols, and then sectioned in the coronal plane at 100 μm thickness using a vibratome. Regions of interest were micro-dissected, routinely processed with osmium tetroxide followed by uranyl acetate, and embedded in Epon for transmission EM analysis.
Immunohistochemistry and microscopy.
Ten micrometer paramedian sagittal sections were sliced at 50 μm intervals using a microtome and mounted on glass slides. Sections were routinely dewaxed, hydrated in a graded series of ethanol, and boiled for 30 min in antigen retrieval buffer before serum-free protein block (Dako Cytomation) application. Sections were then hybridized with various primary antibodies followed by incubation with the appropriate horseradish peroxidase (HRP)- or fluorophore-conjugated secondary antibodies. For HRP-conjugated secondary antibodies, sections were developed with an HRP-labeled polymer-based kit (Dako EnVision) coupled with the 3′-3′ diaminobenzidine substrate followed by routine dehydration in a graded series of ethanols and xylene. For amyloid burden, sections were directly stained with Thioflavin S (ThioS) according to standard practice. All sections were coverslipped with the appropriate mounting media (Prolong Gold or Permount) before imaging. Bright-field and structured illumination fluorescent images were obtained using a Zeiss AxioImager Z1 with attached ApoTome and CCD camera (Carl Zeiss Microimaging). Confocal images were taken using an Eclipse C1 instrument with four independent laser lines (Nikon Instruments). Images were digitized into a PC running Windows XP, and image analysis of micrographs was conducted using ImageJ software (NIH).
Biochemical analyses.
We carried out biochemical analysis of Aβ peptides according to a two-step extraction method (Johnson-Wood et al., 1997; Tan et al., 2002). Briefly, detergent-soluble Aβ1–40,42 species were separately detected in rat brain homogenates prepared with lysis buffer described above at a 1:25 dilution. Detergent-insoluble Aβ1–40,42 species were detected by extraction of homogenate pellets in the chaotropic agent, 5 m guanidine-HCl, followed by a 1:12,500 dilution in lysis buffer. Protein levels were normalized by BCA protein assay (Pierce Biotechnology). Aβ species were separately quantified in detergent-soluble and -insoluble (5 m guanidine-HCl-extracted) fractions using Aβ1–40,42 ELISA kits (Invitrogen) and (N) 82E1 Aβ oligomers (IBL Laboratories) in accordance with the manufacturer's instructions, except that standards included guanidine-HCl in some cases. For tau analysis, pellets were re-homogenized in a 10% salt-sucrose solution to obtain various soluble and insoluble fractions for WB (Greenberg and Davies, 1990). Crude pellet tau was obtained by re-homogenization of pellets with Tris-buffered saline, pH 7.4, followed by gentle centrifugation at 1000 × g for 5 min at 4°C. Protein levels of homogenate samples were determined by BCA protein assay before electrophoresis. Aliquots of protein were electrophoretically separated using 10% Bis-Tris gels. Electrophoresed proteins were then transferred to nitrocellulose membranes, blocked in Tris-buffered saline (TBS) containing 5% (w/v) non-fat dry milk, and subsequently hybridized with various primary antibodies. Membranes were then incubated with the appropriate HRP-conjugated secondary antibody before development with chemiluminescent substrates. Densitometric analysis of blots was conducted using ImageJ software.
Neuronal stereology.
Whole-number neuronal estimates were done using the optical fractionator method of stereological counting with stereological software (Stereo Investigator; MBF Bioscience). Para-median sagittal serial sections spaced 50 μm apart were stained with NeuN. Anatomical regions of interest [ROIs; including the entire cerebral cortex, cingulate, and retrospenial cortex, cornu ammonis 1 (CA1), CA2, CA3, dentate gyrus, hilus, and granule cell layer; illustrated in Fig. 1] were defined according to the Paxinos and Watson (2005) rat brain atlas. A grid was placed randomly over the ROI slated for counting. At random positions within the grid, as determined by the software, cells were counted within three-dimensional optical dissectors (50 × 50 × 10 μm) with a 100× objective. Within each dissector, 1 μm guard zones at the top and bottom of the section surface were excluded. Section thickness was measured regularly and averaged 12 μm for all sections analyzed, allowing for uniform antibody penetration. The average sum of the optical dissectors used was 185 for the cingulate cortex (CC) and 72 for the hippocampus (HC). Estimated totals by number weighted section thickness were obtained with StereoInvestigator yielding a coefficient of error <0.10. Neuronal densities were calculated by adjusting these totals by the tissue volume of the ROI investigated.
Figure 1.

Neuronal estimation by stereology. A diagram is shown to illustrate regions of interest for neuronal stereological analyses.
Statistical analyses.
All data were normally distributed; therefore, in instances of single mean comparisons, Levene's test for equality of variances followed by t test for independent samples was used. In instances of multiple mean comparisons, ANOVA was used, followed by post hoc comparison using Bonferroni's method. Wherever possible, we used a hierarchical analysis strategy, where overall multi-way ANOVAs were run before one-way ANOVA followed by post hoc testing. Alpha levels were set to 0.05, and all analyses were conducted using SPSS software, release 15.0 (SPSS) or Statictica (Statsoft). All analyses were conducted by a blinded examiner, and code was not broken until analyses were completed.
Results
Generation and behavioral analysis of TgF344-AD rats
We generated transgenic (Tg) AD rats on a Fischer 344 background by coinjection with APPsw and PS1ΔE9 (Fig. 2A,B), each independent autosomal dominant causes of familial early-onset AD. TgF344-AD rats expressed 2.6-fold higher human holo- and secreted APPsw proteins than endogenous rat APP by N-terminal APP antibody 22C11 and 6.2-fold increased human PS1ΔE9 protein abundance versus endogenous rat N-terminal PS1 fragment using human-selective PS1 antibody NT1 (Fig. 2C,D). We began by evaluating behavioral impairment in three cohorts of WT and TgF344-AD rats at 6, 15, and 24 months of age. Neurologic screening did not reveal between-genotype differences with respect to righting response, eye blink, ear twitch, limb withdrawal in response to tactile stimuli, orienting response to olfactory and visual stimuli, startle response, or visual and tactile placing (data not shown). Yet, TgF344-AD rats displayed hyperactivity, which may result from disinhibition associated with hippocampal or cortical injury. This phenotype was operationalized as increased numbers of beam breaks and rears in an open field behavioral assay. Specifically, ANOVA revealed significant (p < 0.01 for beam breaks; p < 0.001 for rears) genotype × time effects that were confirmed by post hoc analyses in 15-month-old TgF344-AD rats (Fig. 2E). Hyperactivity was age-dependent, because overall ANOVA did not reveal significance (p > 0.05) in younger 6-month-old TgF344-AD rats for beam breaks (data not shown) or rearing activity, although 6-month-old Tg rats reared significantly more (p < 0.05) during the first 5 min of open field testing (Fig. 2F). Novel object recognition, a hippocampus-dependent measure of working memory in the rat (Wan et al., 1999), was significantly (p < 0.001) and almost completely impaired in older (24 months old) Tg animals (Fig. 2G).
Figure 2.

Age-dependent behavioral impairment in TgF344-AD rats. A, Schematic of plasmids coinjected into Fischer rat pronuclei to generate TgF344-AD rats, adapted from the study by Jankowsky et al. (2001). B, PCR results from APPsw, PS1ΔE9, or TcRδ reactions. C, Western blots for brain APP, PS1ΔE9, PS1 N-terminal fragment (NTF), or actin are shown. D, Densitometric analysis of Western blots from WT or transgenic rat brains are shown (n = 12) relative to actin. Fold increases across genotype are indicated. E–I, Six groups of littermate rats, including both WT and Tg animals aged 6 months (WT, n = 21; Tg, n = 21), 15 months (WT, n = 28; Tg, n = 30), or 24 months (WT, n = 21; Tg, n = 20), were subjected to behavioral testing. E, F, Total movement (by rearing or beam breaks) was evaluated in an open field in 5 min bins over 60 min. G, Preference for a novel versus a familiar object is shown. H, I, Errors made during Barnes maze testing are shown. All data are represented as means + SEM.
We also assessed cognitive performance in the Barnes maze, a widely accepted test of hippocampus-dependent spatial reference learning and memory in rats (Barnes, 1979; Barnes et al., 1994). While 6-month-old WT and TgF344-AD rats learned the initial location of the escape box equally well (Fig. 2H), 15-month-old Tg animals made significantly (p < 0.01) more errors during the learning phase by overall ANOVA and by post hoc testing (*p < 0.05; Fig. 2I). In the memory probe trial, this older cohort of Tg rats performed significantly (p < 0.01) worse than WT animals by overall ANOVA and by post hoc analyses, indicating impaired spatial reference memory (*p < 0.05; Fig. 2I). Further evidence of impairment came from the reversal phase of the task, where the escape box was randomly rotated to another location. Specifically, 15-month-old Tg rats made significantly (p < 0.01) more errors than WT littermates by ANOVA and by post hoc analyses (*p < 0.05; **p < 0.01; Fig. 2I). A similar pattern of significant (p < 0.05) results was observed in 24-month-old Tg rats (Fig. 2I), and even the 6-month-old Tg rats trended toward significance during the reversal phase (Fig. 2H). Thus, TgF344-AD rats exhibit progressive, age-dependent abnormalities in open field activity and spatial learning and memory.
Progressive Aβ deposition in TgF344-AD rats
We next examined cerebral β-amyloid pathology and Aβ abundance in cohorts of Tg animals at various ages (6, 15–17, and 25–27 months old) by multiple independent strategies (see Materials and Methods). Quantitative histological analysis of Tg rats using Aβ antibody (4G8) and ThioS disclosed significant (p < 0.001) age-dependent β-amyloid deposition (∼10–82 fold increased vs 6-month-old animals) in the CC and HC of Tg rats (Fig. 3A–D), brain areas classically associated with AD-type pathology in humans (Selkoe, 2001). A similar pattern of results was also observed in the striatum and cerebellum (data not shown), additional brain regions that commonly succumb to amyloid plaques in AD and Down's syndrome (Braak et al., 1989; Joachim et al., 1989; Braak and Braak, 1990; Dickson et al., 1990). Deposition of Aβ in cerebral vessels, a pathological feature known as cerebral amyloid angiopathy (CAA), occurs in 86% of AD patients (Ellis et al., 1996). CAA analyses were conducted as previously described (Wyss-Coray et al., 1997; Wyss-Coray et al., 2001), and revealed copious (Fig. 3A, see arrows) and significant (*p < 0.05; **p < 0.01) age-dependent pathology in Tg rat CC and HC (Fig. 3E), while WT littermates were devoid of both brain parenchymal β-amyloid and CAA at any age (data not shown). CAA-like pathology also progressively accumulated in the striatum and cerebellum of Tg rats (mean CAA score ± SEM of Tg rats at 6 vs 16 vs 26 months-old: striatum, 0.05 ± 0.05 vs 0.88 ± 0.07 vs 1.47 ± 0.16; cerebellum, 0.05 ±. 0.05 vs 1.93 ± 0.55 vs 3.18 ± 0.43). To determine whether β-amyloid deposits could be detected in TgF344-AD rats by molecular imaging, we injected them with the radiotracer [18F] 2-(1-(6-[(2-[F-18]fluoroethyl) (methyl)amino]-2-naphthyl)ethylidene) malononitrile propene (18F-FDDNP) (Agdeppa et al., 2001; Small et al., 2006) for dynamic MicroPositron Emission Tomography (MicroPET). As early as 15 months of age, TgF344-AD rats showed higher 18F-FDDNP distribution volume ratios (DVRs) in the frontal cortex (FC) region versus WT littermate rats (Fig. 3F). Fluorescence microscopy disclosed abundant extracellular FDDNP+ hippocampal deposits as well as apparent intraneuronal signals (Fig. 3G).
Figure 3.
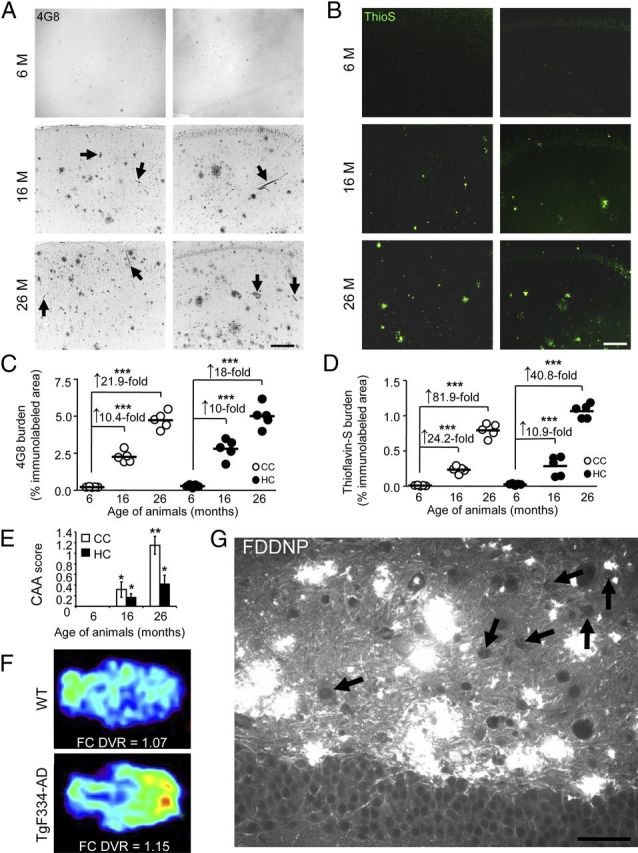
TgF344-AD rats manifest progressive Aβ deposition. A, B, Photomicrographs are shown from TgF344-AD rat brain sections with median values by image analysis for human Aβ immunohistochemistry. Two brain areas (CC and HC) and three age groups (6, 16, or 26 months) are shown for antibody 4G8 (A) and ThioS stain (B). Arrows in A indicate CAA. Photomicrographs taken of cortex or HC from transgenic animals (4 sections per animal, n = 5) were subjected to quantitative image analysis for 4G8 (C) or ThioS burden (D). Fold increases across age points are indicated for each brain region. Scale bars: A, B, 100 μm. E, Quantitative image analysis of ThioS-stained TgF334-AD rat brain sections was performed to assess CAA. Bars represent the mean CAA score ±SEM of each cohort (4 sections per animal, aged 6 months, n = 5; 16 months, n = 5; 26 months, n = 5). F, Representative MicroPET images are shown from 15-month-old WT and TgF344-AD rats using the amyloid radiotracer, 18F-FDDNP. Parametric color-coded transverse images are shown of distribution volume ratios (DVRs), with brainstem as the reference region. Frontal cortex (FC) is oriented toward the right and brainstem, toward the left. Colors run from blue (lowest DVR = 0.95) to red (highest DVR = 1.2). Similar results were obtained from 2 to 3 additional rats. G, A brain section from a 15-month-old TgF344-AD rat reacted with FDDNP shows abundant Aβ deposits in the dentate gyrus by fluorescence microscopy. Arrows indicate apparent intraneuronal hilar FDDNP-reactive deposits, and scale bar denotes 50 μm.
TgF344-AD rat brains accumulate intraneuronal Aβ1–42 and soluble Aβ oligomers
To further investigate the possibility of intraneuronal Aβ, we immunostained brain sections with C-terminal Aβ isoform-specific antibodies. While Aβ1–40 was not detected in neuronal somata, TgF344-AD rats exhibited intraneuronal Aβ1–42 by confocal microscopy at 16 months of age (data not shown). Staining with A11 antibody, which has been reported to recognize Aβ oligomers (Necula et al., 2007; Yoshiike et al., 2008), revealed hippocampal pyramidal neurons that were double-positive for FDDNP (data not shown), supporting the existence of intraneuronal Aβ in Tg rat brains. Furthermore, biochemical analysis of brain homogenates from TgF344-AD rats confirmed age-dependent Aβ accumulation. Separate sandwich ELISAs for Aβ1–40 and Aβ1–42 in both detergent-insoluble and -soluble brain extracts (Johnson-Wood et al., 1997; Tan et al., 2002; Town et al., 2008) revealed significant (p < 0.001) progressive increases for both fractions of Aβ1–40 and Aβ1–42 in Tg rats (Fig. 4A,B). Notably, Tg rats had striking overabundance of soluble Aβ1–40 as early as 6 months of age (Fig. 4B), before appreciable β-amyloid plaque formation (Tg rats at this age only have 0–3 plaques per brain section). Intriguingly, ratios of the more pathogenic detergent-soluble Aβ1–42 (Walsh et al., 2000; Selkoe, 2001; Walsh et al., 2002a, b) to Aβ1–40 progressively increased in TgF344-AD rat brains, while a similar ratio considering detergent-insoluble Aβ species revealed a corresponding decrease with age (Fig. 4C). These findings raise the intriguing possibility that neurotoxic Aβ1–42 oligomers (Walsh et al., 2002a; Shankar et al., 2008), which reside in the detergent-soluble brain homogenate fraction, are preferentially increasing over time relative to insoluble Aβ peptides in Tg animals.
Figure 4.
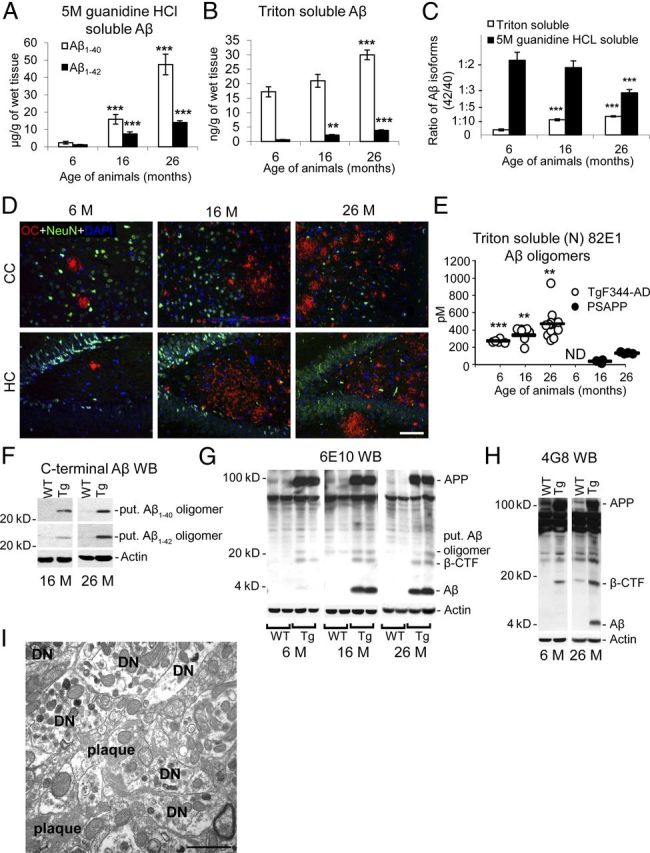
Progressive accumulation of intraneuronal Aβ1–42 and detergent-soluble Aβ oligomers in TgF344-AD rats. A–C, Two-step-extracted brain homogenates from TgF344-AD rats were assayed for 5 m guanidine HCl-soluble (A) or detergent-soluble (B) human Aβ1–40 or Aβ1–42. Aβ1–42/Aβ1–40 ratios within each fraction are shown in C. Bars represent means ± SEM (aged 6 months, n = 5; 16 months, n = 7; 26 months, n = 8). D, Photomicrographs are shown from TgF344-AD rat brain sections reacted with soluble fibrillar Aβ oligomer antibody OC, neuronal nuclei antibody (NeuN), and DAPI. Two brain areas (CC and HC) and three age groups (6, 16, or 26 months) are shown, and the scale bar denotes 100 μm. E, Detergent-soluble (N) 82E1-oligomers were detected by ELISA in TgF344-AD rats versus PSAPP mice (n = 3–11/rodents per group; ND, not detectable). F–H, Western blots (WBs) are shown for brain actin, APP and associated metabolites, and putative (put.) Aβ oligomer using C-terminal Aβ (clones 12F4 or 11A50; F), 6E10 (G), and 4G8 (H) antibodies. I, An electron micrograph is shown from Tg-F344-AD rat HC depicting a plaque surrounded by numerous dystrophic neurites (DN).
To further examine this possibility, we performed immunohistochemical analysis using OC, a conformational antibody that recognizes soluble oligomeric fibrillar Aβ (Kayed et al., 2003; Kayed and Glabe, 2006). Consistent with this hypothesis, TgF344-AD rat brains showed age-dependent accumulation of OC immunoreactivity in both the CC and the HC (Fig. 4D). Quantification of soluble (N) 82E1-oligomers by ELISA revealed strikingly greater abundance of these Aβ species in TgF344-AD rats versus PSAPP mice (both Tg rodents were generated using the same constructs) that was statistically significant (**p < 0.01; ***p < 0.001; Fig. 4E). As independent validation, WB with both Aβ C-terminal and N-terminal-specific antibodies revealed presence of putative soluble oligomeric Aβ (likely a ∼22 kDa pentamer) in Tg rat brain homogenates (Fig. 4F). Antibody 6E10 revealed monomeric Aβ, a putative Aβ oligomer, APP, and an ∼18 kDa band that was likely the β-C-terminal fragment of APP (β-CTF, which contains the Aβ domain), all of which were increased in Tg versus WT rat brains (Fig. 4G). The β-CTF identity of this ∼18 kDa band was confirmed by WB with Aβ middle region-specific 4G8 antibody (Fig. 4H). Finally, EM analysis of β-amyloid plaques revealed fibrillar ultrastructure and numerous dystrophic neurites in close proximity to plaques (Fig. 4I).
Tauopathy in TgF344-AD rats
APP and PS1 mutations increase brain Aβ abundance but do not precipitate frank neurofibrillary tangles (NFTs) in Tg mouse models of cerebral amyloidosis (Games et al., 1995; Duff et al., 1996; Hsiao et al., 1996; Sturchler-Pierrat et al., 1997; Holcomb et al., 1998; Mucke et al., 2000; Jankowsky et al., 2001). Some of the Tg AD mouse models do manifest hyperphosphorylated tau (Sturchler-Pierrat et al., 1997; Tan et al., 1999), which may represent “pretangles” that do not progress to NFTs. We probed for tau pathology in Tg rats by silver-impregnating brain sections using the Gallyas method (Lamy et al., 1989; Rosenwald et al., 1993). Strikingly, numerous structures were detected in close proximity to β-amyloid plaques in aged Tg rats that were reminiscent of NFTs found in AD patient brains (Fig. 5A). In addition, CP13 immunostaining revealed teardrop-shaped structures morphologically consistent with NFTs in 16-month-old Tg rats (Fig. 5A). Importantly, NFT-like structures were frequently observed in nonplaqued areas of CC and HC, much akin to human AD (Fig. 5B).
Figure 5.

TgF344-AD rats have tau hyperphosphorylation and neurofibrillary tangles. A, Photomicrographs are shown of cingulate cortex from 16-month-old WT or TgF344-AD rats reacted with Gallyas silver stain (top) or phospho-tau antibody CP13 (bottom). Insets show representative dysmorphic neurons, and scale bars denote 25 μm. B, Comparison of tau pathology among AD patients, TgF344-AD rats, Tg2576, and PSAPP mice. Photomicrographs are shown from cingulate cortex stained with MC1 antibody, and scale bar denotes 10 μm. C–E, Three-step extracted brain homogenates from WT or TgF344-AD rats were assayed for phospho-tau by WB. Western blots are shown using pTau-PADRE primary antibody (C) on brain homogenates from Tg versus WT rats from 6 to 26 months of age in the crude pellet fraction. Densitometry results are shown for crude pellet (D) or Sarkosyl insoluble (E; top) or pTau-PADRE-reactive tau ratios for each fraction (bottom) (normalized to total input tau). Bars represent the mean ratios ±SEM for each WT or Tg cohort (aged 6–26 months, n = 5; 16 months, n = 7; 26 months, n = 8). F, The pTau-PADRE antibody was incubated with or without excess blocking peptide and reacted with AD patient cortex.
To further understand the nature of tauopathy in Tg rats, brain homogenates from TgF344-AD and WT rats were extensively analyzed by tau biochemistry using previously described methods (Greenberg and Davies, 1990). We began by raising our own antibodies in rats against a peptide fragment of pathogenic tau containing the pS396/404 epitope (designated pTau-PADRE, see Materials and Methods). WB for total tau in rat brain homogenates using Tau-PADRE antibody revealed six bands ∼48–62 kDa in size (data not shown), which likely contain six isoforms of rat tau that are similar to those present in the human (Hanes et al., 2009), and pTau-PADRE WB revealed increased immunoreactivity in aged TgF344-AD versus WT rats (Fig. 5C). Quantitative analyses disclosed elevated abundance of insoluble (crude pellet-extracted) tau in aged TgF344-AD rats, and abnormal rat tau precipitation from Sarkosyl soluble-to-insoluble fractions in 6 and, more strikingly, 16-month-old Tg versus WT rat brains (†p < 0.10, *p < 0.05, **p < 0.01; Fig. 5D,E). To ensure that the pTau-PADRE antibody was specific for human pTau, a peptide neutralization experiment was performed using sections from AD patient cortex. As shown in Figure 5F, a tenfold molar excess of blocking peptide completely abolished NFT labeling. To further confirm tauopathy in TgF344-AD rats, a panel of well-validated pathogenic tau antibodies was used, and revealed a similar pattern of results (Fig. 6A–F). It is noteworthy that initial tau changes at 6 months of age precede frank β-amyloid plaque formation, and may therefore represent an early response to abnormally high concentrations of cerebral soluble Aβ species.
Figure 6.
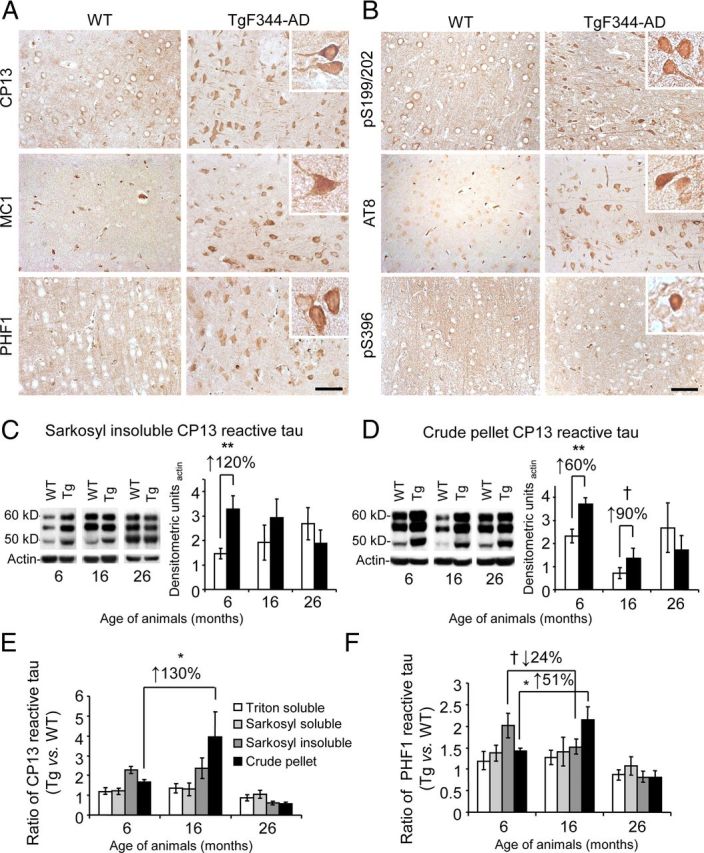
Additional evidence of neurofibrillary tangles and tau hyperphosphorylation in TgF344-AD rats. A, B, Widespread cortical tau pathology is present in 16-month-old TgF344-AD rat brains. Panels show representative brain sections from cingulate cortices of WT and Tg rats reacted with a well-validated panel of pathologic tau antibodies. Insets show higher magnification phospho-tau positive neurons, and scale bars denote 50 μm. C, D, Three-step extracted brain homogenates from WT or TgF344-AD rats were assayed for phospho-tau by WB. WBs are shown for brain (left) Sarkosyl-insoluble (C) or crude pellet tau (D) probed with CP13 and actin antibodies. Densitometric analyses (relative to total tau) are shown to the right. E, F, Three-step extracted brain homogenates from WT or TgF344-AD rats were assayed for CP13 (E) or PHF1 (F) phospho-tau by WB, and summary analyses are shown.
Reactive gliosis and phagocytosis of neuronal debris in TgF344-AD rats
We further evaluated neuroinflammation in multiple age cohorts of Tg and WT rats. Immunohistochemistry for activated microglia (using Iba1 antibody) and astrocytes (by GFAP immunostaining) disclosed progressive and statistically significant (**p < 0.01; ***p < 0.005) increased microgliosis and astrogliosis burden in the CC and HC of TgF344-AD rats versus age-matched WT littermates (Fig. 7A–D). Interestingly, reactive microglia and astrocytes were elevated as early as 6 months of age in Tg versus WT rats, before appreciable Aβ deposition but concurrent with elevated soluble and oligomeric Aβ species. Furthermore, microglia from aged Tg rats were hyperplasic and hypertrophied (Fig. 7A,C) in close vicinity of β-amyloid plaques (Fig. 7E) and often contained ThioS+ deposits near ThioS-decorated neurons (Fig. 7F). We reasoned that, if microglia were actually phagocytizing ThioS+ neurons, then the microglia should also show evidence of engulfment of a bona fide neuronal marker. Indeed, IHC revealed neuronal nuclei (NeuN) deposits within the cytoplasm of Iba1+ cells (Fig. 7G). If microglia were in fact clearing neuronal debris, then we may also expect neuronal loss in TgF344-AD rats.
Figure 7.
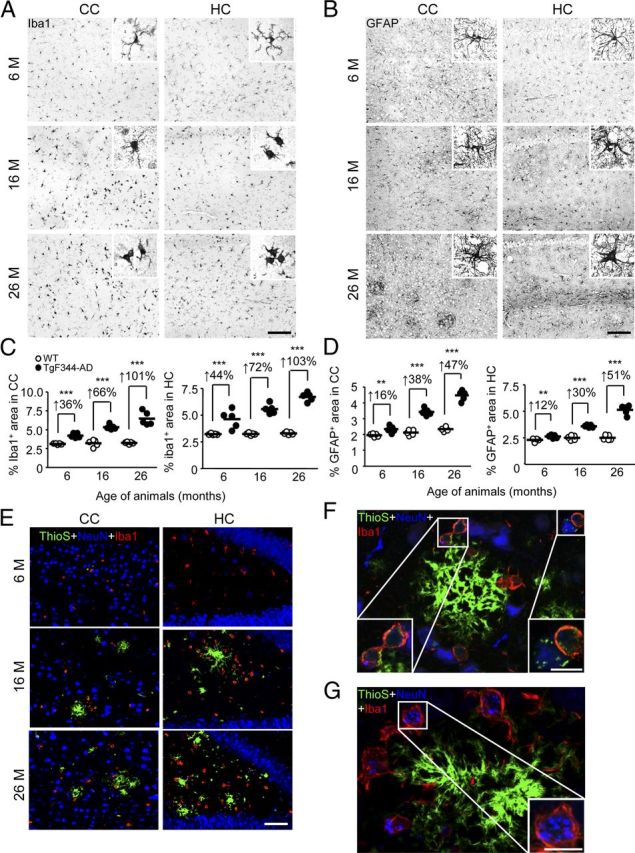
TgF344-AD rats have neuroinflammation and microglial uptake of neuronal debris. A–D, Photomicrographs are shown from TgF344-AD rat brain sections with median values by image analysis for gliosis IHC. Two brain regions (CC or HC) and three age groups (6, 16, or 26 months) are shown for Iba1 antibody (A) or GFAP antibody (B) staining. Photomicrographs taken of CC or HC from WT or TgF344-AD rats (4 sections per animal, n = 5) were subjected to quantitative image analysis for Iba1 (C) or GFAP burden (D). Percentage increases within ages are indicated for each brain region. Scale bars: A, B, 100 μm. E, Photomicrographs are shown of TgF344-AD rat brain sections stained with ThioS, NeuN antibody, and Iba1 antibody. Two brain regions (CC or HC) and three age groups (6, 16, or 26 months) are shown, and the scale bar denotes 50 μm. F, G, Photomicrographs of cortex from 26-month-old TgF344-AD rats stained with ThioS, NeuN antibody, and Iba1 antibody are depicted. Insets show amyloid-containing (F) or neuronal nuclei (NeuN; G) containing microglia, and scale bars denote 10 μm.
TgF344-AD rats exhibit frank neuronal loss and neurodegeneration
The above results raised the possibility that neurons harboring pathogenic tau may be rendered susceptible to death. Two independent strategies were adopted to assess putative neuronal loss in Tg animals. Following IHC analysis with NeuN antibody, we (1) conducted exhaustive manual subfield counting and (2) performed stereological whole number estimates of neurons in the cerebral cortex and HC. Strikingly, there was statistically significant (***p < 0.005) cortical and hippocampal neuronal loss in Tg rats that was both progressive and frank (ranging from 23 to 45%; Fig. 8A–C). Progressive neuronal loss was also observed in specific subfields of the HC. At 6 months of age, cell counts (NeuN+ cells/mm3) were similar between WT and Tg rats in the granule cell layer of the dentate gyrus (mean ± SD; WT: 18,810 ± 1143, Tg: 19,031 ± 2192), the hilus of the dentate gyrus (WT: 900 ± 135, Tg: 947 ± 184), and the CA2+CA3 regions of the HC (WT: 3025 ± 212, Tg: 3116 ± 363). However, at 16 and 26 months of age, there were 33 and 37% decreases, respectively, of NeuN+ cells in the dentate gyrus (16 months; WT: 18,235 ± 2310, Tg: 12,178 ± 1220; 26 months; WT: 17,175 ± 2283, Tg: 10,750 ± 1976), 63 and 66% decreases in the hilus (16 months; WT: 820 ± 67, Tg: 305 ± 73; 26 months; WT: 794 ± 109, Tg: 267 ± 62), and 36 and 45% decreases in CA2+CA3 (16 months; WT: 2790 ± 284, Tg: 1778 ± 310; 26 months; WT: 2740 ± 421, Tg: 1490 ± 350).
Figure 8.
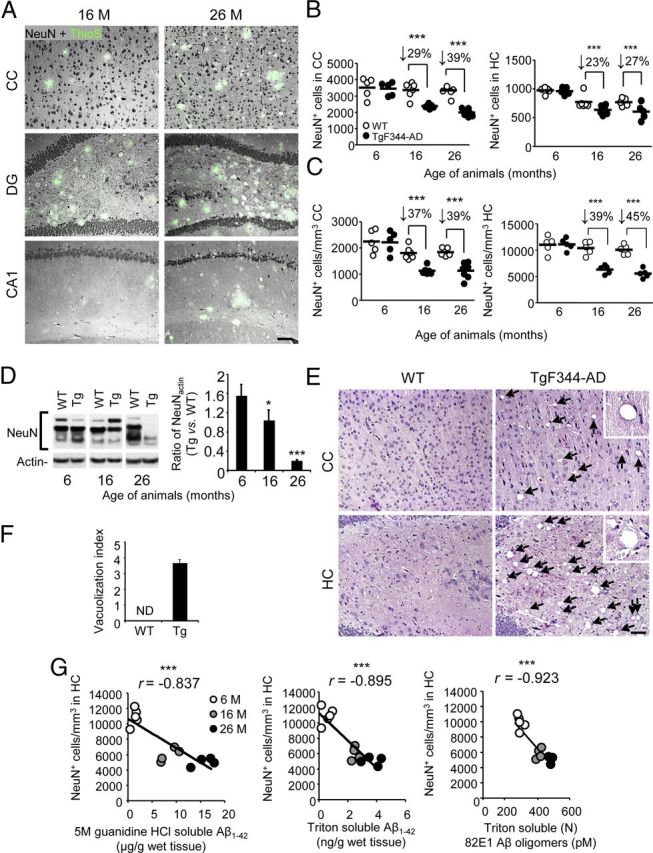
Neuronal loss and degeneration in TgF344-AD rats. A, Photomicrographs are shown of 16 or 26-month-old TgF344-AD rat brain sections stained with neuronal nuclei antibody (NeuN, greyscale signal) and ThioS (green signal). Three brain areas (CC; dentate gyrus, DG; CA1) are shown, and the scale bar denotes 100 μm. B, WT or Tg rat brain sections (4 per animal, n = 5 for each genotype) were reacted with NeuN antibody and subjected to exhaustive manual cell counting for CC (left) or HC brain regions (right). C, Stereological whole number estimates of NeuN+ neurons in WT or TgF344-AD rat (n = 5 for each genotype) brain sections are shown for CC (left) or HC/CA1 regions (right). B, C, Percentage decreases for Tg versus WT rats within age groups are indicated for each brain region. D, WBs are shown for brain-specific NeuN and corresponding densitometry results (normalized to input actin) are shown to the right. Bars represent mean ratios ±SEM for each WT or Tg cohort (aged 6–26 months; n = 4 rats/group). E, Photomicrographs of H&E-stained brain sections from 27-month-old WT and Tg rats are shown. Two brain areas (CC and HC) are depicted. Arrows indicate cerebral vacuoles, and the scale bar denotes 100 μm. F, Semi-quantitative image analysis of H&E-stained rat brain sections was performed to assess vacuolization. Bars represent mean scores ±SEM of each cohort (3 sections per animal, n = 8 rats/group; CC and HC from 16 and 26-month-old WT and Tg animals were combined; ND, not detected). G, Pearson product-moment correlation analyses were conducted to examine association between hippocampal (CA1) neuronal loss and various Aβ species.
Western blots of rat brain homogenates showed age-dependent decreases in NeuN abundance, supporting evidence of neuronal loss (†p < 0.10, p < 0.05; ***p < 0.005; Fig. 8D). The appearance of vacuolar pathology in older Tg rats further bolstered these conclusions (Fig. 8E,F). To determine whether a relationship existed between cerebral Aβ species and neuronal loss in TgF344-AD rats, Pearson product-moment correlation analyses were conducted and revealed statistically significant (***p < 0.001) inverse correlations between Aβ1–42 and (N) 82E1 Aβ oligomers with numbers of NeuN+ neurons present in the CC and HC (***p < 0.005; Fig. 8G). Strikingly, however, strongest significance was detected when inversely correlating triton-soluble Aβ1–42 or (N) 82E1-oligomers with NeuN+ cells in both the cerebral cortex (data not shown) and HC of transgenic rats (Fig. 8G). Moreover, Pearson product-moment correlation analyses also revealed statistically significant (p < 0.05) inverse correlations between numbers of NeuN+ neurons present in the CC and HC and either 4G8 (CC: r = −0.677; HC: r = −0.874) or ThioS burden (CC: r = −0.593; HC: r = −0.739) in these brain regions (data not shown).
There were additional indices of neuronal degeneration and death in TgF344-AD rats. For example, quantitative microscopy for nicked DNA by TUNEL assay (Fig. 9A,B) and apoptosis by total and cleaved (active) caspase-3 (Fig. 9C,D) prompted the conclusion that neurons were significantly (†, a trend of p < 0.10; *p < 0.05; ***p < 0.005) dying via apoptosis in older Tg rats. In addition, we observed Hirano bodies at both light microscopic and ultrastructural levels in the cortex and HC (Fig. 9E,F). Immunohistochemical analyses of cleaved (active) caspase-3 in the dentate gyrus revealed pyknotic nuclei, further evidencing age-dependent neuronal apoptosis in Tg versus WT rats (data not shown). Finally, numerous dystrophic neurites were observed by EM (Fig. 9E). Each of these indicators of neurodegeneration was age-dependent, and tracked with progressive tauopathy and cognitive impairment in Tg animals.
Figure 9.
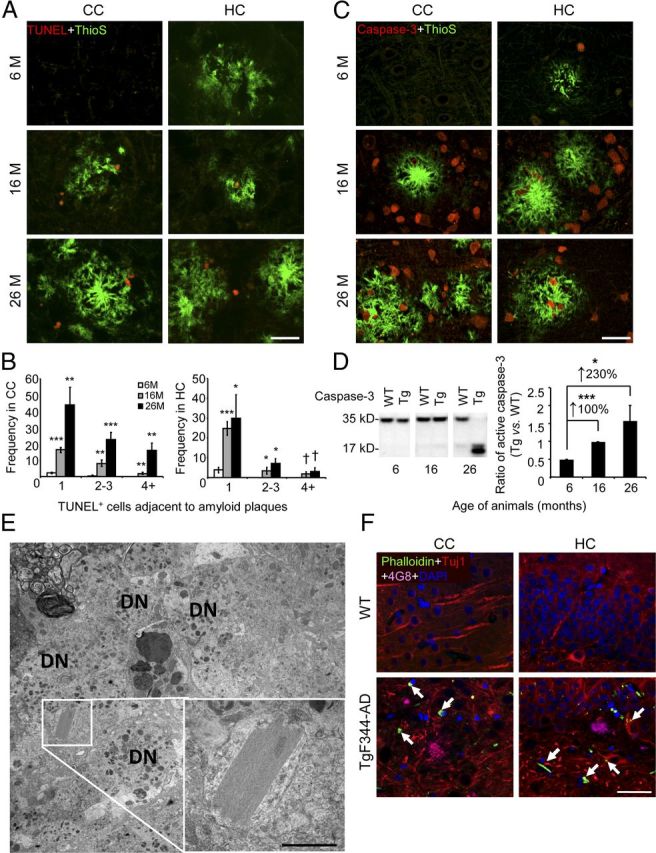
Evidence of apoptosis and neuronal distress in TgF344-AD rat brains. A, Photomicrographs are shown of TgF344-AD rat brain sections reacted with TdT-mediated TUNEL (red signal) and ThioS (green signal; scale bar, 50 μm). B, ThioS plaque-adjacent TUNEL+ cells were manually counted from CC (left) or HC (right). Bars represent the mean ± SEM of each transgenic cohort (n = 5 rats/group). C, Photomicrographs of TgF344-AD rat brain sections stained with total caspase-3 antibody and ThioS are shown (scale bar, 50 μm). D, Left, WBs for brain holo- (35 kDa band) and active (cleaved; 17 kDa band) caspase-3 are shown. Right, Densitometry is shown for ratio of active to total caspase-3 in TgF344-AD relative to WT rats. Percentage increases are indicated between age groups. Bars represent mean ratios ±SEM for each genotype (aged 6 months, n = 5; 16 months, n = 7; 26 months n = 8). E, Transmission EM reveals a Hirano body in the HC of a 16-month-old TgF344-AD rat, surrounded by dystrophic neurites (DN). The inset shows a higher magnification of the crystal lattice structure, and the scale bar denotes 500 nm. F, Photomicrographs are shown of CC and HC from a 16-month-old WT or TgF344-AD rat reacted with Phalloidin, Tuj1 antibody, 4G8 antibody, and DAPI. The arrows indicate Phalloidin-Tuj1 double positive Hirano body-like structures, and the scale bar denotes 50 μm.
Discussion
Together, our data demonstrate that TgF344-AD rats manifest a complete repertoire of AD pathological features. Therefore, expression of only two mutant human transgenes, each independent causative factors for early-onset familial AD, is sufficient to precipitate the full array of AD pathological features in the rat. We interpret these results as rodent model evidence in support of the over two-decades-old amyloid cascade hypothesis of AD (Rozemuller et al., 1989; Hardy and Allsop, 1991). Specifically, TgF344-AD rats develop age-dependent accumulation of cerebral Aβ that preempts tauopathy, cognitive disturbance, apoptosis, and neuronal loss. While Aβ-driven rodent models of AD also exhibit brain amyloidosis (Games et al., 1995; Hsiao et al., 1996; Holcomb et al., 1998; Oddo et al., 2003; Oakley et al., 2006; Lawlor et al., 2007; Liu et al., 2008; Leon et al., 2010), cerebral Aβ abundance in TgF344-AD rats (∼60 μg/wet g of brain in aged animals) is high enough to be within the clinicopathological range of the human syndrome [∼50–1000 μg/wet g of brain (Lue et al., 1999; Delacourte et al., 2002; Ingelsson et al., 2004; Steinerman et al., 2008)]. Notably, abundance of soluble oligomeric Aβ species is markedly greater in TgF344-AD rats compared with PSAPP mice harboring the same mutant human transgenes under mouse prion protein regulatory control. Furthermore, while frank NFT pathology has been found in rodent models of AD, these models rely on the presence of mutated human tau (Oddo et al., 2003; Filipcik et al., 2012), which is not causative of AD in humans. It is noteworthy that TgF344-AD rats manifest NFT pathology independent of human tau mutations, relying solely on endogenous rat tau protein. This important aspect of the model will allow for more physiologic investigation into Aβ-mediated tauopathy. Finally, neuronal loss in other rodent models of AD is either absent entirely or quantitatively minor, or only present in a limited subset of brain areas classically affected in human AD (Calhoun et al., 1998; Oddo et al., 2003; Oakley et al., 2006; Rebeck et al., 2010). By contrast, TgF344-AD rats show consistent and extensive neuronal loss in cortical and hippocampal regions to the degree that we even observe an age-dependent trend toward decreased hemispheric brain weight (data not shown) accompanied by spongiform-like vacuolar pathology.
But why do TgF344-AD rats present with the full array of AD pathology while mice expressing the same mutant human transgenes do not? The answer to this question is likely twofold (1) the magnitude and nature of cerebral amyloidosis in Tg rats and (2) a rat tau proteome that is more akin to humans than to mice. Specifically, TgF344-AD rats have progressively elevated abundance of Aβ1–40, Aβ1–42, and particularly of soluble oligomeric Aβ species that are directly neurotoxic in rats (Shankar et al., 2008). Furthermore, rats have the full complement of six tau isoforms present in humans, whereas mice only harbor three of the human tau isoforms (McMillan et al., 2008; Hanes et al., 2009). These two key factors seem to create a cerebral milieu that allows for the development of Aβ-directed tauopathy and accompanying neuronal loss. However, given the complexities inherent to comparative biology across multiple species, further study is needed to definitively answer this important question.
Several studies have established oligomeric Aβ as the principle neurotoxic species (Walsh et al., 2002a; Shankar et al., 2008), and TgF344-AD rats exhibit intraneuronal Aβ and high abundance of soluble Aβ oligomers. Strikingly, soluble oligomeric Aβ species were most strongly associated with neuronal loss in Tg rats, supporting this notion. It is also worth noting that we observe tauopathy and apoptotic cells not only in close vicinity to amyloid plaques, but also in brain areas devoid of amyloid deposits, but where putative soluble oligomeric species are likely present. That TgF344-AD rats show clear evidence of age-dependent neuronal loss is interesting given the ongoing debate surrounding mechanisms of neuronal loss in AD (Cotman and Anderson, 1995; Behl, 2000; Zhu et al., 2006; Gorman, 2008). Importantly, there have been reports in postmortem brain samples suggesting that apoptotic mechanisms may contribute to the disease. For example, Stadelmann et al. (1998) reported DNA fragmentation in AD patient brains, and observed a small population of neurons that displayed morphological characteristics of apoptosis. Apoptosis is a dynamic and short-lived process, and it is likely that endogenous brain clearance machinery actively removes dead cells and consequently reduces the detection threshold, making for a more conservative result. While TgF344-AD rats evidence neuronal apoptosis, it is distinctly possible that apoptosis is not the sole mechanism for neuronal loss in these animals or in human AD.
Similar to the findings of Su et al. (2001) in human AD patients, colocalization of pathologic tau (as indicated by CP13 or PHF1 positivity) with TUNEL+ cells in close proximity to amyloid plaques suggests temporal and spatial proximity of tauopathy and neuronal death. These observations fall in line with recent data suggesting a link among caspase-3 activation, tauopathy, and neuronal apoptosis (Ittner et al., 2010; de Calignon et al., 2010). Such findings raise the possibility that neuronal death may be consequent upon tau pathology driven by overly abundant cerebral Aβ. It is also interesting that increased phosphorylation of tau occurs as early as 6 months of age in Tg rats, when soluble Aβ is elevated, but before appreciable Aβ deposition. When taken together with histologic and behavioral observations, these results suggest that early elevation in soluble Aβ species promotes abnormal tau phosphorylation, and then continued bombardment with multiple forms of Aβ further perpetrates tauopathy and neuronal loss, culminating in cognitive impairment.
In conclusion, TgF344-AD rats manifest age-dependent cerebral amyloidosis, tauopathy, gliosis, apoptotic loss of neurons, and cognitive disturbance. Cerebral amyloidosis seems to be the driving force for tauopathy, neuronal loss, and interruption of learning and memory in this model, supporting the 20-year-old amyloid cascade hypothesis. Given that TgF344-AD rats capture the full array of AD pathology, this new model represents a critical tool for the neuroscience community to enable future studies in basic and translational AD research.
Footnotes
This work was supported in part by the NIH/NIA (5R00AG029726-03, 5R00AG029726-04, and 3R00AG029726-04S1, to T.T.) and the NIH/NINDS (1R01NS076794-01), an Investigator Initiated Research Grant (IIRG-05-14993, to T.T.) from the Alzheimer's Association, intramural funds from the NIMH (to R.C.), and an NIH/NIA grant (1R21AG033394-01, to R.C.). T.T. is a recipient of an Alzheimer's Association Zenith Fellows Award (ZEN-10-174633), an Ellison Medical Foundation/American Federation for Aging Research Mid-Career Award in Aging Research (M11472), and is the inaugural holder of the Ben Winters Endowed Chair in Regenerative Medicine. H.D. was supported by an NIH/NIA T32 training grant (AG000096). R.C. holds the Steven C. Gordon Family Foundation Chair in Memory Disorders. We thank Chad Dickey (University of South Florida), Stephen Johnson (Cedars-Sinai Medical Center), and Dominique Jodry (Cedars-Sinai Medical Center) for technical assistance and advice. We are also grateful to Jun Tan (University of South Florida) and Dennis Dickson (Mayo Clinic Jacksonville) for helpful discussion and for assistance with interpreting data. We also thank the Department of Pathology at Cedars-Sinai Medical Center for assistance with EM acquisition and interpretation.
References
- Agdeppa ED, Kepe V, Liu J, Flores-Torres S, Satyamurthy N, Petric A, Cole GM, Small GW, Huang SC, Barrio JR. Binding characteristics of radiofluorinated 6-dialkylamino-2-naphthylethylidene derivatives as positron emission tomography imaging probes for beta-amyloid plaques in Alzheimer's disease. J Neurosci. 2001;21:RC189. doi: 10.1523/JNEUROSCI.21-24-j0004.2001. [DOI] [PMC free article] [PubMed] [Google Scholar]
- Barnes CA. Memory deficits associated with senescence: a neurophysiological and behavioral study in the rat. J Comp Physiol Psychol. 1979;93:74–104. doi: 10.1037/h0077579. [DOI] [PubMed] [Google Scholar]
- Barnes CA, Jung MW, McNaughton BL, Korol DL, Andreasson K, Worley PF. LTP saturation and spatial learning disruption: effects of task variables and saturation levels. J Neurosci. 1994;14:5793–5806. doi: 10.1523/JNEUROSCI.14-10-05793.1994. [DOI] [PMC free article] [PubMed] [Google Scholar]
- Behl C. Apoptosis and Alzheimer's disease. J Neural Transm. 2000;107:1325–1344. doi: 10.1007/s007020070021. [DOI] [PubMed] [Google Scholar]
- Braak H, Braak E. Alzheimer's disease: striatal amyloid deposits and neurofibrillary changes. J Neuropathol Exp Neurol. 1990;49:215–224. doi: 10.1097/00005072-199005000-00003. [DOI] [PubMed] [Google Scholar]
- Braak H, Braak E, Bohl J, Lang W. Alzheimer's disease: amyloid plaques in the cerebellum. J Neurol Sci. 1989;93:277–287. doi: 10.1016/0022-510X(89)90197-4. [DOI] [PubMed] [Google Scholar]
- Calhoun ME, Wiederhold KH, Abramowski D, Phinney AL, Probst A, Sturchler-Pierrat C, Staufenbiel M, Sommer B, Jucker M. Neuron loss in APP transgenic mice. Nature. 1998;395:755–756. doi: 10.1038/27351. [DOI] [PubMed] [Google Scholar]
- Colton CA, Wilcock DM, Wink DA, Davis J, Van Nostrand WE, Vitek MP. The effects of NOS2 gene deletion on mice expressing mutated human AbetaPP. J Alzheimers Dis. 2008;15:571–587. doi: 10.3233/jad-2008-15405. [DOI] [PMC free article] [PubMed] [Google Scholar]
- Cotman CW, Anderson AJ. A potential role for apoptosis in neurodegeneration and Alzheimer's disease. Mol Neurobiol. 1995;10:19–45. doi: 10.1007/BF02740836. [DOI] [PubMed] [Google Scholar]
- de Calignon A, Fox LM, Pitstick R, Carlson GA, Bacskai BJ, Spires-Jones TL, Hyman BT. Caspase activation precedes and leads to tangles. Nature. 2010;464:1201–1204. doi: 10.1038/nature08890. [DOI] [PMC free article] [PubMed] [Google Scholar]
- Delacourte A, Sergeant N, Champain D, Wattez A, Maurage CA, Lebert F, Pasquier F, David JP. Nonoverlapping but synergetic tau and APP pathologies in sporadic Alzheimer's disease. Neurology. 2002;59:398–407. doi: 10.1212/WNL.59.3.398. [DOI] [PubMed] [Google Scholar]
- Dickson DW, Wertkin A, Mattiace LA, Fier E, Kress Y, Davies P, Yen SH. Ubiquitin immunoelectron microscopy of dystrophic neurites in cerebellar senile plaques of Alzheimer's disease. Acta Neuropathol. 1990;79:486–493. doi: 10.1007/BF00296107. [DOI] [PubMed] [Google Scholar]
- Duff K, Eckman C, Zehr C, Yu X, Prada CM, Pereztur J, Hutton M, Buee L, Harigaya Y, Yager D, Morgan D, Gordon MN, Holcomb L, Refolo L, Zenk B, Hardy J, Younkin S. Increased amyloid-beta-42(43) in brains of mice expressing mutant presenilin 1. Nature. 1996;383:710–713. doi: 10.1038/383710a0. [DOI] [PubMed] [Google Scholar]
- Ellis RJ, Olichney JM, Thal LJ, Mirra SS, Morris JC, Beekly D, Heyman A. Cerebral amyloid angiopathy in the brains of patients with Alzheimer's disease: the CERAD experience, Part XV. Neurology. 1996;46:1592–1596. doi: 10.1212/WNL.46.6.1592. [DOI] [PubMed] [Google Scholar]
- Filipcik P, Zilka N, Bugos O, Kucerak J, Koson P, Novak P, Novak M. First transgenic rat model developing progressive cortical neurofibrillary tangles. Neurobiol Aging. 2012;33:1448–1456. doi: 10.1016/j.neurobiolaging.2010.10.015. [DOI] [PubMed] [Google Scholar]
- Games D, Adams D, Alessandrini R, Barbour R, Berthelette P, Blackwell C, Carr T, Clemens J, Donaldson T, Gillespie F. Alzheimer-type neuropathology in transgenic mice overexpressing V717f beta-amyloid precursor protein. Nature. 1995;373:523–527. doi: 10.1038/373523a0. [DOI] [PubMed] [Google Scholar]
- Gorman AM. Neuronal cell death in neurodegenerative diseases: recurring themes around protein handling. J Cell Mol Med. 2008;12:2263–2280. doi: 10.1111/j.1582-4934.2008.00402.x. [DOI] [PMC free article] [PubMed] [Google Scholar]
- Greenberg SG, Davies P. A preparation of Alzheimer paired helical filaments that displays distinct tau proteins by polyacrylamide gel electrophoresis. Proc Natl Acad Sci U S A. 1990;87:5827–5831. doi: 10.1073/pnas.87.15.5827. [DOI] [PMC free article] [PubMed] [Google Scholar]
- Hanes J, Zilka N, Bartkova M, Caletkova M, Dobrota D, Novak M. Rat tau proteome consists of six tau isoforms: implication for animal models of human tauopathies. J Neurochem. 2009;108:1167–1176. doi: 10.1111/j.1471-4159.2009.05869.x. [DOI] [PubMed] [Google Scholar]
- Hardy J, Allsop D. Amyloid deposition as the central event in the aetiology of Alzheimer's disease. Trends Pharmacol Sci. 1991;12:383–388. doi: 10.1016/0165-6147(91)90609-V. [DOI] [PubMed] [Google Scholar]
- Holcomb L, Gordon MN, McGowan E, Yu X, Benkovic S, Jantzen P, Wright K, Saad I, Mueller R, Morgan D, Sanders S, Zehr C, O'Campo K, Hardy J, Prada CM, Eckman C, Younkin S, Hsiao K, Duff K. Accelerated Alzheimer-type phenotype in transgenic mice carrying both mutant amyloid precursor protein and presenilin 1 transgenes. Nat Med. 1998;4:97–100. doi: 10.1038/nm0198-097. [DOI] [PubMed] [Google Scholar]
- Hsiao K, Chapman P, Nilsen S, Eckman C, Harigaya Y, Younkin S, Yang F, Cole G. Correlative memory deficits, Abeta elevation, and amyloid plaques in transgenic mice. Science. 1996;274:99–102. doi: 10.1126/science.274.5284.99. [DOI] [PubMed] [Google Scholar]
- Ingelsson M, Fukumoto H, Newell KL, Growdon JH, Hedley-Whyte ET, Frosch MP, Albert MS, Hyman BT, Irizarry MC. Early Abeta accumulation and progressive synaptic loss, gliosis, and tangle formation in AD brain. Neurology. 2004;62:925–931. doi: 10.1212/01.WNL.0000115115.98960.37. [DOI] [PubMed] [Google Scholar]
- Ittner LM, Ke YD, Delerue F, Bi M, Gladbach A, van Eersel J, Wolfing H, Chieng BC, Christie MJ, Napier IA, Eckert A, Staufenbiel M, Hardeman E, Götz J. Dendritic function of tau mediates amyloid-beta toxicity in Alzheimer's disease mouse models. Cell. 2010;142:387–397. doi: 10.1016/j.cell.2010.06.036. [DOI] [PubMed] [Google Scholar]
- Jankowsky JL, Slunt HH, Ratovitski T, Jenkins NA, Copeland NG, Borchelt DR. Co-expression of multiple transgenes in mouse CNS: a comparison of strategies. Biomol Eng. 2001;17:157–165. doi: 10.1016/S1389-0344(01)00067-3. [DOI] [PubMed] [Google Scholar]
- Joachim CL, Morris JH, Selkoe DJ. Diffuse senile plaques occur commonly in the cerebellum in Alzheimer's disease. Am J Pathol. 1989;135:309–319. [PMC free article] [PubMed] [Google Scholar]
- Johnson-Wood K, Lee M, Motter R, Hu K, Gordon G, Barbour R, Khan K, Gordon M, Tan H, Games D, Lieberburg I, Schenk D, Seubert P, McConlogue L. Amyloid precursor protein processing and a-beta(42) deposition in a transgenic mouse model of Alzheimer disease. Proc Natl Acad Sci U S A. 1997;94:1550–1555. doi: 10.1073/pnas.94.4.1550. [DOI] [PMC free article] [PubMed] [Google Scholar]
- Kayed R, Glabe CG. Conformation-dependent anti-amyloid oligomer antibodies. Methods Enzymol. 2006;413:326–344. doi: 10.1016/S0076-6879(06)13017-7. [DOI] [PubMed] [Google Scholar]
- Kayed R, Head E, Thompson JL, McIntire TM, Milton SC, Cotman CW, Glabe CG. Common structure of soluble amyloid oligomers implies common mechanism of pathogenesis. Science. 2003;300:486–489. doi: 10.1126/science.1079469. [DOI] [PubMed] [Google Scholar]
- Lamy C, Duyckaerts C, Delaere P, Payan C, Fermanian J, Poulain V, Hauw JJ. Comparison of seven staining methods for senile plaques and neurofibrillary tangles in a prospective series of 15 elderly patients. Neuropathol Appl Neurobiol. 1989;15:563–578. doi: 10.1111/j.1365-2990.1989.tb01255.x. [DOI] [PubMed] [Google Scholar]
- Lawlor PA, Bland RJ, Das P, Price RW, Holloway V, Smithson L, Dicker BL, During MJ, Young D, Golde TE. Novel rat Alzheimer's disease models based on AAV-mediated gene transfer to selectively increase hippocampal Abeta levels. Mol Neurodegener. 2007;2:11. doi: 10.1186/1750-1326-2-11. [DOI] [PMC free article] [PubMed] [Google Scholar]
- Leon WC, Canneva F, Partridge V, Allard S, Ferretti MT, DeWilde A, Vercauteren F, Atifeh R, Ducatenzeiler A, Klein W, Szyf M, Alhonen L, Cuello AC. A novel transgenic rat model with a full Alzheimer's-like amyloid pathology displays pre-plaque intracellular amyloid-beta-associated cognitive impairment. J Alzheimers Dis. 2010;20:113–126. doi: 10.3233/JAD-2010-1349. [DOI] [PubMed] [Google Scholar]
- Liu L, Orozco IJ, Planel E, Wen Y, Bretteville A, Krishnamurthy P, Wang L, Herman M, Figueroa H, Yu WH, Arancio O, Duff K. A transgenic rat that develops Alzheimer's disease-like amyloid pathology, deficits in synaptic plasticity and cognitive impairment. Neurobiol Dis. 2008;31:46–57. doi: 10.1016/j.nbd.2008.03.005. [DOI] [PMC free article] [PubMed] [Google Scholar]
- Lue LF, Kuo YM, Roher AE, Brachova L, Shen Y, Sue L, Beach T, Kurth JH, Rydel RE, Rogers J. Soluble amyloid beta peptide concentration as a predictor of synaptic change in Alzheimer's disease. Am J Pathol. 1999;155:853–862. doi: 10.1016/S0002-9440(10)65184-X. [DOI] [PMC free article] [PubMed] [Google Scholar]
- McMillan P, Korvatska E, Poorkaj P, Evstafjeva Z, Robinson L, Greenup L, Leverenz J, Schellenberg GD, D'Souza I. Tau isoform regulation is region- and cell-specific in mouse brain. J Comp Neurol. 2008;511:788–803. doi: 10.1002/cne.21867. [DOI] [PMC free article] [PubMed] [Google Scholar]
- Mucke L, Masliah E, Yu GQ, Mallory M, Rockenstein EM, Tatsuno G, Hu K, Kholodenko D, Johnson-Wood K, McConlogue L. High-level neuronal expression of Abeta 1–42 in wild-type human amyloid protein precursor transgenic mice: synaptotoxicity without plaque formation. J Neurosci. 2000;20:4050–4058. doi: 10.1523/JNEUROSCI.20-11-04050.2000. [DOI] [PMC free article] [PubMed] [Google Scholar]
- Necula M, Breydo L, Milton S, Kayed R, van der Veer WE, Tone P, Glabe CG. Methylene blue inhibits amyloid Abeta oligomerization by promoting fibrillization. Biochemistry. 2007;46:8850–8860. doi: 10.1021/bi700411k. [DOI] [PubMed] [Google Scholar]
- Oakley H, Cole SL, Logan S, Maus E, Shao P, Craft J, Guillozet-Bongaarts A, Ohno M, Disterhoft J, Van Eldik L, Berry R, Vassar R. Intraneuronal beta-amyloid aggregates, neurodegeneration, and neuron loss in transgenic mice with five familial Alzheimer's disease mutations: potential factors in amyloid plaque formation. J Neurosci. 2006;26:10129–10140. doi: 10.1523/JNEUROSCI.1202-06.2006. [DOI] [PMC free article] [PubMed] [Google Scholar]
- Oddo S, Caccamo A, Shepherd JD, Murphy MP, Golde TE, Kayed R, Metherate R, Mattson MP, Akbari Y, LaFerla FM. Triple-transgenic model of Alzheimer's disease with plaques and tangles: intracellular Abeta and synaptic dysfunction. Neuron. 2003;39:409–421. doi: 10.1016/S0896-6273(03)00434-3. [DOI] [PubMed] [Google Scholar]
- Padmanabhan J, Levy M, Dickson DW, Potter H. Alpha1-antichymotrypsin, an inflammatory protein overexpressed in Alzheimer's disease brain, induces tau phosphorylation in neurons. Brain. 2006;129:3020–3034. doi: 10.1093/brain/awl255. [DOI] [PubMed] [Google Scholar]
- Paxinos G, Watson C. The rat brain in stereotaxic coordinates. San Diego: Academic; 2005. [DOI] [PubMed] [Google Scholar]
- Rebeck GW, Hoe HS, Moussa CE. Beta-amyloid1–42 gene transfer model exhibits intraneuronal amyloid, gliosis, tau phosphorylation, and neuronal loss. J Biol Chem. 2010;285:7440–7446. doi: 10.1074/jbc.M109.083915. [DOI] [PMC free article] [PubMed] [Google Scholar]
- Rosenwald A, Reusche E, Ogomori K, Teichert HM. Comparison of silver stainings and immunohistology for the detection of neurofibrillary tangles and extracellular cerebral amyloid in paraffin sections. Acta Neuropathol. 1993;86:182–186. doi: 10.1007/BF00334887. [DOI] [PubMed] [Google Scholar]
- Rozemuller JM, Eikelenboom P, Stam FC, Beyreuther K, Masters CL. A4 protein in Alzheimer's disease: primary and secondary cellular events in extracellular amyloid deposition. J Neuropathol Exp Neurol. 1989;48:674–691. doi: 10.1097/00005072-198911000-00009. [DOI] [PubMed] [Google Scholar]
- Selkoe DJ. Alzheimer's disease: genes, proteins, and therapy. Physiol Rev. 2001;81:741–766. doi: 10.1152/physrev.2001.81.2.741. [DOI] [PubMed] [Google Scholar]
- Shankar GM, Li S, Mehta TH, Garcia-Munoz A, Shepardson NE, Smith I, Brett FM, Farrell MA, Rowan MJ, Lemere CA, Regan CM, Walsh DM, Sabatini BL, Selkoe DJ. Amyloid-beta protein dimers isolated directly from Alzheimer's brains impair synaptic plasticity and memory. Nat Med. 2008;14:837–842. doi: 10.1038/nm1782. [DOI] [PMC free article] [PubMed] [Google Scholar]
- Small GW, Kepe V, Ercoli LM, Siddarth P, Bookheimer SY, Miller KJ, Lavretsky H, Burggren AC, Cole GM, Vinters HV, Thompson PM, Huang SC, Satyamurthy N, Phelps ME, Barrio JR. PET of brain amyloid and tau in mild cognitive impairment. N Engl J Med. 2006;355:2652–2663. doi: 10.1056/NEJMoa054625. [DOI] [PubMed] [Google Scholar]
- Stadelmann C, Brück W, Bancher C, Jellinger K, Lassmann H. Alzheimer disease: DNA fragmentation indicates increased neuronal vulnerability, but not apoptosis. J Neuropathol Exp Neurol. 1998;57:456–464. doi: 10.1097/00005072-199805000-00009. [DOI] [PubMed] [Google Scholar]
- Steinerman JR, Irizarry M, Scarmeas N, Raju S, Brandt J, Albert M, Blacker D, Hyman B, Stern Y. Distinct pools of beta-amyloid in Alzheimer disease-affected brain: a clinicopathologic study. Arch Neurol. 2008;65:906–912. doi: 10.1001/archneur.65.7.906. [DOI] [PMC free article] [PubMed] [Google Scholar]
- Sturchler-Pierrat C, Abramowski D, Duke M, Wiederhold KH, Mistl C, Rothacher S, Ledermann B, Burki K, Frey P, Paganetti PA, Bürki K, Frey P, Paganetti PA, Waridel C, Calhoun ME, Jucker M, Probst A, Staufenbiel M, Sommer B. Two amyloid precursor protein transgenic mouse models with Alzheimer disease-like pathology. Proc Natl Acad Sci U S A. 1997;94:13287–13292. doi: 10.1073/pnas.94.24.13287. [DOI] [PMC free article] [PubMed] [Google Scholar]
- Su JH, Zhao M, Anderson AJ, Srinivasan A, Cotman CW. Activated caspase-3 expression in Alzheimer's and aged control brain: correlation with Alzheimer pathology. Brain Res. 2001;898:350–357. doi: 10.1016/S0006-8993(01)02018-2. [DOI] [PubMed] [Google Scholar]
- Tan J, Town T, Paris D, Mori T, Suo Z, Crawford F, Mattson MP, Flavell RA, Mullan M. Microglial activation resulting from CD40-CD40L interaction after beta-amyloid stimulation. Science. 1999;286:2352–2355. doi: 10.1126/science.286.5448.2352. [DOI] [PubMed] [Google Scholar]
- Tan J, Town T, Crawford F, Mori T, DelleDonne A, Crescentini R, Obregon D, Flavell RA, Mullan MJ. Role of CD40 ligand in amyloidosis in transgenic Alzheimer's mice. Nat Neurosci. 2002;5:1288–1293. doi: 10.1038/nn968. [DOI] [PubMed] [Google Scholar]
- Town T, Laouar Y, Pittenger C, Mori T, Szekely CA, Tan J, Duman RS, Flavell RA. Blocking TGF-beta-Smad2/3 innate immune signaling mitigates Alzheimer-like pathology. Nat Med. 2008;14:681–687. doi: 10.1038/nm1781. [DOI] [PMC free article] [PubMed] [Google Scholar]
- Walsh DM, Tseng BP, Rydel RE, Podlisny MB, Selkoe DJ. The oligomerization of amyloid beta-protein begins intracellularly in cells derived from human brain. Biochemistry. 2000;39:10831–10839. doi: 10.1021/bi001048s. [DOI] [PubMed] [Google Scholar]
- Walsh DM, Klyubin I, Fadeeva JV, Cullen WK, Anwyl R, Wolfe MS, Rowan MJ, Selkoe DJ. Naturally secreted oligomers of amyloid beta protein potently inhibit hippocampal long-term potentiation in vivo. Nature. 2002a;416:535–539. doi: 10.1038/416535a. [DOI] [PubMed] [Google Scholar]
- Walsh DM, Klyubin I, Fadeeva JV, Rowan MJ, Selkoe DJ. Amyloid-beta oligomers: their production, toxicity and therapeutic inhibition. Biochem Soc Trans. 2002b;30:552–557. doi: 10.1042/bst0300552. [DOI] [PubMed] [Google Scholar]
- Wan H, Aggleton JP, Brown MW. Different contributions of the hippocampus and perirhinal cortex to recognition memory. J Neurosci. 1999;19:1142–1148. doi: 10.1523/JNEUROSCI.19-03-01142.1999. [DOI] [PMC free article] [PubMed] [Google Scholar]
- Wilcock DM, Lewis MR, Van Nostrand WE, Davis J, Previti ML, Gharkholonarehe N, Vitek MP, Colton CA. Progression of amyloid pathology to Alzheimer's disease pathology in an amyloid precursor protein transgenic mouse model by removal of nitric oxide synthase 2. J Neurosci. 2008;28:1537–1545. doi: 10.1523/JNEUROSCI.5066-07.2008. [DOI] [PMC free article] [PubMed] [Google Scholar]
- Wyss-Coray T, Masliah E, Mallory M, McConlogue L, Johnson-Wood K, Lin C, Mucke L. Amyloidogenic role of cytokine TGF-beta1 in transgenic mice and in Alzheimer's disease. Nature. 1997;389:603–606. doi: 10.1038/39321. [DOI] [PubMed] [Google Scholar]
- Wyss-Coray T, Lin C, Yan F, Yu GQ, Rohde M, McConlogue L, Masliah E, Mucke L. TGF-beta1 promotes microglial amyloid-beta clearance and reduces plaque burden in transgenic mice. Nat Med. 2001;7:612–618. doi: 10.1038/87945. [DOI] [PubMed] [Google Scholar]
- Yang S, Smit AF, Schwartz S, Chiaromonte F, Roskin KM, Haussler D, Miller W, Hardison RC. Patterns of insertions and their covariation with substitutions in the rat, mouse, and human genomes. Genome Res. 2004;14:517–527. doi: 10.1101/gr.1984404. [DOI] [PMC free article] [PubMed] [Google Scholar]
- Yoshiike Y, Minai R, Matsuo Y, Chen YR, Kimura T, Takashima A. Amyloid oligomer conformation in a group of natively folded proteins. PLoS One. 2008;3:e3235. doi: 10.1371/journal.pone.0003235. [DOI] [PMC free article] [PubMed] [Google Scholar]
- Zhu X, Raina AK, Perry G, Smith MA. Apoptosis in Alzheimer disease: a mathematical improbability. Curr Alzheimer Res. 2006;3:393–396. doi: 10.2174/156720506778249470. [DOI] [PubMed] [Google Scholar]