Abstract
Noncovalent interactions play a central role in many chemical and biological systems. In a previous study, Johnson et al developed a NonCovalent Interaction (NCI) index to characterize and visualize different types of weak interactions. To apply the NCI analysis to fluctuating environments as in solution phase, we here develop a new Averaged NonCovalent Interaction (i.e., aNCI) index along with a fluctuation index to characterize magnitude of interactions and fluctuations. We applied aNCI for various systems including solute-solvent and ligand-protein noncovalent interactions. For water and benzene molecules in aqueous solution, solvation structures and the specific hydrogen bond patterns were visualized clearly. For the Cl−+CH3Cl SN2 reaction in aqueous solution, charge reorganization influences over solvation structure along SN2 reaction were revealed. For ligand-protein systems, aNCI can recover several key fluctuating hydrogen bond patterns that have potential applications for drug design. Therefore, aNCI, as a complementary approach to the original NCI method, can extract and visualize noncovalent interactions from thermal noise in fluctuating environments.
Keywords: noncovalent interaction, fluctuating environment, solvation structure, ligand-protein binding, hydrogen bond
1. Introduction
Noncovalent interactions play a predominant role in chemistry and biochemistry1,2. For instance, such interactions are the driving force to fold3 and stabilize protein structures4, to coil the DNA into double helix and to self-assemble molecules5. In our previous studies6,7 a novel NonCovalent Interaction (NCI) index was proposed to characterize NCI and estimate their strength. This index is a valuable tool to study weak interaction within biological systems8,9. Using a promolecular10,11 density, NCI can characterize large systems with low computational cost and with insightful results. NCI was also applied to metal complexes12,13 and visualized binding modes of the cations. Influence of noncovalent interactions on the reaction mechanism was also investigated in several studies8,14 using the NCI analysis. For instance, Gillet et al.15 showed that an interpretative analysis crossing Electron Localization Function (ELF) and NCI results could allow following every step of a reaction mechanism to reveal reaction details. Finally Contreras et al.7 linked NCI index with the interaction energy for the specific case of hydrogen bonding. In this study they proposed a scheme to integrate the density on the NCI surfaces and showed that using this approach, the NCI integrated density could give accurate estimation of the interaction energy. This study made a first quantitative link between NCI analysis and interaction energy.
One limitation of the NCI analysis is that the noncovalent interactions are characterized based on one single structure. However, geometric fluctuations are constantly present in practical molecular systems. For example, in solutions, the positions of solvent molecules fluctuate and the solvent molecules change between solvation shells, which play important roles in solvation and chemical reactions. As such, the application of the NCI index for fluctuating systems is still unclear. In this work, we develop an averaged NonCovalent Interaction index (aNCI), which uses an ensemble of the structures, to overcome this problem.
This paper is organized as follows: In the next section, we briefly review the NCI analysis and introduced the aNCI analysis. We also explain how aNCI can be readily combined with classical or QM/MM simulations such as the QM/MM-MFEP (Quantum Mechanics/Molecular Mechanics Minimum Free-Energy Path16,17) method. In section 3, we provide the details of simulations and model systems. In section 4, we elucidate how to choose between different averaged reduced density gradient definitions. Then, using the aNCI index and fluctuation index, we scrutinize three cases, including solvation structures, an SN2 reaction, and ligand-protein binding environments. We demonstrate the strength and robustness of aNCI analysis to characterize noncovalent interactions in fluctuating systems. Finally, we conclude our works in section 5.
2. Theoretical Method
2.1 Brief review of NCI analysis
To reveal the weak interactions, Johnson et al6 constructed the NCI index based on the study of reduced density gradient (RDG or s) as a function of electron density ρ(r):
| (1) |
By plotting RDG with respect to electron density, noncovalent interaction regions can be identified when the RDG approaches to zero. The spikes which appear in the 2D plot are associated with interaction of critical points (ICP). These ICP regions with both low density and gradient of the density can be visualized in three-dimension (3D) grid space, which reveals where noncovalent interactions occurs. Moreover, based on the analysis of sign(λ2) (with λ2, the second eigenvalue of the density hessian matrix ∂ρ(r)/∂xi∂xj, with i, j = 1, 2, 3, and xi represent one Cartesian direction), attractive (negative sign) and repulsive (positive sign) interaction regions can be identified (as previously exposed6). As such, with visualization tools, such as VMD18, the interaction regions in 3D space can be visualized and colored depending on effective density (sign(λ2) ρ(r)). The following color codes are employed to distinguish interaction types in NCI:
Blue for the highly attractive interactions (such as hydrogen bonds);
Green for the weak interactions (such as dispersive-like van der Waals);
Red for repulsive interactions (such as steric clashes).
2.2 The aNCI analysis
The above NCI analysis has been useful to study weak interactions within static structures. However, in order to analyze noncovalent interactions in thermally fluctuating systems, for instance, trajectories generated from molecular dynamics simulations, a new definition of NCI index is required. Here, we consider two possible definitions of averaging reduced density gradient (aRDG):
- Definition a): using averaged density and averaged density gradient , one can define:
(2) - Definition b): using RDG of each single structure, one can define:
(3)
We will scrutinize both definitions in Section 4.1.1.
To illustrate how thermal motions can affect the weak interactions, we define the thermal fluctuation index as
| (4) |
where ρi(r) is the electron density from structure i.
The color codes for fluctuation index f are:
Blue for highly stable interactions, which can be barely affected by thermal motions;
Red for flexible interactions, which can be easily distorted by thermal motions;
Green for fluctuations between blue and red types.
2.3 aNCI combined with QM/MM MFEP simulations
In principle, one can use Eq. (2) and (4) to carry out the aNCI analysis for any systems with thermal motions. However, some technical problems can make aNCI unfeasible. For instance, all the structures generated by molecular dynamics simulations are required to be aligned based on some criteria such as the minimization of root mean square deviations. This alignment process can cause artificial bias in the aNCI analysis. Hence, we partition the entire system into the subsystem (that is the targeting region analyzed by aNCI, such as solute in solution) and the environment (that is the surrounding regions of the subsystem, such as solvent). The subsystem structure is fixed at an optimized structure in the aNCI analysis while the environment fluctuates. Therefore, the aNCI analysis needs a representative subsystem structure and an ensemble of structures for fluctuating environment.
Since aNCI is an analysis technique based on given system conformations, it is possible to interface the aNCI analysis with any classical or QM/MM simulation methods. In this work, we incorporate the recently-developed quantum mechanics/molecular mechanics minimum free energy path (QM/MM-MFEP) optimization technique into the aNCI analysis. QM/MM-MFEP has been applied to solvation reactions and enzyme systems8,17,19,20–22. In QM/MM-MFEP, the subsystem is described by QM while the environment is simulated by classical force fields. The QM/MM-MFEP optimized structure of the subsystem is ensemble-averaged since the subsystem region is optimized over the potential of mean force surface, which is defined by,
where E(rQM, rMM) is the total energy of the entire system expressed as a function of the Cartesian coordinates of the QM and MM subsystems. The QM/MM interaction energy in E(rQM, rMM) includes the electrostatic interactions from classical point charges and van der Waals (vdW) interactions between QM and MM subsystems. The integration of QM/MM MFEP into the aNCI analysis is efficient and intuitive. The aNCI analysis can also be combined with any type of molecular dynamics simulation. One just needs to fix the solute molecules at an optimized geometry and carry out the molecular dynamics simulation with the solvent molecules.
3. Computational details
We carried out the aNCI analysis on systems that are summarized in Table I, including single molecule solvation, SN2 reaction in water, and ligand-protein binding systems. In QM/MM simulations, the subsystem was treated as quantum mechanics at a B3LYP/6-31+G* level23. CHARMM22 force field24 and TIP3P water model25 were employed for environments. The protein systems were prepared with MolProbity26. Each system was optimized by QM/MM-MFEP with a 640 ps simulation. The 320 ps simulations then were performed to generate the snapshots for the aNCI analysis. 1000 snapshots were generated for each system.
Table I.
Model systems for aNCI analysis.
| Solute-solvent system |
SN2 reaction in solvent | Ligand-protein system | ||||
|---|---|---|---|---|---|---|
| subsystem | H2O | Benzene | Reactant state | Transition state | BIIB021 | VHD |
| environment | Water | Water | Water | Water | Protein, water | Protein, water |
| Cubic box length | 40 | 40 | 50 | 50 | 70 | 70 |
The aNCI analysis was carried out with modified version of NCIPLOT software12. To reduce the computational cost, the promolecular density6 from atoms within a 15 Å radius cutoff of subsystem were chosen to compute the indices using Eq. (2) and (4). The cube grids, with a 0.05 (if not further mentioned) Å step size along x, y, and z directions, were generated with 3.0 Å buffer regions from the subsystem. In the 3D visualization process with VMD, the threshold for RDG/aRDG was 0.25, and the color scale was [−2, 2], [0, 1.5] for aNCI analysis and fluctuation index, respectively.
4. Results and discussions
4.1 A benchmark study: one water molecule in water
4.1.1 The aRDG definition: vs. 〈s(r)〉
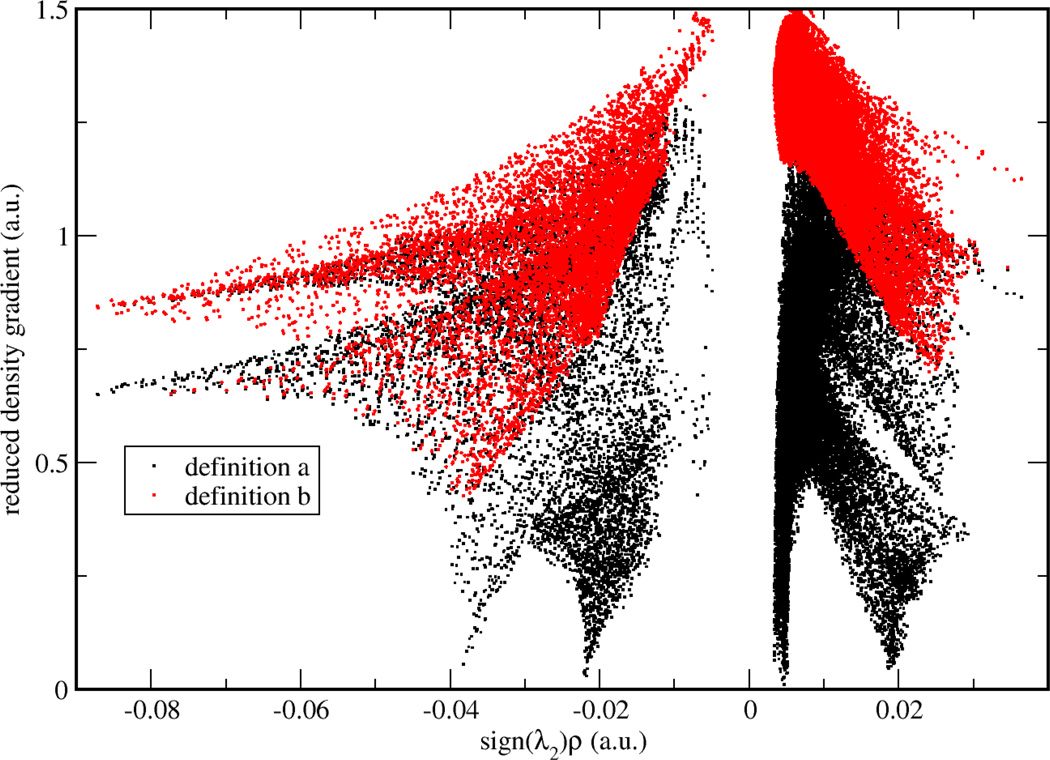
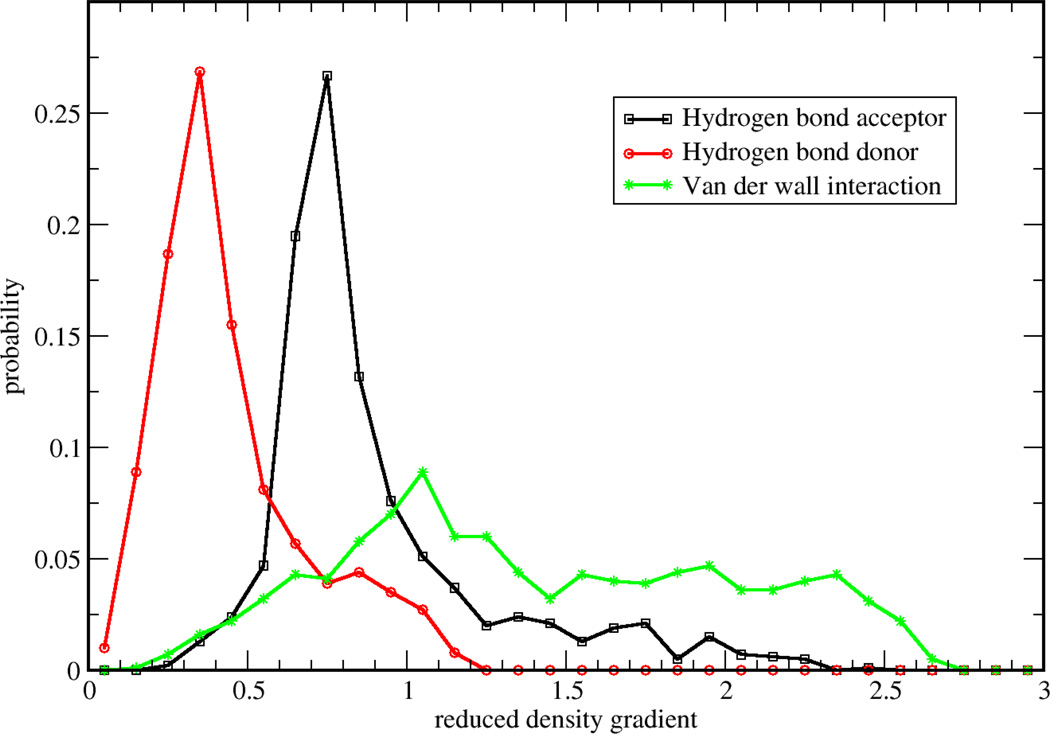
To validate two possible definitions for aNCI, we used promolecular density to characterize the noncovalent interactions of one water molecule in water. As shown in Figure 1, , defined in Eq. (2) approaches zero at small density regions and the spikes can be clearly identified. In contrast, the 〈s(r)〉, defined in Eq. (3) does not have (close) zero RDG regions and only two spikes can be observed. According to the original NCI paper6, such spikes represent noncovalent interaction regions. These indicate the microscopic details of interactions are lost in 〈s(r)〉. This phenomenon can be further explained by a detailed analysis over the RDG distribution. Three 3D grids, located at three ICPs (with effective density as −0.04, −0.02, and 0.005, which will be observed later to correspond with hydrogen bond donor, hydrogen bond acceptor, and vdW regions, respectively) under definition were selected. For each grid, 1000 RDG values were calculated from each snapshot and their distributions were shown in Figure 2. Some interactions were blurred by the broad RDG distribution, although these interactions do exist under averaged density and gradient sense. This suggests that large thermal fluctuations of unstable interactions can bury the useful information of aNCI in 〈s(r)〉. Therefore, we chose the definition for our aNCI analysis.
Figure 1.
RDG vs. effective density plot under different RDG definitions
Figure 2.
Monitored RDG probability distribution for selected points from three regions: 1) hydrogen bond acceptor, 2) hydrogen bond donor and 3) van der Waals interaction region
4.1.2 Electron density: ab initio vs. promolecular
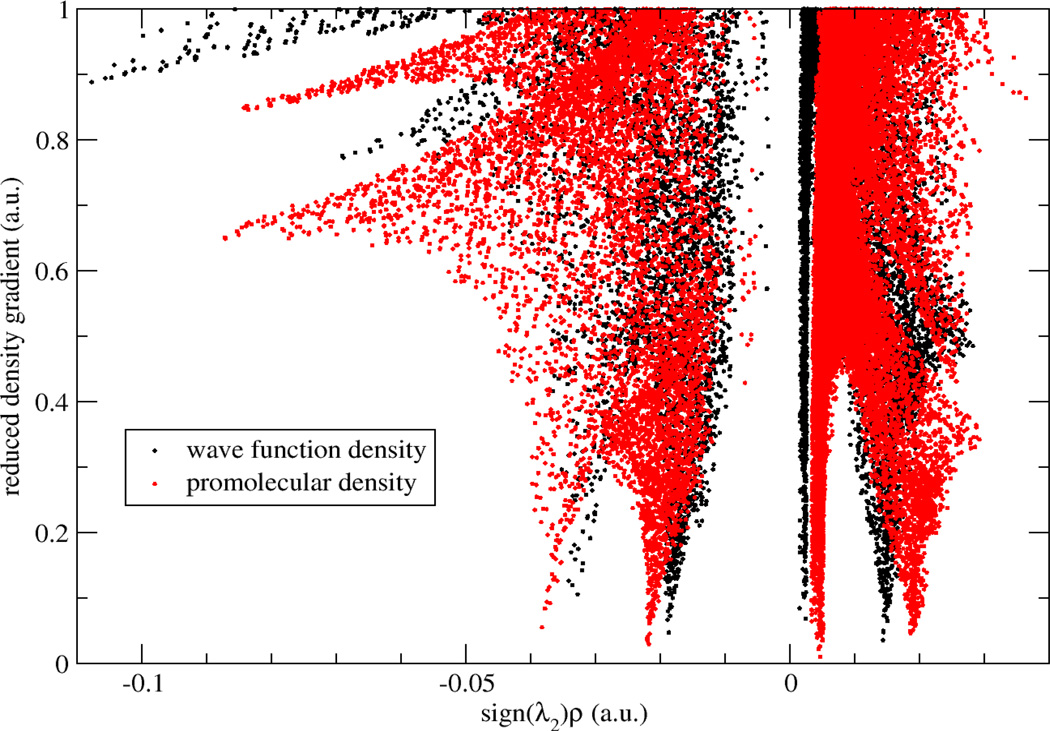
To examine how promolecular and ab initio electron densities affect the aNCI analysis, we compared the computed RDGs using both electron densities. The ab initio density is constructed using density functional theory calculations with B3LYP/6-31G* basis set over a small rectangle water box (around 200 atoms) with 5.0 Å buffer zone to the QM water molecule for each snapshot. As shown in Fig. 3, two aRDG plots (black and red dots) against effective density are similar in terms of overall shapes. Furthermore, the absolute electron density at critical points is slightly smaller in ab initio calculations (0.032 and 0.019) than promolecular results (0.039 and 0.021). Therefore, promolecular density is qualitatively accurate to perform the aNCI analysis, which is also confirmed in previous single snapshot NCI analysis.
Figure 3.
RDG vs. effective density plot for a water molecule in water with promolecular density and wave function density
4.2 Case I: solute-solvent systems
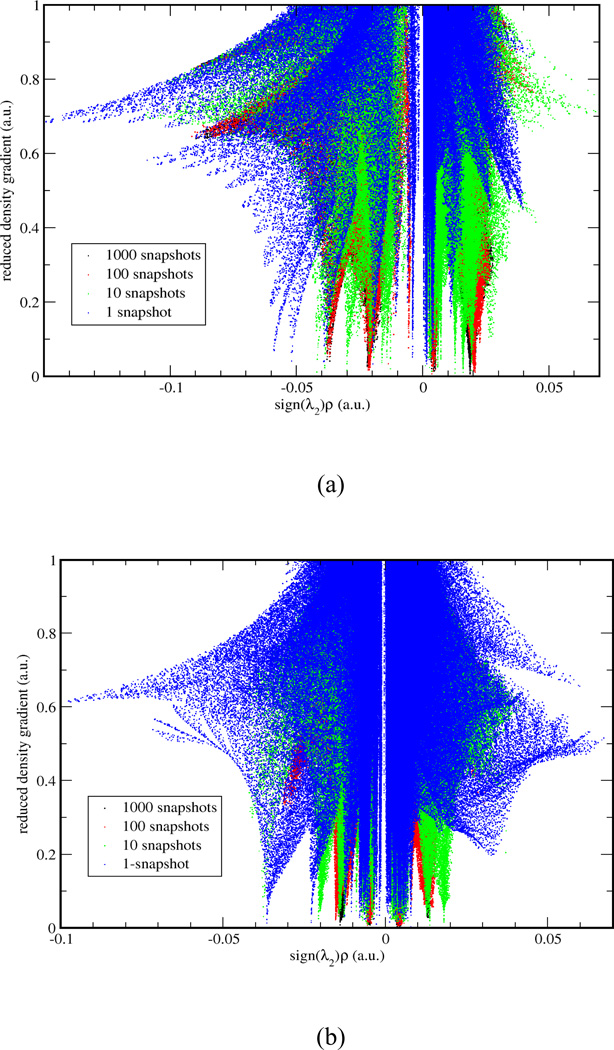
In Case I, we applied the aNCI analysis to two systems: water in water and benzene in water, which represent prototypical examples of highly fluctuating systems. While the normal NCI analysis shows information about time dependent noncovalent information and so doesn't reveal solvation interactions (see Fig. 5). does. Figure 4 illustrates the evolution of the aRDG as a function of the number of snapshot, 1000 snapshots can achieve the converged aRDG at low-density regions in terms of number and positions of spikes. In the water-water system (Figure 4-a), the effective density value at the most negative ICP is −0.06 with 1 snapshot, −0.04 with 10 snapshots, and is converged with −0.038 under 100 and 1000 snapshots. In benzene-water system, the effective value at the most negative ICP increase from −0.038 with 1 snapshot to −0.014 with 1000 snapshots. These modifications of ICP’s effective density indicate that the use of an ensemble of structures influence the interaction strength. For example, the actual hydrogen bonding would not be as strong as it can be in a single snapshot because fluctuations exist. More importantly, the visualized aNCI pictures can reveal the microscopic solvation structures as shown in Figure 5 for water-water and benzene-water system, respectively.
Figure 5.
Interactions of water-water and benzene-water system under: 1 snapshots NCI analysis in (a) and (c), 1000 snapshots aNCI analysis in (b) and (d)
Figure 4.
In (a) water-water system and (b) benzene-water system, RDG vs. effective density plot for 1, 10, 100, 1000 snapshots are shown in blue, green, red and black, respectively
Figures 5-a) and 5-c) represent the single snapshot NCI analysis for both systems. In the NCI analysis, an increased number of weak interactions are observed which results in a nonsymmetrical geometry for the ICP’s and in a concealment of the important interactions. They all are averaged out in aNCI calculations. Therefore, in aNCI, the main (or important) interactions are clearly visualized (as shown in Figure 5-b) and 5-d)): water-water hydrogen bond and benzene-water π-hydrogen bond. These comparisons explicitly show that aNCI is required in fluctuating environment. The detailed interactions of both systems are discussed below.
Water-water interactions
Many studies on water structures have been carried out27,28. In ideal condition, water molecules interact with each other through two hydrogen atoms as hydrogen bond donors and oxygen atom as hydrogen bond acceptor. The solute oxygen atom interacts with two other hydrogen atoms from other waters and a tetrahedral hydrogen bond pattern is formed. Both hydrogen bond donors/acceptors should have the same interaction strength due to its symmetry. The aNCI analysis results, which position the four hydrogen bond ICPs under tetrahedral shape, are consistent with the experimental symmetry. In addition, the hydrogen bond donor is observed to have larger effective density (−0.037) than the hydrogen bond acceptor (−0.021), with the negative sign indicating that both regions are attractive interactions between subsystem and environment. When hydrogen bond network forms, environment water hydrogen atoms can interact with subsystem water oxygen atom from any direction, and this fluctuation is reflected on the decreased density value. As pointed out by Kumar et al29, the average hydrogen bond number per water molecule in liquid state is 3.2 ~ 3.6 (less than 4), this corresponds to the strength decrease of the two hydrogen bond acceptors in our analysis. The aNCI picture is also similar with a spatial position function in the water-water environment as described in Ref. 30. This demonstrates the advantages of aNCI in revealing the spatial distribution, the interaction type and strength.
Benzene-water interaction
The benzene-water system has also been studied previously31,32. After the interesting π-hydrogen bonding31,32 was proposed, many theoretical and experimental studies33–39 have been carried out. The π-hydrogen bonding was found to be at both sides of benzene ring, and the benzene molecule was shown to act as a hydrogen bond acceptor. The interaction strength was much smaller and flexible than a water-water hydrogen bond networks. The π-hydrogen bond was also found to be highly unstable in nature. In the aNCI analysis, the π-hydrogen bond structure of benzene in 3D space appears clearly for the first time. The overlap between repulsive (effective density 0.013) and attractive (effective density −0.014) contributions have similar nature as the solute water oxygen atom (hydrogen bond acceptor): since the π-hydrogen bonding region is fairly broad, steric clash contributes to the positive effective density value.
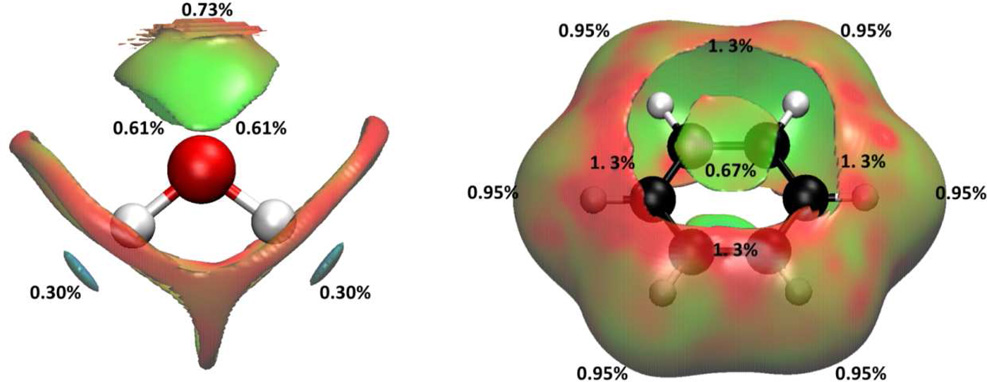
The fluctuation indexes of both systems were depicted in Figure 6. For water-water system, the lowest fluctuations are encountered around the hydrogen bond donor interaction region (0.30 %). Therefore, these interactions are mostly stable compared to the hydrogen bond acceptor ones (0.61 %). Finally, the vdW interactions appear to be the most flexible ones (~1.2 %). For benzene-water system, the relative stability of interactions follows: π-hydrogen bonding (0.67%) > benzene planar vdW interaction (0.95%) > close to π-hydrogen bonding vdW interactions (1.3%). In these cases, the stronger the interaction is, the smaller the fluctuations are. It is also obvious that the π-hydrogen bonding is more flexible than all the polar interactions in water-water system, which is consistent with the experimental observations40,41. The fluctuation index is demonstrated to be physical and could be used to analyze the rigidity of different interactions.
Figure 6.
Fluctuations index visualization of water-water and benzene-water system
4.3 Case II: solvation structures during SN2 reaction
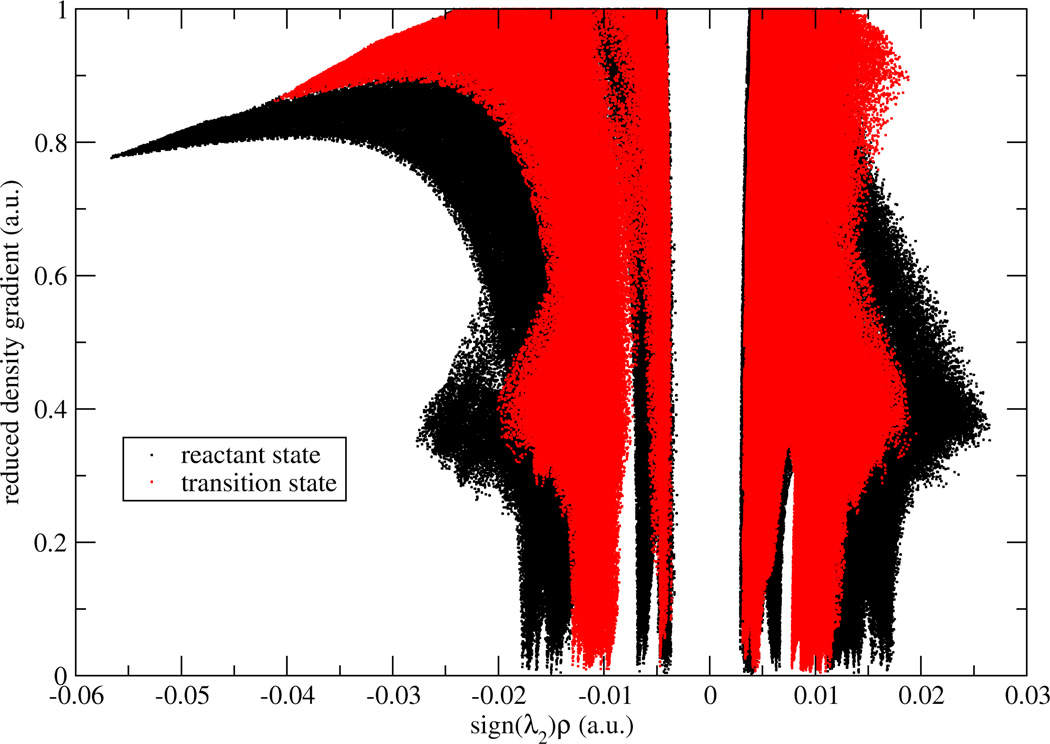
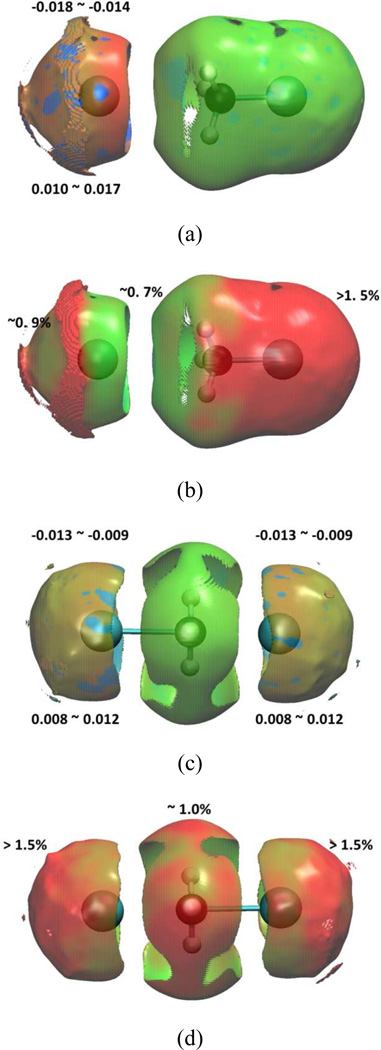
In this case, the aNCI analysis is used to analyze the solvation effect through simple SN2 reaction of Cl− + CH3Cl -> CH3Cl + Cl−. The transition state is taken from a reaction path generated using QM/MM-MFEP, and the reactant state is fully optimized. In Figure 7, the aRDG vs. effective density is plotted for both reactant and transition states. The aNCI interactions and its fluctuation index between the subsystem and environment were visualized in Figure 8.
Figure 7.
RDG vs. effective density plot in Cl− + CH3Cl SN2 reaction: reactant state (black) and transition state (red).
Figure 8.
Reactant and transition state of Cl− + CH3Cl SN2 reaction in water under: reactant state (a) 1000 snapshots aNCI analysis (b) fluctuations index, and transition state (c) 1000 snapshots aNCI analysis (d) fluctuations index.
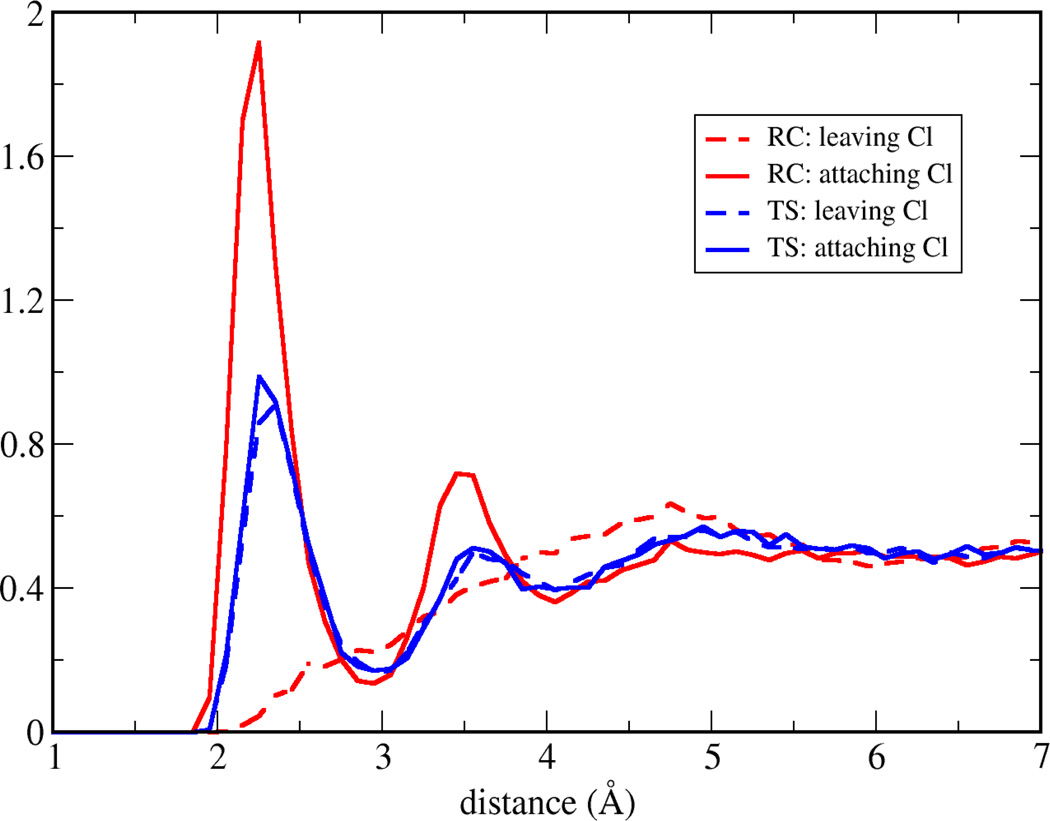
In Figure 7, along the nucleophile attack towards to the transition state, the spikes are getting narrower and the density of the strongest interactions (both repulsive and attractive) decreases. Both effects may be caused by a rearrangement of the electron density (and therefore the atomic charges) within the subsystem. Indeed, in the reactant state, the charge of the attaching/leaving Cl is −1.0/−0.23 a.u., respectively, while in the transition state, both of them have −0.71 a.u. and small positive charge migrates on the hydrogen atoms. The surrounding water molecules respond to the substrate charge change, and the radial distribution function (RDF) between Cl and water hydrogen atoms has been plotted in Figure 9. In the transition state, both Cl has a similar RDF with environmental water hydrogen atoms, which is consistent with the charge equity. In the reactant state, the attaching Cl attracts more first shell water hydrogen atoms than the transition state Cl. That indicates with a more negative charge, the interactions between ion-water pair are stronger, and our fluctuations index agrees with the understanding that the stronger interaction is less fluctuating. Although our approach is based on the static solute conformation, a prevoius ab initio molecular dynamics study42 on the same system has observed that the static and dynamics approaches have similar global features, and this further validates our conclusion.
Figure 9.
Radial distribution function of Cl and water hydrogen atoms in reactant (RC) and transition (TS) states, for both leaving and attaching Cl atoms.
4.4 Case III: Ligand-protein binding interactions
Crystal structures are commonly used to characterize binding pockets and positions of specific ligands to guide drug design. However, a direct observation over crystal structures would be subjective and it could be insufficient to reveal critical binding interactions between ligand and protein. Furthermore, crystal structure is static and may not be helpful to extract binding information. Here, aNCI analysis is applied to analyze the binding patterns of ligand-protein systems.
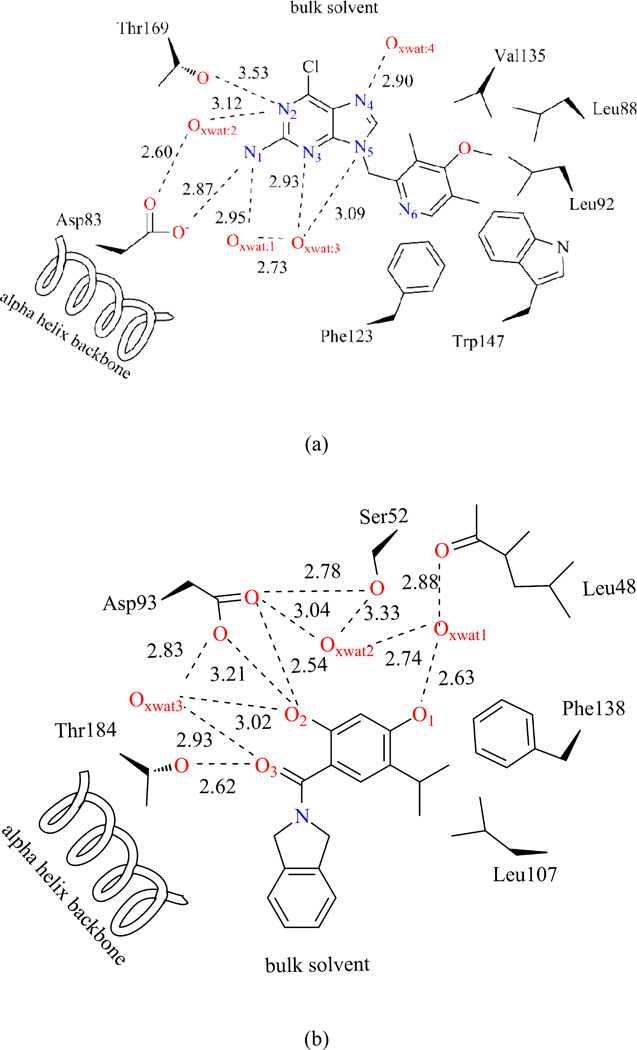
We chose two ligands in our study. The first one is a pre-clinical drug molecule, BIIB02143–45. It is a small molecule inhibitor of the heat shock protein Hsp90 that binds competitively with geldanamycin in the ATP-binding pocket of Hsp90. The molecular structure is taken from PDB: 3O6O. The second one is an in silico drug design intermediate compound in ligand-protein binding study46, named VHD as from structure PDB: 2XAB. Both ligands have a purine-scaffold and aromatic moiety. The bound proteins, Hsp83 and Hsp90, have similar global folding and active site structures. The interactions between substrate and environments have been scratches in Figures 10-a) and 10-b). In both Figures, all polar atoms with a distance less than 4.0 Å from ligand are shown, with no explicit hydrogen atoms.
Figure 10.
BIIB02 and VHD interactions with environment, according to crystal structure with PDB: 3O6O, 2XAB
In both systems, the substrate occupies the same active site with different orientations. Two polar amino acids, Asp and Thr both directly and indirectly interact with the two substrates: BIIB021 over the purine-scaffold N1 and N2, and VHD over the aromatic moiety O2 and linkage O3. Three crystal water molecules were observed inside the active site for both systems, and they are confined in hydrogen bond networks. The BIIB021 aromatic moiety largely locates within the active site and surrounded by many nonpolar residues: Phe123, Tyr124, Trp147, Leu92, Leu88, and Val135. In contrast, most of the VHD purine part is solvent accessible, which may indirectly stabilize the substrate binding.
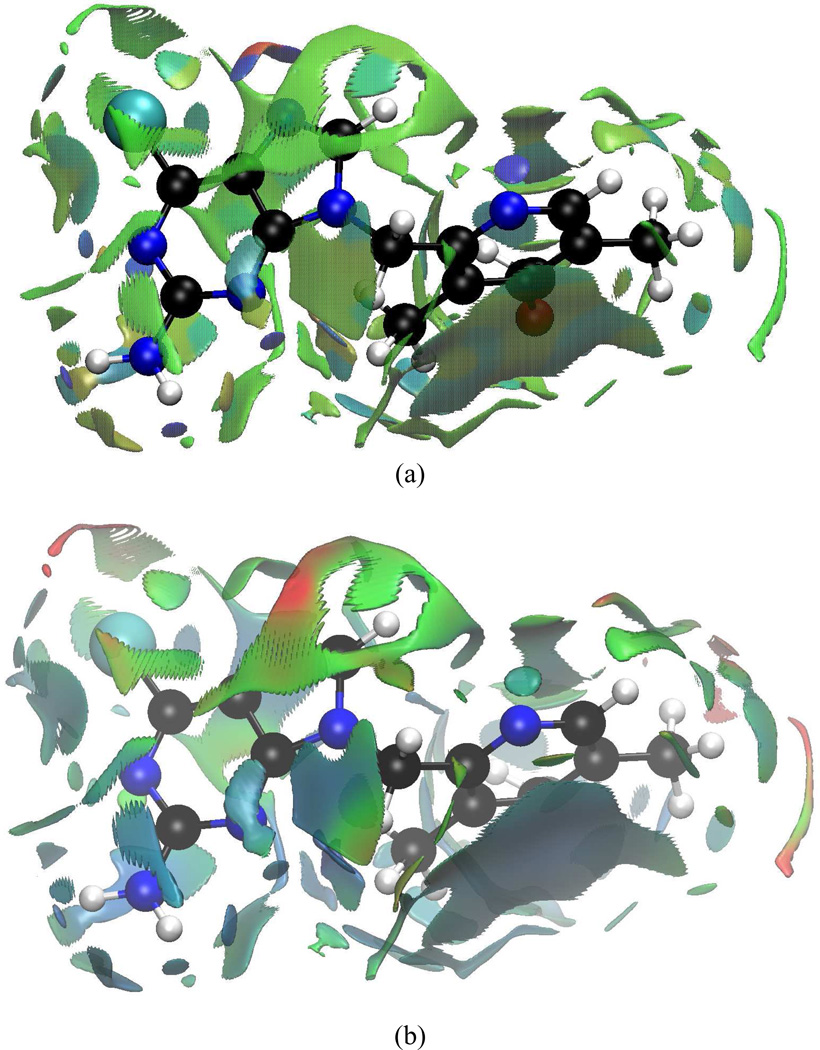
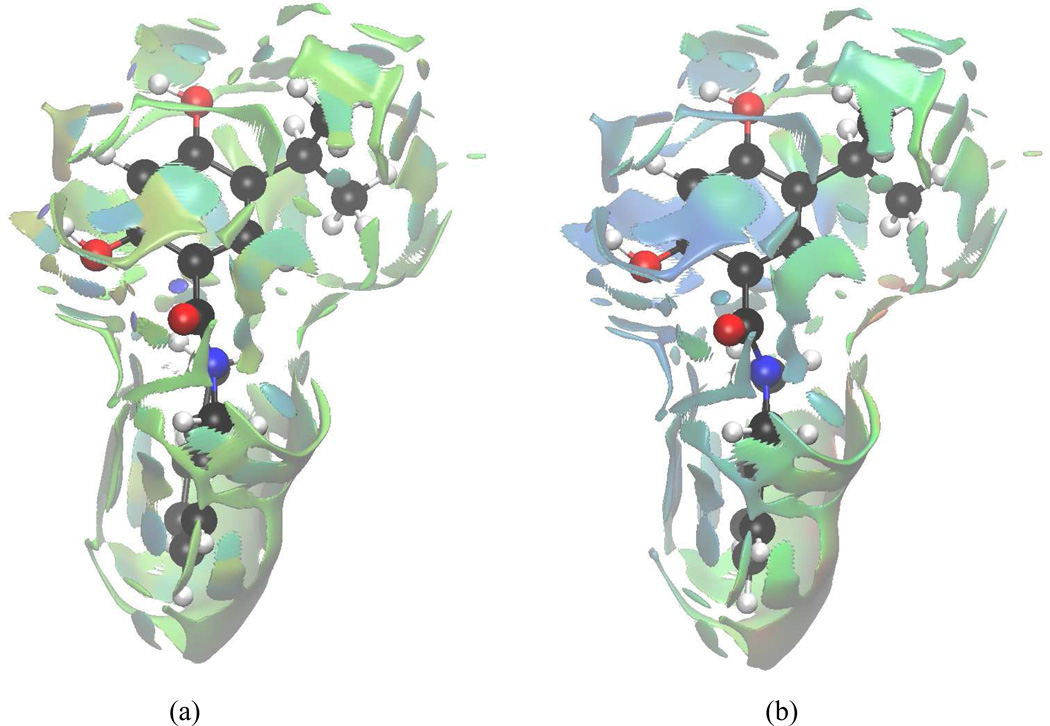
To reveal more information based on crystal structures, we carried out QM/MM-MFEP optimization for both systems. The optimized substrate structures have only 0.148 and 0.161 carbon atom root-mean-square-deviation with respect to those in crystal structures, respectively. This indicates QM/MM-MFEP optimization conserve the ligand binding poses. Based on this subsystem structure, the aNCI analysis with 1000 snapshots is calculated. The 3D aNCI density and aNCI fluctuation index for both substrates are shown in Figures 11 and 12, and the ICP effective density and fluctuation index are listed in Table II and Table III, respectively.
Figure 11.
aNCI analysis and fluctuation index of BIIB021 and protein environment under (a) 1000 snapshots aNCI analysis, and (b) fluctuations index
Figure 12.
aNCI analysis and fluctuation index of VHD and protein environment under (a) 1000 snapshots aNCI analysis, and (b) fluctuations index
Table II.
Effective density and fluctuation index of BIIB021-protein system
| Subsystem | N1 | N1 | N2 | N2 | N3 | N4 | N4 | N6 |
| Environment | Asp83 | XWAT1 | Thr169 | XWAT2 | XWAT3 | Bulk water | Bulk water | Bulk water |
| Effective density | −0.048 | −0.031 | −0.016 | −0.016 | −0.031 | −0.024 | −0.018 | −0.031 |
| Fluctuation index | 0.27% | 0.35% | 0.55% | 0.58% | 0.34% | 0.47% | 0.60% | 0.40% |
Table III.
Effective density and fluctuation index of VHD-protein system
| Subsystem | O1 | O2 | O3 | O3 |
| Environment | XWAT1 | Asp93 | Thr184 | XWAT3 |
| Effective density | −0.046 | −0.064 | −0.046 | −0.026 |
| Fluctuation index | 0.23% | 0.17% | 0.33% | 0.40% |
4.4.1 BIIB021 interaction features
Polar interactions between BIIB021 and environments are summarized in Table II, and can be visualized in Figure 11. The two ICPs of N1 atom correspond to strong Hydrogen Bonds (HB) with Asp83 (−0.048) and a crystal water molecule XWAT1 (−0.031). The average HB distances are 1.73 Å and 2.01 Å, respectively. N2 behaves as the HB acceptor for both Thr169 (−0.016) and XWAT1 (−0.016). A detailed analysis over the 1000 structures demonstrates that the HB constantly switches between XWAT2-N2 and Thr169-N2. This is so frequent that, in average, N2 shares HBs with both groups. This effective density is about half as the N1 atom interactions, which goes along with the averaged HB distance between N2 and XWAT2 (2.62 Å), Thr169-OH group (2.87 Å). N3 has only one HB with XWAT3 (−0.031), which is consistent with the crystal structure observation. This water position is quite rigid with an averaged HB distance 2.03 Å. N4 atom, which has XWAT4 nearby from crystal structure, forms two directional hydrogen bonds with bulk water molecules (During the MD simulations, several water molecules moved around N4 atom and no stable HB exists). This difference between crystal structure observation and aNCI results may be caused by the local environment, which makes water molecules favor a two-side interaction direction, not along the co-plane of purine ring. On the other hand, N6 atom has only one strong interaction with bulk water molecules, and this is because the local environment around N6 atom restricts the bulk water molecules to approach it from this single direction. Besides aNCI density, the fluctuation index over these hydrogen bonds is observed to be close related with their interaction strength. For N2 and N4, the fluctuation index are 0.55%, 0.58% and 0.47%, 0.60%, respectively, and their effective densities are about half comparing with N1 and N3. The weaker the effective density amount is, which may be caused by interaction with versatile waters, the more flexible these interactions are.
The π-π stacking between aromatic moiety and Phe123 side chain creates the most stable vdW interaction with fluctuation index around 0.25%, which is even less fluctuated than the strongest hydrogen bond. The aromatic moiety ring appears therefore rigid and suitable for substrate binding. The purine ring’s interaction with Met83 and Asn36 are also stable, with fluctuation index around 0.35%. However, since the latter are comparably weaker than HBs, the contribution to substrate binding may be limited.
4.4.2 VHD interaction features
The interactions between VHD and environment are listed in Table III, and visualized in Figure 12. The O2 atom is tightly bounded to Asp93. Asp93 not only directly stabilizes the O2 atom, but it also helps to confine the crystal waters XWAT2 and XWAT3. The O1 atom is hydrogen bonded with XWAT1 which is stabilized by Leu48, and this interaction is the second strongest polar interaction. O3 atom has two HBs: one with Thr184, and another with XWAT3, which is it stabilized by Asp93. The aNCI analysis is consistent with direct crystal structure observations, and it offers more information on interaction strength and stability.
Besides the polar interactions, the purine-scaffold ring makes a hydrophobic interaction with Ala55 which has effective density value of −0.009. A hydrophobic interaction between the aromatic ring and Asn51, Ser52 backbone has a similar strength and confine the substrate inside the active site.
According to our aNCI analysis, the purine scaffold is accessible to bulk solvent and only has fluctuated weak interactions with protein. If the binding mode does not change with the chemical modifications, the C5 atom of purine scaffold could be a promising site. Indeed, as found in experimental studies47, modifications over this region help to improve the biological property without disturbing the binding ability. In contrast, the modifications carried out on the aromatic moiety (change of O1 and isopropanol groups) can dramatically decrease the binding ability.
From aNCI analysis, both ligands were observed to bind the protein very well: the BIIB021 utilizes mainly nitrogen atoms to form hydrogen bond with the crystalized water and protein residues; the VHD has three oxygen atoms that form strong hydrogen bond with environment. The Asp residue is in a crucial role for the binding conformation: it not only forms direct hydrogen bond with substrate, but also helps the creation of an internal water hydrogen bond network. With these confined water molecules, the substrate can bind the active site strongly. A further design for potential drug molecule would maintain the critical interactions revealed by aNCI while ligand modifications should be performed on those unstable and weak interaction parts.
5. Conclusion
In this work, the NCI analysis is generalized to aNCI analysis, which characterizes the interactions from an ensemble of structures. With the aNCI density and aNCI fluctuation index, both averaged noncovalent interactions and fluctuations can be directly visualized. For solute-solvent system, the tetrahedral hydrogen interaction network in water-water, and the π-hydrogen bond in benzene-water system were characterized. The π-hydrogen bond appears as a weaker and more flexible interaction comparing with water-water counterpart. In SN2 reaction, a reorganization of partial charges changes the solvation structures, and as well as the interaction strengths with environment. Further applications in ligand-protein binding systems reveal the complex interaction networks of two drug molecules in heat shock protein active site. With aNCI analysis, the crystal structure was further illustrated and it could help the drug design process.
The aNCI analysis is general and can be coupled with any type of molecular dynamic simulation (QM, QM/MM, polarizable and classical MM force fields). In this work it was interfaced with the recently developed QM/MM-MFEP approach with classical force field. However, in system where it is difficult to represent by classical force field, such as metal cations, pure QM or polarizable force fields would play a critical role. The further works are currently ongoing to study the influence of these methods used on the aNCI results. Overall, aNCI is a useful tool to characterize noncovalent interaction patterns in fluctuating environments.
ACKNOWLEDGMENT
The revised NCI program can be downloaded from our group page http://www.chem.duke.edu/~yang/software.htm). The support from the National Institute of Health (R01-GM061870) and the National Science Foundation (CHE-09-11119) are gratefully acknowledged.
REFERENCES
- 1.Müller-Dethlefs K, Hobza P. Chem. Rev. 1999;100:143–168. doi: 10.1021/cr9900331. [DOI] [PubMed] [Google Scholar]
- 2.Cerny J, Hobza P. Phys. Chem. Chem. Phys. 2007;9:5291–5303. doi: 10.1039/b704781a. [DOI] [PubMed] [Google Scholar]
- 3.Matthews CR. Annu. Rev. Biochem. 1993;62:653–683. doi: 10.1146/annurev.bi.62.070193.003253. [DOI] [PubMed] [Google Scholar]
- 4.Robertson AD, Murphy KP. Chem. Rev. 1997;97:1251–1268. doi: 10.1021/cr960383c. [DOI] [PubMed] [Google Scholar]
- 5.Shuguang Z. Nat. Biotechnol. 2003;21:1171–1178. doi: 10.1038/nbt874. [DOI] [PubMed] [Google Scholar]
- 6.Johnson ER, Keinan S, Mori-Sánchez P, Contreras-García J, Cohen AJ, Yang W. J. Am. Chem. Soc. 2010;132:6498–6506. doi: 10.1021/ja100936w. [DOI] [PMC free article] [PubMed] [Google Scholar]
- 7.Contreras-García J, Yang W, Johnson ER. J. Phys. Chem. A. 2011;115:12983–12990. doi: 10.1021/jp204278k. [DOI] [PMC free article] [PubMed] [Google Scholar]
- 8.Wu P, Cisneros GA, Hu H, Chaudret R, Hu X, Yang W. J. Phys. Chem. B. 2012;116:6889–6897. doi: 10.1021/jp212643j. [DOI] [PMC free article] [PubMed] [Google Scholar]
- 9.Nilsson Lill SO. Phys. Chem. Chem. Phys. 2011;13:16022–16027. doi: 10.1039/c1cp21390c. [DOI] [PubMed] [Google Scholar]
- 10.Spackman MA, Maslen EN. J. Chem. Phys. 1986;90:2020–2027. [Google Scholar]
- 11.Pendas AM, Luana V, Pueyo L, Francisco E, Mori-Sanchez P. J. Chem. Phys. 2002;117:1017–1023. [Google Scholar]
- 12.Contreras-García J, Johnson ER, Keinan S, Chaudret R, Piquemal J-P, Beratan DN, Yang W. J. Chem. Theory Comput. 2011;7:625–632. doi: 10.1021/ct100641a. [DOI] [PMC free article] [PubMed] [Google Scholar]
- 13.van Severen M-C, Chaudret R, Parisel O, Piquemal J-P. Chem. Phys. Lett. 2012;532:9–12. [Google Scholar]
- 14.Beck EM, Hyde AM, Jacobsen EN. Org. Lett. 2011;13:4260–4263. doi: 10.1021/ol201608a. [DOI] [PMC free article] [PubMed] [Google Scholar]
- 15.Gillet N, Chaudret R, Contreras-García J, Yang W, Silvi B, Piquemal J-P. J. Chem. Theory Comput. 2012;8:3993–3997. doi: 10.1021/ct300234g. [DOI] [PMC free article] [PubMed] [Google Scholar]
- 16.Hu H, Yang W. Annu. Rev. Phys. Chem. 2008;59:573–601. doi: 10.1146/annurev.physchem.59.032607.093618. [DOI] [PMC free article] [PubMed] [Google Scholar]
- 17.Hu H, Lu Z, Yang W. J. Chem. Theory Comput. 2007;3:390–406. doi: 10.1021/ct600240y. [DOI] [PMC free article] [PubMed] [Google Scholar]
- 18.Humphrey W, Dalke A, Schulten K. J. Mol. Graphics. 1996;14:33–38. doi: 10.1016/0263-7855(96)00018-5. [DOI] [PubMed] [Google Scholar]
- 19.Hu H, Lu Z, Parks JM, Burger SK, Yang W. J. Chem. Phys. 2008;128:034105–034123. doi: 10.1063/1.2816557. [DOI] [PubMed] [Google Scholar]
- 20.Parks JM, Hu H, Rudolph J, Yang W. J. Phys. Chem. B. 2009;113:5217–5224. doi: 10.1021/jp805137x. [DOI] [PMC free article] [PubMed] [Google Scholar]
- 21.Zeng X, Hu H, Hu X, Yang W. J. Chem. Phys. 2009;130:164111–164119. doi: 10.1063/1.3120605. [DOI] [PMC free article] [PubMed] [Google Scholar]
- 22.Hu X, Hu H, Melvin JA, Clancy KW, McCafferty DG, Yang W. J. Am. Chem. Soc. 2010;133:478–485. doi: 10.1021/ja107513t. [DOI] [PMC free article] [PubMed] [Google Scholar]
- 23.Lee C, Yang W, Parr RG. Phys. Rev. B. 1988;37:785–789. doi: 10.1103/physrevb.37.785. [DOI] [PubMed] [Google Scholar]
- 24.MacKerell AD, Bashford D, Bellott M, Dunbrack RL, Evanseck JD, Field MJ, Fischer S, Gao J, Guo H, Ha S, Joseph-McCarthy D, Kuchnir L, Kuczera K, Lau FTK, Mattos C, Michnick S, Ngo T, Nguyen DT, Prodhom B, Reiher WE, Roux B, Schlenkrich M, Smith JC, Stote R, Straub J, Watanabe M, Wiókiewicz-Kuczera J, Yin D, Karplus M. J. Phys. Chem. B. 1998;102:3586–3616. doi: 10.1021/jp973084f. [DOI] [PubMed] [Google Scholar]
- 25.Jorgensen WL, Chandrasekhar J, Madura JD, Impey RW, Klein ML. J. Chem. Phys. 1983;79:926–935. [Google Scholar]
- 26.Davis IW, Leaver-Fay A, Chen VB, Block JN, Kapral GJ, Wang X, Murray LW, Arendall WB, Snoeyink J, Richardson JS, Richardson DC. Nucleic Acids Res. 2007;35:W375–W383. doi: 10.1093/nar/gkm216. [DOI] [PMC free article] [PubMed] [Google Scholar]
- 27.Head-Gordon T, Hura G. Chem. Rev. 2002;102:2651–2670. doi: 10.1021/cr0006831. [DOI] [PubMed] [Google Scholar]
- 28.Clark GNI, Cappa CD, Smith JD, Saykally RJ, Head-Gordon T. Mol. Phys. 2010;108:1415–1433. [Google Scholar]
- 29.Kumar R, Schmidt JR, Skinner JL. J. Chem. Phys. 2007;126:204107–204119. doi: 10.1063/1.2742385. [DOI] [PubMed] [Google Scholar]
- 30.Sharp KA, Vanderkooi JM. Acc. Chem. Res. 2009;43:231–239. doi: 10.1021/ar900154j. [DOI] [PMC free article] [PubMed] [Google Scholar]
- 31.Atwood JL, Hamada F, Robinson KD, Orr GW, Vincent RL. Nature. 1991;349:683–684. [Google Scholar]
- 32.Suzuki S, Green PG, Bumgarner RE, Dasgupta S, Goddard WA, Blake GA. Science. 1992;257:942–945. doi: 10.1126/science.257.5072.942. [DOI] [PubMed] [Google Scholar]
- 33.Gierszal KP, Davis JG, Hands MD, Wilcox DS, Slipchenko LV, Ben-Amotz D. J. Chem. Phys. Lett. 2011;2:2930–2933. [Google Scholar]
- 34.Bondesson L, Rudberg E, Luo Y, Sałek P. J. Comput. Chem. 2008;29:1725–1732. doi: 10.1002/jcc.20930. [DOI] [PubMed] [Google Scholar]
- 35.Allesch M, Lightstone FC, Schwegler E, Galli G. J. Chem. Phys. 2008;128:014501–014510. doi: 10.1063/1.2806288. [DOI] [PubMed] [Google Scholar]
- 36.Allesch M, Schwegler E, Galli G. J. Phys. Chem. B. 2007;111:1081–1089. doi: 10.1021/jp065429c. [DOI] [PubMed] [Google Scholar]
- 37.Giuseppe G. Chem. Phys. Lett. 2006;429:114–118. [Google Scholar]
- 38.Baron M, Kowalewski VJ. J. Phys. Chem. A. 2006;110:7122–7129. doi: 10.1021/jp0555908. [DOI] [PubMed] [Google Scholar]
- 39.Schravendijk P, van der Vegt NFA. J. Chem. Theory Comput. 2005;1:643–652. doi: 10.1021/ct049841c. [DOI] [PubMed] [Google Scholar]
- 40.Zheng J, Kwak K, Asbury J, Chen X, Piletic IR, Fayer MD. Science. 2005;309:1338–1343. doi: 10.1126/science.1116213. [DOI] [PubMed] [Google Scholar]
- 41.Rosenfeld DE, Kwak K, Gengeliczki Z, Fayer MD. J. Phys. Chem. B. 2010;114:2383–2389. doi: 10.1021/jp911452z. [DOI] [PMC free article] [PubMed] [Google Scholar]
- 42.Joubert L, Pavone M, Barone V, Adamo C. J. Chem. Theory Comput. 2006;2:1220–1227. doi: 10.1021/ct0600159. [DOI] [PubMed] [Google Scholar]
- 43.Lundgren K, Zhang H, Brekken J, Huser N, Powell RE, Timple N, Busch DJ, Neely L, Sensintaffar JL, Yang Y-c, McKenzie A, Friedman J, Scannevin R, Kamal A, Hong K, Kasibhatla SR, Boehm MF, Burrows FJ. Mol. Cancer Ther. 2009;8:921–929. doi: 10.1158/1535-7163.MCT-08-0758. [DOI] [PubMed] [Google Scholar]
- 44.Böll B, Eltaib F, Reiners KS, von Tresckow B, Tawadros S, Simhadri VR, Burrows FJ, Lundgren K, Hansen HP, Engert A, Pogge von Strandmann E. Clin. Cancer Res. 2009;15:5108–5116. doi: 10.1158/1078-0432.CCR-09-0213. [DOI] [PubMed] [Google Scholar]
- 45.Taldone T, Gozman A, Maharaj R, Chiosis G. Curr. Opin. Pharmacol. 2008;8:370–374. doi: 10.1016/j.coph.2008.06.015. [DOI] [PMC free article] [PubMed] [Google Scholar]
- 46.Murray CW, Carr MG, Callaghan O, Chessari G, Congreve M, Cowan S, Coyle JE, Downham R, Figueroa E, Frederickson M, Graham B, McMenamin R, O’Brien MA, Patel S, Phillips TR, Williams G, Woodhead AJ, Woolford AJA. J. Med. Chem. 2010;53:5942–5955. doi: 10.1021/jm100059d. [DOI] [PubMed] [Google Scholar]
- 47.Woodhead AJ, Angove H, Carr MG, Chessari G, Congreve M, Coyle JE, Cosme J, Graham B, Day PJ, Downham R, Fazal L, Feltell R, Figueroa E, Frederickson M, Lewis J, McMenamin R, Murray CW, O’Brien MA, Parra L, Patel S, Phillips T, Rees DC, Rich S, Smith D-M, Trewartha G, Vinkovic M, Williams B, Woolford AJA. J. Med. Chem. 2010;53:5956–5969. doi: 10.1021/jm100060b. [DOI] [PubMed] [Google Scholar]


