Abstract
Purpose.
In situ 2-photon excitation fluorescence (TPEF) of the human trabecular meshwork (TM) reveals beams of heterogeneous autofluorescence (AF) comprising high intensity fluorescent fibers (AF-high) on a background of lower intensity fluorescence (AF-low). To determine the sources of this AF heterogeneity, we imaged human TM to characterize AF, second harmonic generation (SHG) for collagen, and eosin-labeled fluorescence identifying elastin.
Methods.
Corneoscleral rims retained after corneal transplantation were incubated with and without eosin, and imaged by TPEF. TPEF was collected through multiphoton bandpass filters to obtain AF, SHG (collagen bandwidth), and eosin-labeled fluorescence images. For qualitative comparisons, near-simultaneous image acquisition pairs of AF-SHG (+/− eosin coincubation), AF-eosin, and SHG-eosin were captured. For quantitative comparisons, multiple regions of interest (ROI) were defined in separate TM beam regions within the uveal and corneoscleral meshwork for image acquisition pairs of AF-SHG (without eosin coincubation) and SHG-eosin. We defined 18 ROI within each acquisition pair as the basis for Manders colocalization analysis. Perfect colocalization was defined as a Manders coefficient (Mcoeff) of 1.
Results.
Qualitatively and quantitatively, AF-low colocalized with SHG (Mcoeff = 1), but not SHG signal-voids. AF-high colocalized with SHG signal-voids (Mcoeff = 1), but not the SHG signal. Like AF-high, eosin-labeled fluorescence qualitatively and quantitatively colocalized (Mcoeff = 1) with SHG signal-voids, but not the SHG signal.
Conclusions.
Heterogeneous AF in human TM is comprised of high intensity signal originating from elastin fibers in beam cores and lower intensity signal originating from collagen. These findings are relevant to interpreting structural extracellular matrix signals in AF images of the TM.
Keywords: trabecular meshwork, autofluorescence, collagen, elastin
Human trabecular meshwork (TM) autofluorescence (AF) is heterogeneous with different intensities. Second harmonic generation signal representing collagen and eosin-labeled fluorescence representing elastin demonstrates that the heterogeneous AF in human TM is comprised of elastin encased in collagen.
Introduction
Autofluorescence (AF) visualization by two-photon excitation fluorescence (TPEF) provides intricate views of the trabecular meshwork's (TM's) structural extracellular matrix (ECM) without exogenous labeling. This is seen as a 3-dimensional (3D) organization of branching beams in the uveal meshwork (UVM), coarser beams and plates with intervening pores in the corneoscleral meshwork (CS), and arrays of fine fibers in the juxtacanalicular meshwork.1–3 Within trabecular beams we observe fine, high intensity autofluorescent fibers that are aligned with beam axes. These intensely autofluorescent fibers are distinguishable from a background of dimmer and more homogenous AF within the UVM and CS beams (Fig. 1). The biologic sources of this AF heterogeneity1,2 are unclear, and it is possible that different protein fluorophores contribute to this heterogeneity.
Figure 1. .
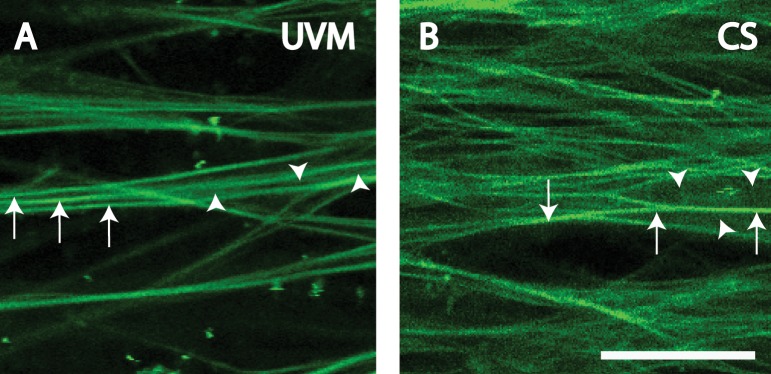
Heterogeneous signals in AF images of human UVM (A) and CS (B). Arrowheads: regions of dim AF signal. Arrows: regions of bright AF signal. Scale bars: 25 μm.
Collagen and elastin are present in trabecular beams and fibers, and are candidate contributors to TM AF.4–9 Other endogenous fluorophores in the eye include NAD(P)H, flavins, melanin, and lipofuscin.10–12 If contributors to TM AF were known, it might make it possible to exploit AF imaging to noninvasively query specific proteins or biomarkers in the tissue, such as collagen or elastin, whose abnormalities are linked with glaucoma and IOP derangements.13–16 Noninvasive live AF imaging for retinal lipofuscin10 and optic nerve head drusen11 are already in widespread clinical use.
Second harmonic generation (SHG) has been used to characterize collagen in various tissues,12 including the eye.1,2,17–21 SHG is a nonlinear phenomenon occurring in two-photon microscopy wherein scattering and nonlinear optical recombination of photons produce a signal half the wavelength of the incident light.12 SHG occurs with noncentrosymmetric molecules, such as collagen, and requires specific narrow bandwidth filters to be seen.12,22
Eosin normally is used to highlight cytoplasmic material in conventional histologic sectioning. With appropriate excitation, eosin specifically and fluorescently labels elastin in many tissues, such as skin, kidney, lung, and blood vessels23–26 which may be visualized by TPEF. Elastin stains, such as eosin, are used as alternatives to elastin immunolabeling, which can be unpredictable presumably due to variable epitope recognition.27
TM cell biology traditionally has been studied in 2D cell culture, but not in situ. We have sought to adapt the easy accessibility of in vitro techniques to a novel organotypic model in which cells and ECM can be observed directly by TPEF within the original 3D context of the TM.1,2 Using TPEF,1,2,17,18 high resolution optical sectioning is possible by near-infrared excitation that allows deep tissue penetration, with less phototoxicity, tissue bleaching, and thermal damage12 compared to traditional single photon microscopy. Tissue serial optical sectioning permits subsequent 3D image reconstruction and analysis.
We have previously observed heterogeneity in AF features of the human TM in TPEF imaging using our standard settings.1,2 Here, we dissect out specific contributors to the heterogeneous AF signal. We hypothesize that collagen and elastin contribute to AF in the TM, but yield different signals that can be distinguished by AF signal intensity. To probe these AF sources, we have combined qualitative visualization of AF, collagen SHG, and eosin-labeled elastin fluorescence with quantitative colocalization image analysis in TPEF imaging of the human TM in situ.
Methods
Tissue
Posttransplant human donor corneoscleral rim tissue containing intact TM and Schlemm's canal outflow system were provided by Doheny Eye Institute (Los Angeles, CA) corneal surgeons. Corneal transplantation typically occurred within 6 days postmortem. Procurement was approved by the University of Southern California IRB and complied with the tenets of the Declaration of Helsinki. Donor tissue was received immediately after corneal transplant surgery, maintained in Optisol GS transport media (Bausch & Lomb, Rochester, NY) at 4°C, and processed immediately after receipt. Tissue quality and viability screening was performed as described previously.2,3
TPEF Microscopy
Tissue preparation and TPEF setup were conducted based on established methods.1–3 Briefly, radial wedges containing the TM were sectioned with a razor blade. Eosin-treated wedges were placed in 1% eosin at 37°C for 30 minutes and then washed 3× with PBS. Tissue wedges were imaged with a Leica TCS/SP5/AOBS/MP confocal microscope system (Leica Microsystems, Heidelberg, Germany) coupled to a Chameleon Ultra-II multiphoton laser (Coherent, Santa Clara, CA). The laser was centered at 850 nm to excite AF. For consistency, this wavelength was chosen to match prior studies showing AF heterogeneity. Excitation of 850 nm was chosen originally to provide an optimal balance in visualizing Hoechst-labeled nuclei, AF, and minimizing bleed-through from longer wavelengths channels.1–3 TPEF signals were collected through multiphoton bandpass filters (AF 500–550 nm, SHG 415–435 nm [for collagen12], and eosin fluorescence 590–680 nm [for elastin23–26]). Optical sections were acquired as the following pairs: AF (green filter) and SHG (ultraviolet filter) for tissue exposed and not exposed to eosin, AF and eosin-labeled tissue (red filter), and SHG and eosin-labeled tissue.
Quantitative Colocalization Analysis
Image Acquisition Pairs.
AF signals in UVM and CS beams were of at least two types: (1) Curvilinear fibers with high intensity AF on a (2) background of diffuse lower intensity AF (Fig. 1). We determined the extent of colocalization between same tissue regions of high intensity AF (AF-high), lower intensity AF (AF-low), eosin-labeled fluorescence (for elastin), and SHG signals (collagen bandwidth). Given possible overlap in the emission profiles of AF and eosin-labeled fluorescence in the same tissues, qualitative but not quantitative analysis was performed between these two signals. Quantitative colocalization analysis between AF and SHG was performed in tissues not exposed to eosin.
Image Processing.
Initially, fixed threshold levels were determined for images captured in eosin (590–680 nm) and SHG (415–435 nm) emission channels of separate reference tissue not used for colocalization analysis. This allowed positive eosin labeling and SHG signals to be differentiated clearly from nonspecific background signals. SHG and eosin-induced fluorescence thresholds corresponding to look-up table values (LUT; grayscale 0–256) in Photoshop CS5 (Adobe Systems, Inc., San Jose, CA) for UVM were 95 and 100, respectively, and for CS were 75 and 100, respectively. These thresholds were used to set the black level in all subsequent images captured in eosin and SHG channels for the UVM and CS.
Regions of Interest (ROI).
Images were acquired of the UVM and CS regions of different donor tissues that were labeled or unlabeled with eosin to compile image acquisition pairs. ROIs were selected within specific tissue regions containing, for AF images: AF-high or AF-low, for eosin-labeled fluorescence images: positive (EOS-pos) or negative (EOS-neg) signals, or for SHG images: positive (SHG-pos) or negative (SHG-void) signals.
ROI from corresponding regions of optical sections of the UVM and CS were subjected to quantitative colocalization analysis (see below). To place ROI, selected tissue beams were zoomed in on to reveal their pixel composition. Using Photoshop CS5 (Adobe Systems, Inc.), ROI comprising 3 × 3 pixel matrices were placed in the middle of features of interest to avoid transitional border regions of image features that could vary with background correction. Perfect colocalization gave a Manders value of 1.
Images of a common image frame, but from different channels, were overlaid in register in Photoshop CS5 (Adobe Systems, Inc.). This allowed analysis of corresponding ROI in acquisition pairs.
To illustrate quantitative colocalization analysis, Figure 2 shows ROI in grayscale for an AF/SHG image acquisition pair to determine if: (1) AF-low (Fig. 2, ROI 1–3) colocalized with SHG-pos (Fig. 2, ROI I'–3′) and (2) AF-high (Fig. 2, ROI A–C) colocalized with SHG-void (Fig. 2, A'–C').
Figure 2.
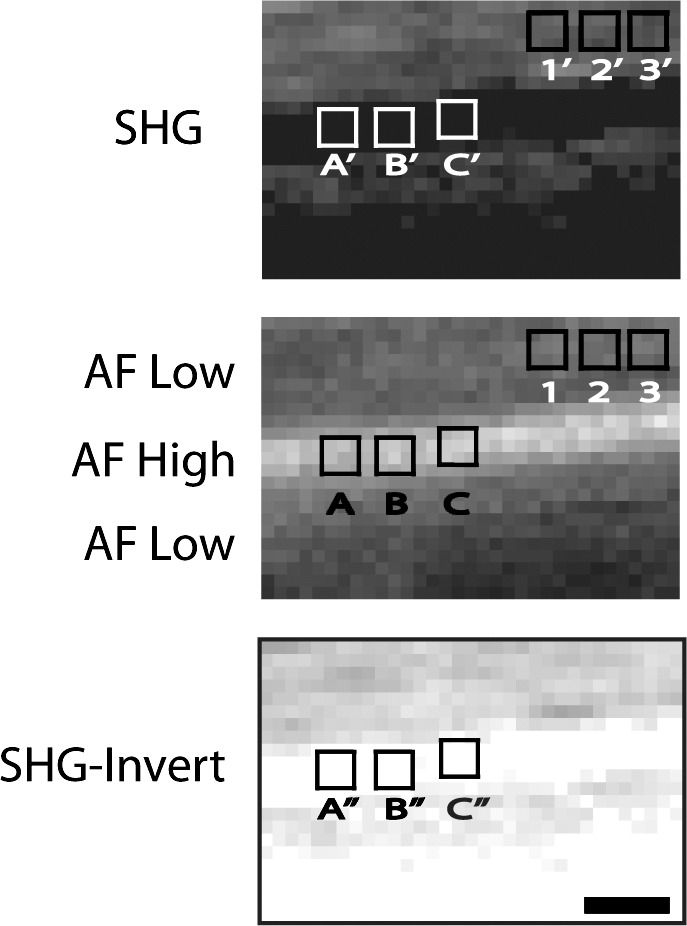
Illustration of ROIs and image processing of UVM beams for SHG (top) and AF (middle) grayscale images. The SHG image was inverted (SHG-Invert, bottom) to create an image negative. ROI were positioned in matching AF and SHG images by software overlay. AF ROIs 1–3 (corresponding to SHG 1′–3′) and (A–C; SHG A'–C') were in AF-low and AF-high regions, respectively. As ROI (A–C) in AF-high regions corresponded with SHG signal voids (ROI A'–C'), SHG-Invert was created in which ROI were in nonzero signal regions (ROI A''–C'') to permit meaningful Manders analysis. Scale bars: 2.5 μm.
Manders Colocalization Analysis.
Colocalization represents the spatial overlap of signal intensities from separate image channels (AF, SHG, and eosin) of matching tissue regions. Quantitative colocalization analysis was performed in ImageJ software (National Institutes of Health [NIH], Bethesda, MD) using Manders coefficients (Mcoeff), a well-established method for assessing the degree of colocalization between 2 images.28,29 The Mcoeffs, M1 and M2, reflect the degree of bidirectional colocalization between a pair of images. The Mcoeff M1 is computed as the sum of signal intensities in Image 1 having corresponding components in Image 2, divided by the sum of total intensities in Image 1 (Equation 1). The M2 coefficient is computed similarly, but in the opposite direction, wherein M2 is the sum of signal intensities in Image 2 having corresponding components in Image 1, divided by the sum of total intensities in Image 2 (Equation 2). Manders values range from 0, indicating no colocalization, to 1, indicating exact colocalization of corresponding ROI in different channels. Each ROI was saved and opened in the Wright cell imaging facility (WCIF) ImageJ colocalization collection (version 1.37b; NIH).
 |
 |
In the example of Figure 2, Manders colocalization coefficients were calculated between AF-low (ROI 1–3) and SHG-pos (ROI 1′–3′) in corresponding ROI using the Intensity Correlation Analysis plugin. Some caveats were AF-high (Fig. 2, ROI A–C) regions could not be compared to corresponding SHG-void regions (Fig. 2, ROI A'–C') as the latter had zero fluorescence (LUT of zero), and would have introduced a zero denominator and meaningless result in Manders analysis. To circumnavigate this, an exact image negative (inverted image) of the SHG image (Fig. 2, SHG-invert) was created in which pixel gray values were inverted to compute the image negative.30 In each image negative, pixel gray values were inverted on the same intensity scale without altering the relationship between pixels or regions with positive/negative signal. Regions of AF-high (Fig. 2, ROI A–C) were then compared to corresponding ROI in the inverted SHG image (SHG-invert, Fig. 2, ROI A''–C'') having nonzero fluorescence. Paired comparisons were: AF-low/SHG, AF-high/SHG-Invert, Eosin/SHG-Invert, and SHG/Eosin-Invert. Three beams were chosen from two different TM image stacks from different donors. A total of 6 ROI were placed per beam per image acquisition pair, giving a total of 18 ROI analyzed per paired comparison. Image inversion was performed for SHG/AF and SHG/eosin-labeled pairings.
3D Image Comparisons.
Raw data from multiphoton fluorescence z-stacks were imported into Imaris 7.3.0 (Bitplane, Zurich, Switzerland), which translated the information into voxels. Surface renderings were generated using the Surface Object tool and the Automatic Local Contrast Surfaces option. 3D polygonal rendering was matched visually to the raw fluorescence data as represented by the Blend Projection algorithm. For AF-high (light green) and AF-low (dark green) renderings, fluorescence data in the green channel was filtered by voxel intensity using a slider as determined by a real-time on-screen rendering of the filtered fluorescence data. The green fluorescence data were filtered without visualizing the eosin (red) information to avoid bias in selecting filter levels. A colocalization channel was created for the entire, cropped z-stack using the Colocalization tool. A surface rendering was generated for this new (colocalization) channel.
Results
Qualitative Analysis
Autofluorescence.
The autofluorescent structure of the TM varied with tissue depth. Autofluorescent beams with large intervening gaps were seen in the UVM (Fig. 1A). Autofluorescent plate-like structures with smaller pores were seen in the CS (Fig. 1B). We focused our analysis on the UVM and CS, as AF signal heterogeneity and distinction between high (AF-high) and lower (AF-low) AF intensity were best seen here. In the juxtacanalicular meshwork, increasing signal-to-noise ratio with depth made it harder to perform qualitative and quantitative comparisons consistently.
The autofluorescent signals in UVM beams and CS plates were heterogeneous. In UVM beams, linear or curvilinear AF-high fiber-like signals within beams and aligned along the beam axes were seen on an AF-low background (Fig. 1A). In the plate-like structure of the CS, AF-high fiber-like structures crisscrossed the plates, again on a background of AF-low (Fig. 1B). AF-low revealed the apparent width of UVM and CS beams.
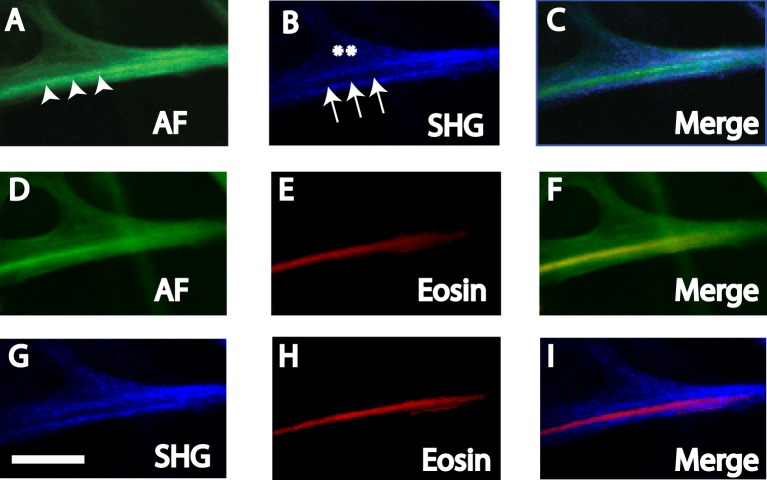
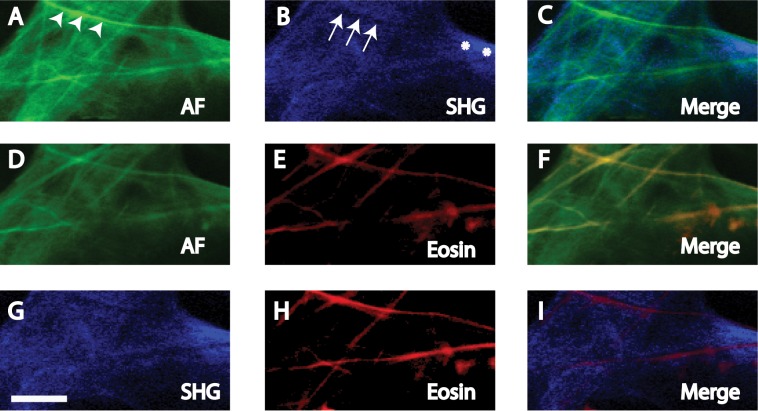
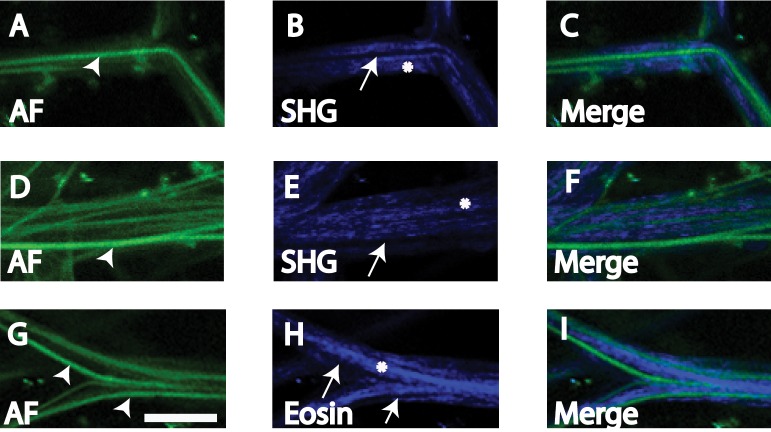
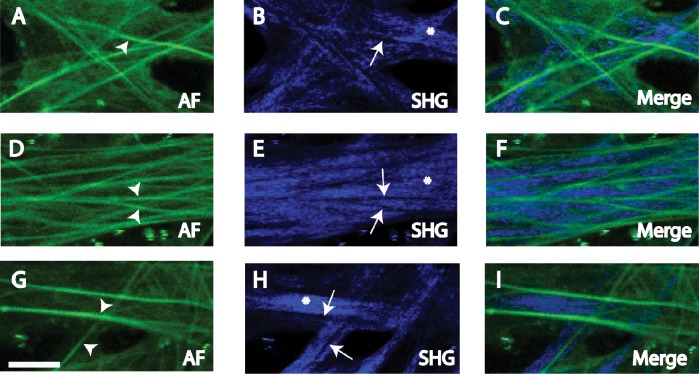
AF-high and AF-low heterogeneity was present in the UVM and CS in tissues exposed (Figs. 3A, 3D, 5A, 5D) and unexposed (Figs. 4A, 4D, 4G, 6A, 6D, 6G) to eosin.
Figure 3. .
AF (A, D), SHG (B, G), and eosin-labeled fluorescence (Eosin, [E, H]) in human UVM. Merged images are (C) AF and SHG, (F) AF and Eosin, and (I) SHG and Eosin. (A–C) AF-low coincided with SHG signals (asterisks), but AF-high (arrowheads) coincided with SHG signal-voids (arrows). (D–F) AF-high but not AF-low coincided with EOS-pos. (G, H) EOS-pos coincided with SHG signal-voids. Scale bars: 10 μm.
Figure 5. .
AF (A, D), SHG (B, G), and eosin-labeled fluorescence (Eosin, [E, H]) in human CS. Merged images are (C) AF and SHG, (F) AF and Eosin, and (I) SHG and Eosin. (A–C) AF-low coincided with SHG signals (asterisks), but AF-high (arrowheads) coincided with SHG signal-voids (arrows). (D–F) AF-high, but not AF-low coincided with EOS-pos. (G, H) EOS-pos coincided with SHG signal-voids. Scale bars: 10 μm.
Figure 4.
AF (A, D, G) and SHG (B, E, H) in human UVM not exposed to eosin due to partial overlap of eosin and AF emission spectra. AF-high (arrowheads) coincided with SHG signal voids (arrows), and AF-low coincided with SHG signals (asterisk). Merged images (C, F, I) depict the nonoverlap of high intensity AF and SHG signals. Scale bars: 10 μm.
Figure 6. .
AF (A, D, G) and SHG (B, E, H) in CS not exposed to eosin due to partial overlap of eosin and AF emission spectra. AF-high (arrowheads) coincided with SHG signal voids (arrows), and AF-low coincided with SHG signals (asterisk). Merged images (C, F, I) depict the nonoverlap of AF-high and SHG signals. Scale bars: 10 μm.
Autofluorescence and SHG Correspondence.
Paired AF and SHG images of the UVM (Figs. 3, 4) and CS (Figs. 5, 6) that were near-simultaneously acquired were compared. This strategy permitted the same frame of the same structure to be visualized by AF and SHG imaging. SHG was captured using a filter bandwidth of 415 to 435 nm for collagen. AF and SHG correspondence was analyzed in tissue exposed (Figs. 3, 5) and not exposed (Figs. 4, 6) to eosin due to some overlap in the emission profiles of AF and eosin.
SHG imaging of UVM and CS structures revealed trabecular beams and plates (Figs. 3–6). SHG signals (SHG-pos) coincided with regions of AF-low, but not AF-high (Figs. 3A–C, 5A–C). This was true whether or not tissue had been exposed to eosin (Figs. 4, 6).
In SHG images, signal voids in which SHG were absent (SHG-void) appeared as dark streaks (Figs. 3B, 3G, 5B, 5G). These SHG-void regions coincided with AF-high fibers (see merged images, Figs. 3A–C, 5A–C). This was true whether or not tissue had been exposed to eosin (Figs. 4, 6).
Therefore, regardless of eosin exposure, tissue regions with AF-low coincided with SHG-pos regions, representing collagen. Alternatively, AF-high tissue regions coincided with SHG-void regions.
SHG and Eosin Correspondence.
Paired SHG and eosin-labeled images of the UVM (Figs. 3G–I) and CS (Figs. 5G–I) that were near-simultaneously acquired were compared. This strategy permitted the same frame of the same structure to be visualized by SHG and eosin-labeled fluorescence imaging.
As with AF-high fibers, EOS-pos fibers coincided with SHG-void, but not SHG-pos regions (Figs. 3G–I, 5G–I).
Autofluorescence and Eosin Correspondence.
Paired AF and eosin-labeled images of the UVM (Figs. 3D–F) and CS (Figs. 5D–F) that were near-simultaneously acquired were compared. As some overlap in AF and eosin emission profiles was expected, only qualitative comparisons were made. Eosin labeling identified elastin.
Positive eosin-labeled fluorescence (EOS-pos) was seen along linear or curvilinear fiber-like structures within the UVM beams (Figs. 3E, 3H) and CS plates of the TM (Figs. 5E, 5H). EOS-pos and AF-high regions coincided, revealing fibers aligned along UVM beam axes (Figs. 3D–F) and crisscrossing CS plates (Figs. 5D–F). EOS-pos did not coincide with AF-low regions in UVM beams (Figs. 3D–F) and CS plates (Figs. 5D–F).
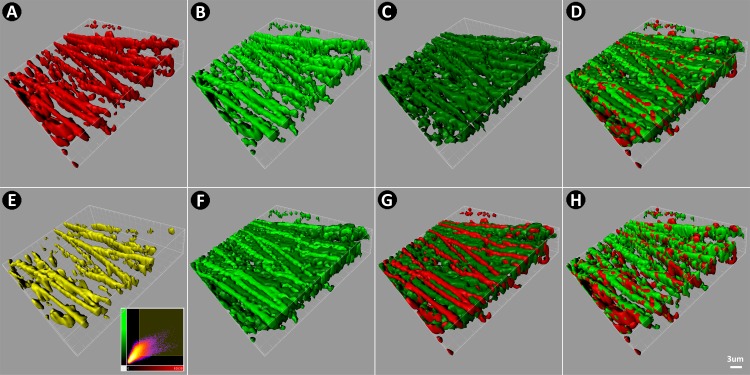
3D TM reconstructions (Fig. 7) combining EOS-pos (Fig. 7A), AF-high (Fig. 7B), and AF-low (Fig. 7C) signals confirmed EOS-pos correspondence with AF-high (Fig. 7E).
Figure 7.
3D reconstruction of CS comparing EOS-pos (red) and AF (green). (A) EOS-pos. (B) AF-high (light green). (C) AF-low (dark green). (D) Merge of EOS-pos, AF-high, and AF-low, showing EOS-pos (red) coincident with AF-high (light green). (E) Colocalization between EOS-pos and AF-high (yellow). (F) Merge of AF-high (light green) and AF-low (dark green) showing separate localization. (G) Merge of EOS-pos (red) with AF-low (dark green) showing separate localization. (H) Merge of EOS-pos with AF-high showing coincident localization.
Quantitative Colocalization Analysis
Autofluorescence and SHG.
Manders colocalization coefficients (see Table) indicated that ROI in AF-low and SHG-pos regions colocalized (coefficient of 1; Figs. 8A, 9A; SHG versus AF-low). AF-high and SHG-void regions colocalized, based on analysis of inverted SHG images as described under Methods (coefficient of 1; Figs. 8A, 9A; SHG-void versus AF-high). Hence, AF-low and SHG-pos regions colocalized, but AF-high and SHG-pos regions did not colocalize.
Table.
Summary and Interpretation of Quantitative Colocalization Analyses for Human UVM and CS
|
Comparison Based on
n
= 3 Beams, 6 ROI per Beam, and
n
= 18 ROI per Image Acquisition Pair |
Mcoeff Coefficient, M |
Interpretation of Colocalization in Uveal and Corneoscleral Meshwork Regions |
| AF-low vs. SHG-pos | MAF-low = 1 | AF-low colocalizes with collagen SHG |
| MSHG = 1 | ||
| AF-high vs. SHG-void, using SHG inverted images | MAF-high = 1 | AF-high does not colocalize with collagen SHG |
| MSHG-void = 1 | ||
| SHG vs. EOS-neg, using eosin-inverted images | MEos-neg = 1 | Collagen SHG does not colocalize with eosin-labeled fluorescence from elastin |
| MSHG = 1 | ||
| EOS-pos vs. SHG-void, using SHG-inverted images | MEos-pos = 1 | Eosin-labeled fluorescence from elastin does not colocalize with collagen SHG |
| MSHG-void = 1 |
High, high intensity; low, low intensity; void, no signal.
Figure 8. .
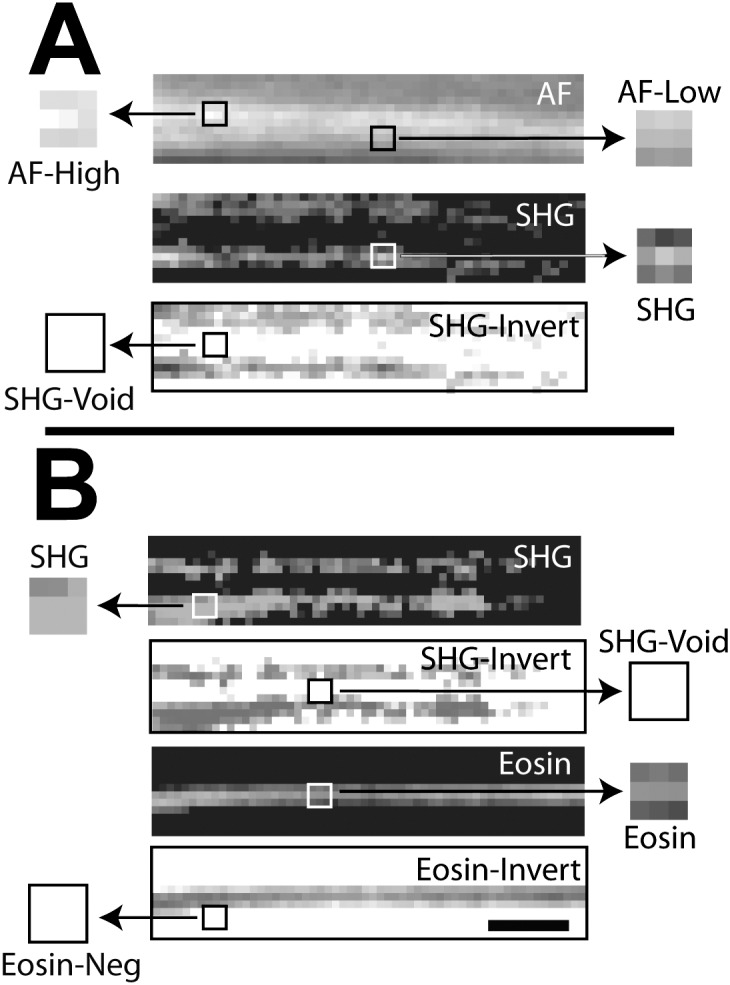
Manders colocalization analysis for autofluorescence (AF) and eosin-labeled fluorescence (Eosin) with second harmonic generation (SHG) in human uveal meshwork. Inverted images (negatives) of eosin (eosin-invert) and SHG (SHG-invert) were generated. Colocalization (Manders coefficient = 1, see Table 1) was seen between regions with (A) high intensity AF (AF-high) and SHG signal voids* (SHG-void), and lower intensity AF (AF-low) and SHG signal (SHG); (B) positive eosin-labeled fluorescence (Eosin) and SHG-Void,* and Eos-neg* and positive SHG signal (SHG). Asterisk: analysis based on inverted images. Scale bars: 2.5 μm.
Figure 9. .
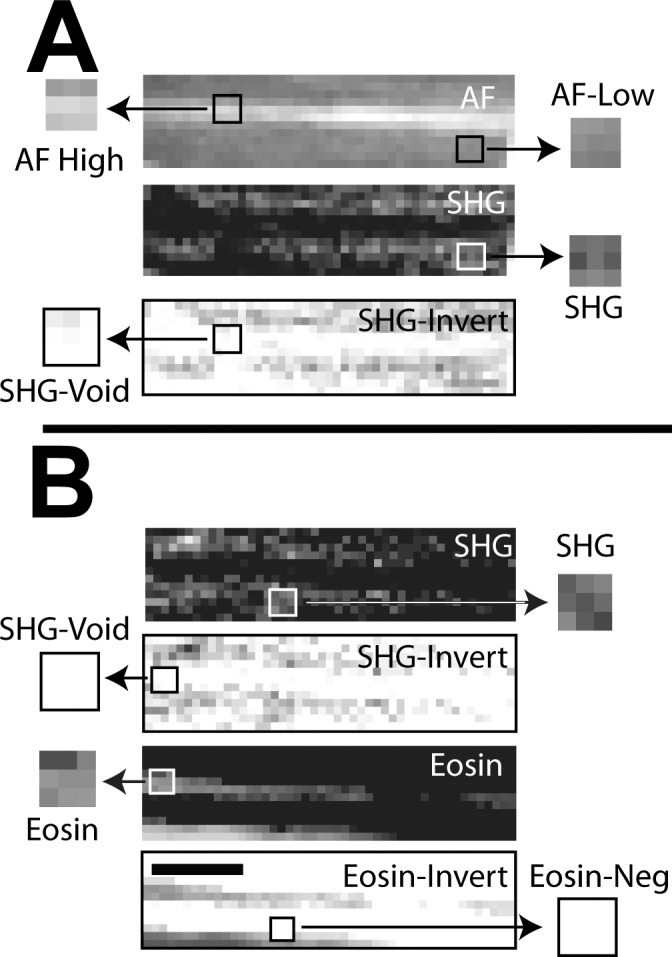
Manders colocalization analysis for autofluorescence (AF) and eosin-labeled fluorescence (Eosin) with second harmonic generation (SHG) in human corneoscleral meshwork. Inverted images (negatives) of eosin (eosin-invert) and SHG (SHG-invert) were generated. Colocalization (Manders coefficient = 1, Table 1) was seen between regions with (A) high intensity AF (AF-high) and SHG signal voids* (SHG-void), and lower intensity AF (AF-low) and SHG signal (SHG); (B) positive eosin-labeled fluorescence (Eosin) and SHG-Void,* and Eos-neg* and positive SHG signal (SHG). Asterisk: analysis based on inverted images. Scale bars: 2.5 mm.
Eosin and SHG.
Mcoeffs (see Table) indicated that ROI in EOS-pos and SHG-void regions colocalized (coefficient of 1; Figs. 8B, 9B; SHG-void versus Eosin). ROI in EOS-neg and SHG-pos regions colocalized (coefficient of 1; Figs. 8B, 9B: SHG versus EOS-neg). Colocalization analysis involving ROI in regions of zero fluorescence (e.g., SHG-void and EOS-neg) required image inversion as described under Methods.
Discussion
Our analysis showed qualitatively and quantitatively that AF-low and SHG-pos regions in the UVM and CS colocalized. Separately, EOS-pos and AF-high fibers colocalized with SHG signal voids. EOS-pos fibers and AF-high fibers colocalized qualitatively. Taken together, the source of AF-high in TM beams is consistent with elastic fibers, as eosin-induced fluorescence represents elastin.23–26 The origin of AF-low in trabecular beams is consistent with collagen. Our in situ findings derived by novel TM, AF imaging and image analysis agree with prior descriptions of trabecular beam cores comprising elastin encased in collagen, and indicate that it is possible to distinguish elastin and collagen in tissue by AF features.4–9,31
We studied tissue verified as viable.1–3 It was possible to analyze structural ECM proteins within trabecular beams and plates of the intact undisrupted 3D tissue as TPEF imaging obviated the need for conventional histologic sectioning. Multimodal imaging and optical sectioning allowed distinct tissue features to be extracted by image analysis. Multiple ROI and tissue region sampling provided appropriate statistical power: colocalization analysis was based on three beams each of two discrete tissue regions of UVM and CS, and 18 ROI samplings per region per image acquisition pair.
Our AF imaging faithfully recapitulated what is known of the fine morphology of the TM as visualized by TPEF.1,2,17,18 In prior studies,17 the TM was imaged in sectioned tissue or trans-sclerally in whole eyes. While these studies did not examine sources of AF in the TM, careful examination of their data revealed collagen SHG signal voids similar to those we have observed.17
Our approach permitted qualitative and quantitative analysis of in situ structure-protein relationships in the human TM. This revealed not just morphology, but also aspects of TM biology, providing a noninvasive alternative to traditional methods of tissue and protein analysis. Our findings agreed with conventional ultrastructural descriptions by immunohistochemistry or electron microscopy with immunogold labeling for elastin and collagen,4–9,31 in which collagen of trabecular beams and lamellae were observed surrounding an elastin core.5,31 Our image analysis of the same structures linked AF-high with elastin fibers in beam cores, and AF-low with collagen surrounding the elastin cores. Collagen visualization by SHG is well-described in other biological systems.32–34 Other fluorophores, such as melanin,12 may also contribute to TM AF and may be studied by this approach too.
We would like to have added to our colocalization analysis immunofluorescence data from antibody-directed collagen and elastin labeling. In our experience, however, in situ antibody-directed elastin and collagen labeling has been difficult to achieve consistently enough to support the precise qualitative and quantitative analysis we have sought to perform, as has been noted.27 Likely contributors to this difficulty are the challenge of antibody-labeling thick, whole, unsectioned tissue; poor antibody penetration of intact beam and plate structures despite detergent-assisted permeabilization; nonspecific antibody tissue-labeling that is indistinguishable from AF; confounding background fluorescence from fixatives making exogenous and endogenous fluorescence indistinguishable; and difficulty attaining precise tangential histologic sections of the TM. Conversely, eosin dye easily penetrated the TM, producing consistent and precise labeling with minimal nonspecific staining. SHG analysis required no exogenous labeling and permitted signal-positive and signal-negative tissue regions to be distinguished precisely during colocalization analysis.
We avoided performing quantitative colocalization analysis between AF and eosin in the same eosin-labeled tissue as the emission spectra for AF and eosin potentially overlapped. Nevertheless, separately, AF-high in tissue unlabeled with eosin, and EOS-pos labeling in eosin-labeled tissue quantitatively colocalized with SHG signal voids. Qualitatively, AF-high and EOS-pos labeling coincided in the same tissue. This indicated correspondence between AF-high and EOS-pos labeling in TM elastic fibers.
Our goal was to identify potential sources of AF heterogeneity in multiphoton human TM imaging.1,2 The approach we describe here offers novel means to qualitatively and quantitatively study the structure and biological composition of the TM. This analysis can be performed in situ on the submicron scale, and may be useful for noninvasive evaluation of the TM.12,22–26 Similar AF imaging is already performed clinically to assess the retina.10 Our findings take this concept further by proposing that AF features of the TM may be deconstructed to reveal important clues about ECM structure and composition. When applying TPEF to tissue and in vivo, careful titration of laser power and exposure time will be necessary to avoid thermal damage to pigmented tissues, such as the TM.
In the future, we seek to study human glaucomatous eyes to assess how fine morphology and ECM proteins are affected by disease. Animal models with known ECM mutations are further candidates.13 Previous comparisons of glaucomatous and nonglaucomatous TM have yielded conflicting reports of pore size,31 plaque material,5,31 or extracellular matrix material accumulation,5 possibly caused by methodologic issues. TPEF imaging of AF and SHG exploit endogenous tissue signals without requiring exogenous tissue labeling, fixation, permeabilization, or histologic sectioning, and thus carry particular advantages for addressing these complex questions.
Acknowledgments
Supported by National Institutes of Health, Bethesda, MD, Grants EY020863 (JCHT), EY03040 (Doheny Vision Research Institute Imaging Core), 1S10RR024754 (USC Multiphoton Core), and a Kirchgessner Foundation Research Grant (JCHT), American Glaucoma Society Mentoring for Physician Scientists Award and Young Clinician Scientist Award (JCHT), and Career Development Award from Research to Prevent Blindness (JCHT), and an unrestricted grant from the Research to Prevent Blindness, Inc., New York, New York.
Disclosure: A.S. Huang, None; J.M. Gonzalez Jr, None; P.V. Le, None; M. Heur, None; J.C.H. Tan, None
References
- 1. Tan J, Gonzalez J, Hamm-Alvarez S, Song J. In situ autofluorescence visualization of human trabecular meshwork structure. Invest Ophthalmol Vis Sci 2012; 53: 2080–2088 [DOI] [PMC free article] [PubMed] [Google Scholar]
- 2. Gonzalez J, Heur M, Tan J. Two-photon immunofluorescence characterization of the trabecular meshwork in situ. Invest Ophthalmol Vis Sci. 2012; 53: 3395–3404 [DOI] [PMC free article] [PubMed] [Google Scholar]
- 3. Gonzalez J, Hamm-Alvarez S, Tan J. Analyzing live cellularity in the human trabecular meshwork. Invest Ophthalmol Vis Sci. 2013; 52: 1039–1047 [DOI] [PMC free article] [PubMed] [Google Scholar]
- 4. Lutjen-Drecoll E, Shimizu T, Rohrbach M, Rohen J. Quantitative analysis of ‘plaque material' in the inner- and outer wall of Schlemm's canal in normal and glaucomatous eyes. Exp Eye Res. 1986; 42: 443–445 [DOI] [PubMed] [Google Scholar]
- 5. Hann C, Springett M, Wang X, Johnson D. Ultrastructural localization of collagen IV, fibronectin, and laminin in the trabecular meshwork of normal and glaucomatous eyes. Ophthalmic Res. 2001; 33: 314–324 [DOI] [PubMed] [Google Scholar]
- 6. Gong H, Trinkaus-Randall V, Freddo T. Ultrastructural immunocytochemical localization of elastin in normal human trabecular meshwork. Curr Eye Res. 1989; 8: 1071–1081 [DOI] [PubMed] [Google Scholar]
- 7. Rohen J. Why is intraocular pressure elevated in chronic simple glaucoma? Ophthalmology. 1983; 90: 758–765 [DOI] [PubMed] [Google Scholar]
- 8. Murphy C, Yun A, Newsome D, Alvarado J. Localization of extracellular proteins of the human trabecular meshwork by indirect immunofluorescence. Am J Ophthal. 1987; 104: 33–43 [DOI] [PubMed] [Google Scholar]
- 9. Marshall G, Konstas A, Lee W. Immunogold ultrastructural localization of collagens in the aged human outflow system. Ophthalmology. 1991; 98: 692–700 [DOI] [PubMed] [Google Scholar]
- 10. Huang A, Kim L, Fawzi A. Clinical characteristics of a large choroideremia pedigree carrying a novel CHM mutation. Arch Ophthalmol. 2012; 130: 1184–1189 [DOI] [PMC free article] [PubMed] [Google Scholar]
- 11. Kelley J. Autofluorescence of drusen of the optic nerve head. Arch Ophthalmol. 1974; 92: 263–264 [DOI] [PubMed] [Google Scholar]
- 12. Schenke-Layland K. Non-invasive multiphoton imaging of extracellular matrix structures. J Biophoton. 2008; 1: 451–462 [DOI] [PMC free article] [PubMed] [Google Scholar]
- 13. Dai Y, Lindsey J, Duong-Polk X, Nguyen D, Hoffer A, Weinreb R. Outflow facility in mice with a targeted type I collagen mutation. Invest Ophthalmol Vis Sci. 2009; 50: 5749–5753 [DOI] [PMC free article] [PubMed] [Google Scholar]
- 14. Steinhart M, Cone F, Nguyen C, et al. Mice with an induced mutation in collagen 8A2 develop larger eyes and are resistant to retinal ganglion cell damage in an experimental glaucoma model. Mol Vis. 2012; 18: 1093–1106 [PMC free article] [PubMed] [Google Scholar]
- 15. Vahedi K, Alamowitch S. Clinical spectrum of type IV collagen (COL4A1) mutations: a novel genetic multisystem disease. Curr Opin Neurol. 2011; 24: 63–68 [DOI] [PubMed] [Google Scholar]
- 16. Thorleiffson G, Magnusson K, Sulem P, et al. Common sequence variants in the LOXL1 gene confers susceptibility to exfoliation glaucoma. Science. 2007; 317: 1397–1400 [DOI] [PubMed] [Google Scholar]
- 17. Ammar D, Lei T, Gibson E, Kahook M. Two-photon imaging of the trabecular meshwork. Mol Vis. 2010; 16: 935–944 [PMC free article] [PubMed] [Google Scholar]
- 18. Ammar D, Lei T, Masihzadeh O, Gibson E, Kahook M. Trans-scleral imaging of the human trabecular meshwork by two-photon microscopy. Mol Vis. 2011; 17: 583–590 [PMC free article] [PubMed] [Google Scholar]
- 19. Johnson A, Ammar D, Kahook M. Two-photon imaging of the mouse eye. Invest Ophthalmol Vis Sci. 2011; 52: 4098–4105 [DOI] [PMC free article] [PubMed] [Google Scholar]
- 20. Aptel F, Olivier N, Deniset-Besseau A, et al. Multimodal non-linear imaging of the human cornea. Invest Ophthalmol Vis Sci. 2010; 51: 2459–2465 [DOI] [PubMed] [Google Scholar]
- 21. Teng S, Tan H, Peng J, et al. Multiphoton autofluorescence and second-harmonic generation imaging of the ex vivo porcine eye. Invest Ophthalmol Vis Sci. 2006; 47: 1216–1224 [DOI] [PubMed] [Google Scholar]
- 22. Williams R, Zipfel W, Webb W. Interpreting second-harmonic generation images of collagen I fibrils. Biophysical J. 2005; 88: 1377–1386 [DOI] [PMC free article] [PubMed] [Google Scholar]
- 23. Goldstein D. The fluorescence of elastic fibers stained with eosin and excited by visible light. Histochemical J. 1969; 1: 187–198 [DOI] [PubMed] [Google Scholar]
- 24. Huntington H. Autofluorescence of eosinophilic substances. Arch Pathol Lab Med. 1986; 2: 93 [PubMed] [Google Scholar]
- 25. Deeb S, Nesr K, Mahdy E, Badawey M, Badei M. Autofluorescence of routinely hematoxylin and eosin-stained sections without exogenous markers. Afr J Biotech. 2008; 7: 504–507 [Google Scholar]
- 26. Heo Y, Song H. Characterizing cutaneous elastic fibers by eosin florescence detected by fluorescence microscopy. Ann Dermatol. 2011; 23: 44–52 [DOI] [PMC free article] [PubMed] [Google Scholar]
- 27. Hann C, Fautsch M. The elastin fiber system between and adjacent to collector channels in the human juxtacanalicular tissue. Invest Ophthalmol Vis Sci. 2011; 52: 45–50 [DOI] [PMC free article] [PubMed] [Google Scholar]
- 28. Manders E, Verbeek F, Aten J. Measurement of colocalization of objects in dual color confocal images. J Microscopy. 1993; 169: 375–382 [DOI] [PubMed] [Google Scholar]
- 29. Zinchuk V, Zinchuk O, Okada T. Quantitative colocalization analysis of multicolor confocal immunofluorescence microscopy images: pushing pixels to explore biological phenomena. Acta Histochem Cytochem. 2007; 40: 101–111 [DOI] [PMC free article] [PubMed] [Google Scholar]
- 30. Maini R, Aggarwal H. A comprehensive review of image enhancement techniques. J Computing. 2010; 2: 8–13 [Google Scholar]
- 31. Johnson M. What controls aqueous humour outflow resistance? Exp Eye Res. 2006; 82: 545–557 [DOI] [PMC free article] [PubMed] [Google Scholar]
- 32. Chen J, Lee A, Zhao J, et al. Spectroscopic characterization and microscopic imaging of extracted and in situ cutaneous collagen and elastic tissue components under two-photon excitation. Skin Res and Technol. 2009; 15: 418–426 [DOI] [PubMed] [Google Scholar]
- 33. Zoumi A, Yen A, Tromberg B. Imaging cells and extracellular matrix in vivo by using second-harmonic generation and two-photon excited fluorescence. Proc Natl Acad Sci U S A. 2002; 99: 11014–11019 [DOI] [PMC free article] [PubMed] [Google Scholar]
- 34. Konig K, Riemann I. High-resolution multiphoton tomography of human skin with subcellular spatial resolution and picosecond time resolution. J Biomed Optics. 2003; 8: 432–439 [DOI] [PubMed] [Google Scholar]


