

Abstract
Purpose.
To develop and validate a novel automated system to assess ocular redness (OR) in clinical images.
Methods.
We developed a novel software that quantifies OR in digital images based on a mathematic algorithm using a centesimal continuous scoring scale. Subsequently, we conducted a study to validate the scores obtained with this system by correlating them with those obtained by two physicians using two image-based comparative subjective scales, the Efron and the Validated Bulbar Redness (VBR) grading scales. Additionally, we evaluated the level of clinical agreement between the Ocular Redness Index (ORI) score and the two image-based methods by means of the Bland-Altman analysis. Main outcome measures included correlation and level of agreement between the ORI score, Efron score, and the VBR score.
Results.
One hundred and two clinical photographs of eyes with OR were evaluated. The ORI scores significantly correlated with the scores obtained by the two clinicians using the Efron (Observer 1, R = 0.925, P < 0.001; Observer 2, R = 0.857, P < 0.001), and VBR (Observer 1, R = 0.830, P < 0.001; Observer 2, R = 0.821, P < 0.001) scales. The Bland-Altman analysis revealed levels of disagreement of up to 30 and 27 units for the ORI–Efron and ORI–VBR score comparisons, respectively.
Conclusions.
The ORI provides an objective and continuous scale for evaluating ocular injection in an automated manner, and without need for a trained physician for scoring. The ORI may be used as a new alternative for objective OR evaluation in clinics and in clinical trials.
Keywords: ocular redness, conjunctival injection, ocular surface, ocular symptoms
In this study, we present and validate an automated method to assess ocular redness in clinical images. This system is based on a continuous, centesimal scale, and employs a computer algorithm that objectively scores redness without need for a trained physician.
Introduction
Conditions affecting the ocular surface are the most frequent underlying reasons for ophthalmologic consultations, and among these, conjunctivitis (infectious, allergic), blepharitis, traumatic abrasions, and dry eye disease are the most frequent.1–4 Ocular redness (OR) is caused by reactive dilation of conjunctival blood vessels and is one of the most consistent signs of ocular response to pathologic stimuli.5
Assessment of OR can be an important component in evaluation of the patient with ocular surface disorders and a patient's response to therapy. Several methods have been described to assess OR; however, those used most frequently by ophthalmologists are based on simple ordinal scales (e.g., mild, moderate, severe; or 0–4 grading schemes), which are easy to use, intuitive, but also highly subjective. Another method for assessing OR that is used in the clinical trial setting involves image-based comparative grading scales. These scales consist of a series of ‘standardized' images representing different degrees of ocular injection, which are used for comparison to a patient's conjunctiva.6,7 Since OR evaluation using image-based comparative scales relies on an observer's judgment, and involves a high degree of subjectivity, this technique is also prone to imprecision. Other methods to assess OR include objective methods that evaluate the chromatic characteristics of the ocular surface or computer-based systems capable of analyzing OR in photographs.5,7–12 However, lack of practicality or limited access to required equipment such as spectrophotometers, specialized video cameras, and computer software has prevented their generalized adoption in the clinical or research setting.
Our aim in this study was to design a system that addresses the most common obstacles clinicians face in quantifying OR in a controlled and systematic way. We determined that this assessment system needs to be objective, leaving minimal room for subjectivity, must use a consistent and inferable scoring system, and should be easy to apply in clinical settings with differing capabilities. We also sought to develop a method that could be used by anyone, without the need for special training, and permit the facility to analyze images acquired with different photographic devices or in different file formats. Finally, we sought to design a method that could be used in varying locations, making available one universal grading system for use by several institutions, clinicians, and investigators.
Herein, we present and validate the Ocular Redness Index (ORI), a novel computer-based system to objectively assess OR in clinical photographs in a simplified and automated way.
Materials and Methods
This study was conducted at the Cornea Service of the Massachusetts Eye and Ear Infirmary (MEEI), Boston, Massachusetts, and was approved by the MEEI institutional review board. Research was conducted in accordance with the requirements of the Health Insurance Portability and Accountability Act, and the tenets of the Declaration of Helsinki.
Photographs
We selected clinical photographs of patients with diseases of the ocular surface from our records; primarily, dry eye and allergic conjunctivitis. Photographs of nasal conjunctivae with varying degrees of OR were analyzed. All photographs were acquired with a standard protocol using the BQ-900/IM-900 system (Haag-Streit, Koeniz, Switzerland) at ×10 magnification. Patients were instructed to gaze laterally, while eyelids were held open, to reveal the maximum amount of nasal conjunctiva. The conjunctiva was centered in the frame of the image, which included the corneal limbus, medial canthus, and both lid margins.
Clinical Scoring of Conjunctival Photographs
Two clinicians scored each photograph in a masked fashion, using the Efron grading scale (Efron) and the Validated Bulbar Redness grading scale (VBR).13,14 Both scales consist of a set of five images illustrating different degrees of OR, ranging from normal to severe, and each image is assigned a value in an order of ascending severity. Both observers scored the images in the same physical space, with the same source of illumination. There was no time limit for these observers to complete the evaluation of the photographs. Two computer monitors were used simultaneously, one to display the grading scales and a second to display the clinical photographs. The same screen color and brightness parameters were used for all scoring sessions. Scoring of photographs was performed in two different sessions per observer, one per scale, to avoid ‘sensitization' by a previously visualized photograph.
Digital Scoring of Conjunctival Photographs
A third observer (nonclinician) scored the same set of photographs previously evaluated by the two clinicians using a computer-based system. This system is based on a software developed in Java as a series of plug-ins for the widely available image-processing platform ImageJ (a free image processing and analysis software developed by National Institute of Health, Bethesda, MD) that can be installed on any personal computer.15 Once the image file is opened with ImageJ, a white-balance function is made available to the operator to equalize the colors in the image, or, in the case of a series of images, to standardize the color of all images in the presence of a white reference mark.
For this study, photographs were obtained from clinical records and therefore lacked a white reference mark. Because of this, the observer selected a white spot in the image as a reference mark. Next, the observer selected the conjunctival area of interest using the provided seven-point region of interest (ROI) selection tool so as to avoid lids, cornea, and other areas not intended for scoring. In this study, all the conjunctival area exposed in the photographs was included in the ROI, with the exception of the caruncle. However, the software allows the observer to stretch the selection tool, and cover any region predetermined by a particular protocol. Finally, after the selection was made, the observer was able to obtain the redness score on a continuous centesimal (0–100) scale, with the strike of a key. Once the file was loaded, it took approximately 30 seconds to evaluate each image.
Software Algorithm
White-Balance Correction of Images.
The purpose of white-balance correction is to remove the unrealistic color cast created by different lighting conditions during image acquisition (Fig. 1). In our study, white-balance correction was performed based on the ROI selection made by the observer using ImageJ's ROI tools (as described above). The user selected, as a reference, a small region within the image, which did not contain blood vessels and was primarily white. The user was also advised to avoid choosing areas with specular reflections as the white reference (except for rare cases without a single white area in the image). The white-balance correction was then applied using the Von Kries approach.16 First, a luminous gain is calculated using the white reference region selected by the user, this gain is defined as:
 |
where HSV refers to the HUE, saturation, and value color space.17 V indicates the value (i.e., the amount of blackness within the color), and Avg is the averaged RGB (red, green, blue) value in the white reference selection.18 HSV.v is the value component after Avg is converted to HSV space. Finally, every pixel in the image is multiplied by the gain to achieve the white-balance–corrected image (Fig. 1). Of note, our system was also designed to function with a white reference-marked photograph (e.g., incorporation of a white strip to the photograph at the time of acquisition), which, if added to photographs from different centers would render the white-balance process more accurate overall.
Figure 1.

(A) Shows the original clinical photograph of a patient before undergoing white-balance correction. (B) Shows the same photograph after white-balance correction is applied to the original image; color adjustment is achieved after this initial step.
Redness Quantification of Images.
After white-balance correction, the observer used the specially designed selection tool to define the conjunctival area to score. This tool is a trapezoid ROI selection tool with seven control points connected by B-spline (basis spline) curves (Fig. 2). This program reads the RGB values of each pixel in the selection and converts it to HSV space, where the value component is defined as:
 |
The saturation component is given by:
 |
 |
The HUE component is given by:
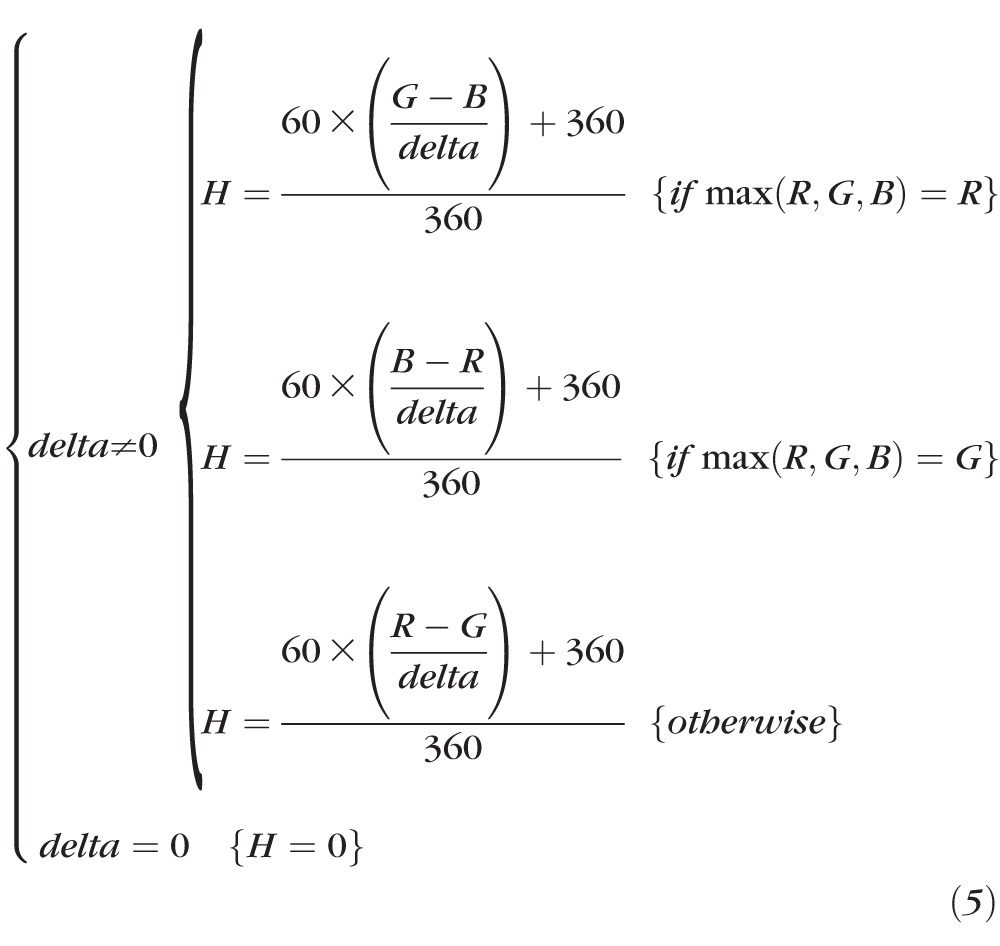 |
Then the HUE value is mapped from [0, 360] to [0, 1] using a parabola curve (Fig. 3). The final redness value is calculated as:
 |
All pixels with specular reflection are excluded from redness calculation (by excluding pixels where all three values, R, G, and B, are above 220), since specular reflections do not demonstrate true colors and artificially drag the redness score down. Originally the V (blackness) value was included in the redness calculation formula (redness = H × S × V), where V evaluates how pure (or dark) the red color is. However, after several tests, the V value was removed from the formula since brightness or darkness in the red color of the vessels did not ultimately determine the degree of OR. The redness score was set within the range of [0, 1], as both the H and S values were within the range of [0, 1], where zero indicates that there is absolutely no redness in the selected area, and one indicates the area is completely red. The software was programmed to average redness from all the pixels within the selected area to obtain a composite score from the region of interest. Next, we remapped the redness score from [0, 1] to [0, 100] for the practical purpose of obtaining a centesimal scale. Finally, since there are no absolute cases in clinical practice, we incorporated a finite superior limit to the scale. We selected, from the photographs with severe redness, the image with more OR, and set its score as the superior limit of 100. All images with equal or more redness than this case will then be scored as 100, while images with a lesser redness score will be mapped between this case [100] and zero [0] (Fig. 2).
Figure 2.

(A) Shows the left eye of a patient after the ROI selection tool has been adjusted to the area to evaluate, and the OR score (10.90) has been retrieved. (B) Shows the ROI selection tool and the OR score obtained in the right eye of a patient with a higher degree of hyperemia (score, 61.07).
Figure 3.

Parabola curve used to map the HUE value from [0, 360] to [1, 0], with a final redness value calculated as redness = H × S.
Statistical Analysis
First, we calculated the correlation of the ORI scores with the scores obtained by each of the two clinicians through the Efron and VBR grading scales, by means of the Spearman's correlation coefficient (r). Second, we assessed the level of agreement between each of the image-based scales and the ORI using Bland-Altman analysis to compare the new technique to the established ones.18 However, in order to compare two medical methods of measurement with the Bland-Altman analysis it is necessary that both methods use the same scale. Of the three studied methods used to evaluate OR, only the Efron scale is not based on a centesimal (0–100) scale, we selected this scale because it consists of a more extensive visual scale than other image-based scales. It is comprised of five categories, which are representative of levels of clinical redness similar to the five categories in the VBR scale (i.e., normal, mild, moderate, severe, and very severe). We transformed the Efron scores to centesimal values using the values in the VBR for the corresponding image, that is: 0, 1, 2, 3, 4 for 10, 30, 50, 70, and 90, respectively. Statistical differences among the scores' means were evaluated using the Kruskal-Wallis and Dunn's test for multiple comparisons.
Statistical significance was set with a P value of less than 0.05. Statistical software SPSS, Version 18.0 (SPSS Inc., Chicago, IL) and GraphPad Prism 5.0 (GraphPad Software, San Diego, CA) were used to analyze the data.
Results
We analyzed 102 clinical photographs with different degrees of ocular injection. Conjunctival redness scores obtained using the three methods detailed above expressed as mean ± SEM, as follows: Observer 1, Efron 1.96 ± 0.1, VBR 46.3 ± 2.5; Observer 2, Efron 1.91 ± 0.1, VBR 47.3 ± 2.3; Observer 3, ORI 47.4 ± 2.4. After conversion to centesimal values, Efron scores were as follows: Observer 1, 48.2 ± 2.1, and Observer 2, 49.0 ± 2.0. There were no statistically significant differences between the means of the ORI and the VBR or Efron scores obtained by the two clinicians (P = 0.60).
We found a strong, positive, and statistically significant correlation between the Efron and ORI scales: Observer 1, R = 0.925, P < 0.001; Observer 2, R = 0.857, P < 0.001; and between the VBR and ORI scales: Observer 1, R = 0.830, P < 0.001; Observer 2, R = 0.821, P < 0.001 (Fig. 4).
Figure 4.

Scatterplots showing the scores obtained with the three different methods for scoring OR. (A) Shows the ORI scores and the Efron scores obtained by observer 1. (B) Shows the ORI scores and Efron scores obtained by observer 2. (C) shows the ORI scores and the scores obtained using the VBR by observer 1. (D) Shows the ORI scores and VBR scores obtained by observer 2. Obs, Observer.
We used the VBR and the converted Efron centesimal scores to compare mean differences between image-based grading scales and the ORI with the Bland-Altman method. This analysis indicated that the 95% limits of agreement between Efron and ORI ranged from −28.9 to 27.3 (bias −0.8) for Observer 1, and from −30.2 to 27.0 (bias −1.6) for Observer 2. The 95% limits of agreement between the VBR and ORI ranged from −19.4 to 21.7 (bias 1.2) for Observer 1, and from −26.6 to 26.9 (bias 0.2) for Observer 2 (Fig. 5).
Figure 5.

Bland-Altman plots showing the limits of agreement and bias between the different methods used to assess OR. (A) ORI-Efron, observer 1; (B) ORI-Efron, observer 2; (C) ORI-VBR, observer 1; (D) ORI-VBR observer 2. The dotted lines represent the upper and lower limits of agreement between the two methods (95% of the differences between the two methods lie within these limits). The continuous line shows the bias for the comparison between the two methods shown (mean difference between the scores obtained with the two methods).
Interestingly, the Bland-Altman comparison of the VBR and Efron scores also showed wide limits of agreement, meaning that neither method scored consistently the same image. Additionally, the bias for this comparison was, in general, higher than the bias resulting from comparing the ORI with the image-based scales. The 95% intraobserver limits of agreement between VBR and Efron ranged from −29.8 to 25.9 (bias −2.0) for Observer 1, and from −25.2 to 21.7 (bias −1.8) for Observer 2. Interobserver limits of agreement between Observers 1 and 2 for VBR ranged from −27.1 to 25.1 (bias −1.0), and for Efron, from −22.1 to 20.6 (bias −0.8) (data not shown).
Discussion
In this study, we present a new method to objectively grade OR in clinical images using a system that employs a specially designed computer-interface to evaluate OR in photographs of human eyes. With this method, ORI, we were able to score OR in photographs acquired under different conditions and by different personnel at our clinic. We demonstrated our ORI scoring method to be intuitive, efficient, and user friendly, allowing evaluation of a large number of images in a short period of time. The software effectively assigned a score, in a (finite) centesimal scale, to images showing a wide range of OR.
The ORI performed well when evaluating OR, as revealed by the lack of significant differences (Kruskall-Wallis test) and low bias (Bland-Altman analysis) between the mean redness scores among the three scaling methods studied. Additionally, this was supported by a strong and statistically significant correlation between the ORI and the two image-based scales scores. However, the Bland-Altman analyses revealed that neither of the two image-based scales consistently provided matching individual scores for a given image when compared with the ORI scores (wide limits of agreement), with differences of up to 30 units in a centesimal scale. Interestingly, when the scores from the two studied image-based scales were compared by Bland-Altman analysis, they also did not consistently render similar scores. This observation maintained no matter whether the comparison was made between the VBR and Efron scores obtained by the same observer, or when comparing scores obtained with the same scale by two different observers.
This study has some limitations, including those related to its retrospective design. The ORI is designed to function with a reference mark placed into each photograph at the time of acquisition, which allows for white balance standardization of all photographs. However, in this study the photographs evaluated were obtained from clinical records and were, thus, without white reference marks placed at the time of acquisition. This added a level of subjectivity when the observer selected a white spot on the images for the purpose of adjusting color balance. Despite this potential source of bias, the scores obtained with the ORI showed high correlation with those obtained using the image-based scoring scales.
Another limitation of this, and any other study evaluating OR, is the fact that no method has, thus far, been recognized as a “gold standard.” For this reason, it is difficult to compare and objectively assess the performance of any new method developed to evaluate OR. While Bland-Altman analysis will reveal both clinical differences and agreement between an accepted method and a new method of measurement, it is impossible to determine which of the two methods is superior without a point of reference or “gold standard.”19–21 Lack of consistency in the units of measurement, from instruments assessing OR, is another major factor precluding reliable comparison between different methods. We chose the VBR and Efron scaling systems to compare with the ORI since these two scales are routinely used in clinical settings and their validity has been previously reported.7,13,14 The VBR method uses a centesimal scale adapted to five categories.13 While the Efron method uses a different scale, it is based on five categories that represent differing levels of clinical redness similar to those of the VBR.12 Therefore, in order for us to be able to perform a Bland-Altman analysis (which requires that the two methods to be compared use the same unit of measurement), we converted the Efron scale to a centesimal scale, based on the similarities of the categories in the two methods.
Image-based scales base their scores on categories (five in the cases of Efron and VBR). In order to assign an image to one category or other, an observer has to arbitrarily choose between the two categories, without the option of a halfway score. Therefore, it is not surprising to find differences of 20 or more units in an image scored by different observers, or by the same observer using two different image-based scales. The disagreements shown by the Bland-Altman analyses appear to reflect the fact that there are 20-unit steps between each category in the studied image-based scales. This illustrates one of the most important characteristics of the ORI, that is, the use of a continuous scoring scale, which permits the assignment of different scores to images with close levels of redness. One of the key advantages of this characteristic of the ORI method is that it is more likely to discriminate clinical changes within the same individual over time, providing a clinical trials investigator with an objective parameter to determine improvement or treatment effectiveness.
In summary, this study demonstrates that the ORI is a reliable method for grading OR even when applied by a nonclinically trained observer. Its algorithm is able to process images with different degrees of redness addressing heretofore common problems related to image acquisition, such as lighting and color imbalances. The use of a centesimal continuous scale of measurement lends simplicity to the clinical interpretation of the results and allows for more objective comparison and analysis of the data obtained. While image-based comparative scales and noncomparative methods based purely on clinical observation remain valid assessment tools for use in the clinic, given their ease of use in this setting, an objective and translatable method of OR assessment of clinical photographs is warranted for controlled studies and comprehensive clinical follow ups.
Acknowledgments
Supported by a grant from the National Institutes of Health (Grant K24 EY019098).
Disclosure: F. Amparo, P; H. Wang, P; P. Emami-Naeini, None; P. Karimian, None; R. Dana, P
References
- 1. Cronau H, Kankanala RR, Mauger T. Diagnosis and management of red eye in primary care. Am Fam Physician. 2010; 81: 137–144 [PubMed] [Google Scholar]
- 2. Sethuraman U, Kamat D. The red eye: evaluation and management. Clin Pediatr (Phila). 2009; 48: 588–600 [DOI] [PubMed] [Google Scholar]
- 3. Wirbelauer C. Management of the red eye for the primary care physician. Am J Med. 2006; 119: 302–306 [DOI] [PubMed] [Google Scholar]
- 4. Leibowitz HM. The red eye. N Engl J Med. 2000; 343: 345–351 [DOI] [PubMed] [Google Scholar]
- 5. Willingham FF, Cohen KL, Coggins JM, Tripoli NK, Ogle JW, Goldstein GM. Automatic quantitative measurement of ocular hyperemia. Curr Eye Res. 1995; 14: 1101–1108 [DOI] [PubMed] [Google Scholar]
- 6. Ishak B, Mohd-Ali B, Mohidin N. Grading of tarsal conjunctiva of young adults in Malaysia. Clin Exp Optom. 2011; 94: 458–463 [DOI] [PubMed] [Google Scholar]
- 7. Schulze MM, Hutchings N, Simpson TL. The use of fractal analysis and photometry to estimate the accuracy of bulbar redness grading scales. Invest Ophthalmol Vis Sci. 2008; 49: 1398–1406 [DOI] [PubMed] [Google Scholar]
- 8. Guillon M, Shah D. Objective measurement of contact lens-induced conjunctival redness. Optom Vis Sci. 1996; 73: 595–605 [DOI] [PubMed] [Google Scholar]
- 9. Duench S, Simpson T, Jones LW, Flanagan JG, Fonn D. Assessment of variation in bulbar conjunctival redness, temperature, and blood flow. Optom Vis Sci. 2007; 84: 511–516 [DOI] [PubMed] [Google Scholar]
- 10. Sorbara L, Simpson T, Duench S, Schulze M, Fonn D. Comparison of an objective method of measuring bulbar redness to the use of traditional grading scales. Cont Lens Anterior Eye. 2007; 30: 53–59 [DOI] [PubMed] [Google Scholar]
- 11. Papas EB. Key factors in the subjective and objective assessment of conjunctival erythema. Invest Ophthalmol Vis Sci. 2000; 41: 687–691 [PubMed] [Google Scholar]
- 12. Fieguth P, Simpson T. Automated measurement of bulbar redness. Invest Ophthalmol Vis Sci. 2002; 43: 340–347 [PubMed] [Google Scholar]
- 13. Efron N, Morgan PB, Katsara SS. Validation of grading scales for contact lens complications. Ophthalmic Physiol Opt. 2001; 21: 17–29 [PubMed] [Google Scholar]
- 14. Schulze MM, Jones DA, Simpson TL. The development of validated bulbar redness grading scales. Optom Vis Sci. 2007; 84: 976–983 [DOI] [PubMed] [Google Scholar]
- 15. Schneider CA, Rasband WS, Eliceiri KW. NIH. Image to ImageJ: 25 years of image analysis. Nat Methods. 2012; 9: 671–675 [DOI] [PMC free article] [PubMed] [Google Scholar]
- 16. Chong HY. The von Kries Hypothesis and a Basis for Color Constancy. In: Proceedings of the International Conference on Computer Vision; October 19, 2007; Rio de Janeiro. 2007: 1–8 [Google Scholar]
- 17. Agoston Max K. Computer Graphics and Geometric Modeling: Implementation and Algorithms. London: Springer-Verlag; 2005. [Google Scholar]
- 18. Poynton CA. Digital Video and HDTV: Algorithms and Interfaces. San Francisco: Elsevier Science; 2003. [Google Scholar]
- 19. Bland JM, Altman DG. Statistical methods for assessing agreement between two methods of clinical measurement. Lancet. 1986; 1: 307–310 [PubMed] [Google Scholar]
- 20. Hanneman SK. Design, analysis, and interpretation of method-comparison studies. AACN Adv Crit Care. 2008; 19: 223–234 [DOI] [PMC free article] [PubMed] [Google Scholar]
- 21. Cecconi M, Rhodes A, Poloniecki J, Della Rocca G, Grounds RM. Bench-to-bedside review: the importance of the precision of the reference technique in method comparison studies–with specific reference to the measurement of cardiac output. Crit Care. 2009; 13: 201 [DOI] [PMC free article] [PubMed] [Google Scholar]