Abstract
Purpose.
The thinning of the precorneal tear film between blinks and tear film breakup can be logically analyzed into contributions from three components: evaporation, flow into the cornea, and tangential flow along the corneal surface. Whereas divergent tangential flow contributes to certain types of breakup, it has been argued that evaporation is the main cause of tear thinning and breakup. Because evaporation is controlled by the tear film lipid layer (TFLL) it should therefore be expected that patterns of breakup should match patterns in the TFLL, and this hypothesis is tested in this study.
Methods.
An optical system is described for simultaneous video imaging of fluorescein tear film breakup and the TFLL. Recordings were made from 85 subjects, including both with healthy and dry eyes. After instillation of 5 μL2% fluorescein, subjects were asked to blink 1 second after the start of the recording and try to maintain their eyes open for the recording length of 30 or 60 seconds.
Results.
Areas of tear film thinning and breakup usually matched corresponding features in the TFLL. Whereas thinning and breakup were often matched to thin lipid, surprisingly, the corresponding lipid region was not always thinner than the surrounding lipid. Occasionally, a thin lipid region caused a corresponding region of greater fluorescence (thicker aqueous layer), due to convergent tangential flow.
Conclusions.
Areas of tear thinning and breakup can generally be matched to corresponding regions of the TFLL as would be expected if breakup is largely due to evaporation. Surprisingly, in some examples, the corresponding lipid area was not thinner and possibly thicker than the surrounding lipid. This indicates that the lipid was a poor barrier to evaporation, perhaps because of deficiency in composition and/or structure. For example, bacterial lipases may have broken down esters into component acids and alcohols, causing a defective TFLL structure with increased evaporation.
Keywords: tear film lipid layer, fluorescein breakup, evaporation, hyperosmolarity
Simultaneous video recordings were made of tear film fluorescein and lipid layer images. It was found that tear film breakup was commonly associated with regions in the lipid layer, indicating a defect in the thickness, structure, and/or composition of the lipid layer.
Introduction
According to the Dry Eye Workshop1 the two core mechanisms of dry eye are “tear film instability” and “tear hyperosmolarity.” Tear film instability is recorded as the time for “breakup” to occur after a blink, either by instilling fluorescein and observing the first dark spot in the fluorescent image2 or by noninvasive observation of distortion/disruption of the tear film surface.3 The use of the term “instability” is probably related to an early model of tear breakup due to Holly4 who noted that water films over a hydrophobic surface can rupture spontaneously when their thickness is reduced to a few hundred micrometers. He therefore proposed that tear breakup was caused when the corneal epithelium became hydrophobic from diffusion of lipid from the tear film lipid layer, TFLL. Holly's model was based on the restricted knowledge at that time of factors such as tear thickness and evaporation rate.4 It is now thought that breakup may be due to a variety of factors5 and that at least some mechanisms, such as thinning due to evaporation, are probably not well described by the term instability. It is suggested that the term “tear film breakup” should be considered as a replacement for the term “tear film instability.”
Tear hyperosmolarity is caused by an increased evaporation rate and/or a reduced aqueous tear production rate,1 and is important for dry eye in two ways. First, it may be used as a test for dry eye by taking a sample of tears from the lower tear meniscus and measuring its osmolarity.6,7 The increase in measured osmolarity in dry eye is typically modest (e.g., from approximately 300 milliosmoles (mOsm)/LmOsm/L in healthy eyes to approximately 330 mOsm/L in many dry eyes with a few above 400 mOsm/L).6 The second importance of hyperosmolarity is that, in dry eyes, much higher levels may be generated in the very thin precorneal tear film than in the relatively thick meniscus8; such high osmolarity can cause ocular surface inflammation and damage.1,9 Liu et al.10 used ocular discomfort ratings in tear breakup compared with ratings from instillation of hyperosmolar solutions to estimate that breakup could raise osmolarity to 800 to 900 mOsm/L. Nichols et al.11 have used fluorescent quenching combined with spectral interferometry to demonstrate a 10-fold reduction in tear thickness after a blink largely due to evaporation (their Fig. 3); correspondingly, osmolarity would be expected to increase approximately 10-fold from 300 to approximately 3000 mOsm/L. Although tear hyperosmolarity and instability (breakup) are described as core mechanisms of dry eye, as if they were independent factors, it is argued below that they often involve the common process of evaporation.
Tear film breakup, which corresponds to a dry spot or very thin tear film over the cornea, is the result of the thinning of the tear film, which occurs after a blink.11,12 This thinning may be analyzed in terms of three contributions.12 The first contribution is an outward flow from the tear film (i.e., evaporation). The second possible contribution, an inward flow into the cornea was not detected by Nichols et al.,12 and it has been argued that osmosis may generate a flow out of the cornea when tear osmolarity is increased by evaporation.13 Therefore, this component is unlikely to cause breakup and will not be considered further. The third contribution comes from flow along the surface of the cornea, which may be called “tangential flow”; if the outflow over some edges of a small square element of tear film exceeds the inflow over other edges, hence, causing thinning, this will be called “divergent tangential flow.”
In a review of tear film thinning between blinks and tear breakup, we argued that tangential flow contributes in certain special cases, at the black line near the tear meniscus, over surface elevations on the cornea, after partial blinks, and from small thick lipid spots in the tear film.5 However, It was argued that most of the observed tear film thinning between blinks is due to evaporation, rather than tangential flow, and that large “pool” breakup regions are the result of evaporation over an extended area. The importance of evaporation (relative to tangential flow) in tear film thinning and breakup is supported by the following five types of evidence. First, there is little tangential flow of the tear film, except for upward flow during the first two seconds after a blink.14 Second, tangential flow should tend to cause thinning of some tear film regions, but thickening of other regions (i.e., a redistribution of tears rather than an overall thinning); however, after excluding the effects of upward drift for the first two seconds after a blink, the tear film after a blink was observed to thin rather than thicken in 73 out of 80 trials, a result indicating a greater contribution of evaporation than of tangential flow.12 A third type of evidence is based on the “self quenching” properties of fluorescein solutions.11 At low concentrations (less than approximately 0.2%) fluorescent efficiency is largely independent of fluorescein concentration, whereas at high concentrations, self-quenching causes fluorescent efficiency to fall inversely with the square of concentration.11 If tear thinning is due to evaporation, then the total amount of fluorescein per unit surface area should remain constant; thus, for low fluorescein concentration for which self-quenching is small, fluorescence should remain relatively constant, but for high fluorescein concentration, self-quenching should cause fluorescence to fall as fluorescein concentration is increased by evaporation. This was the observed result, rather than the result predicted for tangential flow that fluorescence decay (in percentage terms) should be similar at low and high concentrations.11 Fourth, evaporation rate might be expected to be inversely correlated with lipid thickness; correspondingly, tear thinning rate was found to be inversely correlated with lipid thickness, as expected if it is largely due to evaporation.15 Fifth, wearing tight fitting goggles and allowing time for the humidity of the enclosed air to saturate, would be expected to reduce evaporation to low values; correspondingly, goggles greatly reduced the thinning rate of the tear film compared with that in unobstructed air.16
If tear film thinning and breakup are largely due to evaporation rather than tangential flow, and if evaporation is controlled by the TFLL, then a correlation between the pattern of tear film breakup and images of the TFLL is to be expected. Therefore, an optical system for simultaneous video imaging of fluorescein tear film breakup and the TFLL was developed and a qualitative study of the correlation between the two images is described here. Additionally, comparison of the two images helps to identify objects in the tear film such as bubbles and large “globs” of lipid, which are sometimes released by a strong blink.
Methods
The (simplified) optical system for simultaneous imaging of tear film fluorescence and the TFLL is shown in Figure 1 and incorporates features of previous systems.17,18 Fluorescein is instilled into the tear film, which is then illuminated with convergent blue light; the light returning from the tear film includes both reflected blue light from the TFLL and green light from fluorescence. This returning light is divided by glass-plate beam splitter B2 (Edmund Optics, Barrington, NJ); one beam is passed through a magenta filter to pass the blue reflected light while blocking the green fluorescent light, whereas the other beam is passed through a 535-nm interference filter to pass the fluorescent light and block the blue reflected light. These two beams are recombined by B3 so that fluorescent and TFLL images are formed side by side on the video sensor sc-A 1000–30 with a resolution of 1032×778 (Basler, Ahrensburg, Germany). Stop S3 controls the relative intensity of the fluorescent image compared with the lipid image. Illumination is derived from a Dolan-Jenner DC-950H fiber optic illuminator via a 5-mm liquid light guide (Edmund Optics). Stop S1, at the focus of L1, limits the illuminated area on the cornea to 4.5-mm diameter, and is used as a focusing aid (the fluorescent and lipid images should be in focus when the edges of the images are in focus). Each image covers a diameter of 480 pixels giving a resolution of 9.4 μm/pixel (thus, providing greater detail than is typically available in fluorescence images). Stop S2 is focused at the center of curvature of the cornea by L2, a 50 mm, f/1.2 Nikkor Camera Lens (B&H, New York, NY); therefore, the rays strike the cornea at normal incidence, so blue reflected rays retrace their paths and form a new image of S2 at the video lens, L3. The video camera (sc-A 1000–30 with a resolution of 1032×778; Basler) is focused on infinity, so the tear film is in focus when it is in the focal plane of L2. Subjects fixated the center of L2. The 475- nm illuminating interference filter and the 535 nm and magenta filters were chosen to reduce “cross talk” between lipid and fluorescent images to below approximately 1%. An additional pathway for monitoring lateral and vertical displacement of the eye, similar to a previous system,19 has been omitted for clarity.
Figure 1.
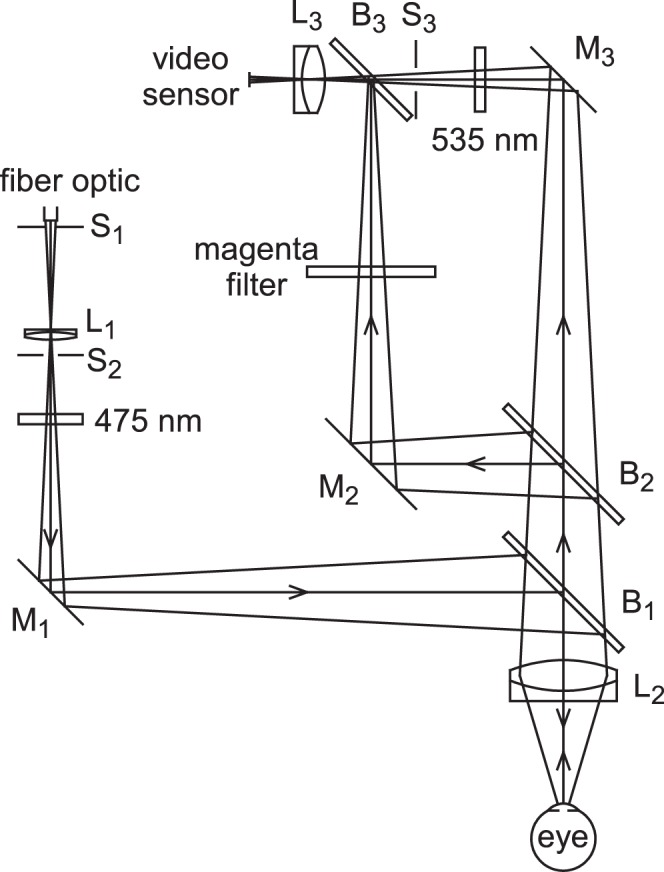
Optical system used for simultaneous video imaging of tear film fluorescence and the TFLL. L, achromatic or multi-element lenses; S, stops; M, front surface mirrors; B, glass plate beam splitters. See text for details.
Subjects and Procedure
The research protocol was approved by the Ohio State University institutional review board in accordance with the Declaration of Helsinki. Informed consent was obtained from each subject at study enrollment. Subjects were required to be noncontact lens wearers of at least 18 years of age. Subjects with a current ocular infection or ocular allergy, or taking a prescription eye medication, or who were currently pregnant or breastfeeding were excluded. Results are for two series of experiments. In Series 1, one video recording of fluorescence and lipid images was made over a 60-second period from each of 40 subjects, with the subjects asked to blink 1 second after the start of the recording and to hold their eyes open for the remainder of the recording or as long as possible. In Series 2, two recordings of 30 seconds were made sequentially from another 45 subjects with a rest period of 2 minutes between recordings (we noted that in Series 1, there were relatively few useful image comparisons and most of these occurred in the first 30 seconds of recording. We thought that taking 2 recordings of 30 seconds each would therefore increase the number of useful comparisons). In Series 2, maximum subject age was restricted to 40 years to reduce the contribution from crystalline lens fluorescence, which was often observed with older subjects (Fig. 7) (it may be noted that crystalline lens fluorescence affected only the fluorescence image, thus, it did not lead to any false correlation between lipid and fluorescence images). For both series, a baseline video recording (10 images, each 0.1 second duration) was made before fluorescein installation, to record autofluorescence from the crystalline lens. To broaden the range of observations, dry eye subjects were not excluded from the two series, but the study was not designed to show differences between dry and healthy eyes. In both series, 5 μL2% fluorescein was instilled giving an initial tear film concentration of approximately 0.9% in a tear volume of 6.2 μL20; even after dilution by additional tear secretion, fluorescein concentration during the recordings was probably above the “critical concentration” for quenching of 0.19%11 so that evaporation and quenching should have caused dimming of fluorescence. After multiple blinks to help distribute the fluorescein evenly, the (first) video recording was started as soon as possible (approximately 1 minute) after instillation. The video recording rate was 10 images per second (exposure duration 0.1 seconds). A program was written to detect the timing and duration of blinks and, if appropriate, to increase the contrast of the fluorescence and/or TFLL images. Images shown here are thought to be representative of informative images, which were in reasonable focus and alignment; it may be noted that many recordings did not provide novel information, partly because breakup may not have occurred, or may have occurred outside or near the edge of the small, 4.5 mm, imaging area. A score of over 22/100 on the Ocular Surface Disease Index (OSDI) questionnaire was used to classify a dry eye condition.21 Out of the 85 subjects, 7 were classified as having dry eye.
Figure 7.
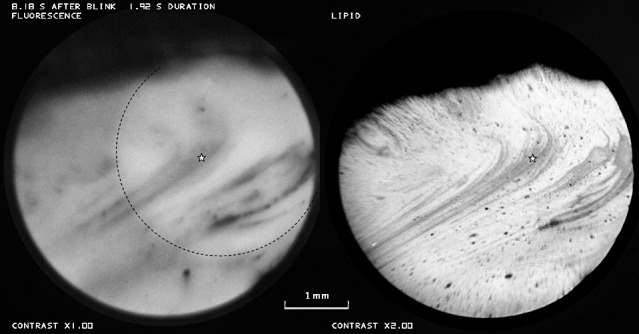
Tear film thinning associated with thin lipid (e.g., in region of star). Dashed line in fluorescence image encloses a brighter region due to lens fluorescence. Healthy tear film, 57-year-old white male.
Results
Thirty-four video recordings were judged to have useful information in showing fluorescence dimming (or brightening) within the observed area, with reasonable alignment and focusing of the eye; images from six subjects, which are illustrative of the main observations, are presented here. In the image pairs presented here, fluorescence and TFLL images are shown at left and right respectively; any increase in displayed contrast of either image is given beneath that image. Images that help with the identification of objects in the tear film such as bubbles will be presented first, followed by figures illustrating the relation between tear film breakup and TFLL images.
Interpretation of the lipid images may be aided by the following considerations of the observed reflected intensity. First, when the lipid surface is relatively smooth, intensity depends on lipid thickness, increasing from minimum at zero thickness to maximum at a quarter wavelength (approximately 80 nm) thickness, see Figure 3 of King-Smith et al.19; lipid thickness was in this range in 94% of measurements15 (however, lipid thickness was not quantified in this qualitative study because of the possible ambiguity and inaccuracy of thickness determination from black-white images19). Second, if the outer lipid surface is severely distorted, some of the returning light may not pass through the camera lens, L3, making the surface appear dark. Third, a convexity or concavity of the surface may make it appear either light or dark if it is either just in front of, or just behind, the focal plane of lens L2, see Figure 5 of King-Smith et al.19
Figure 3.
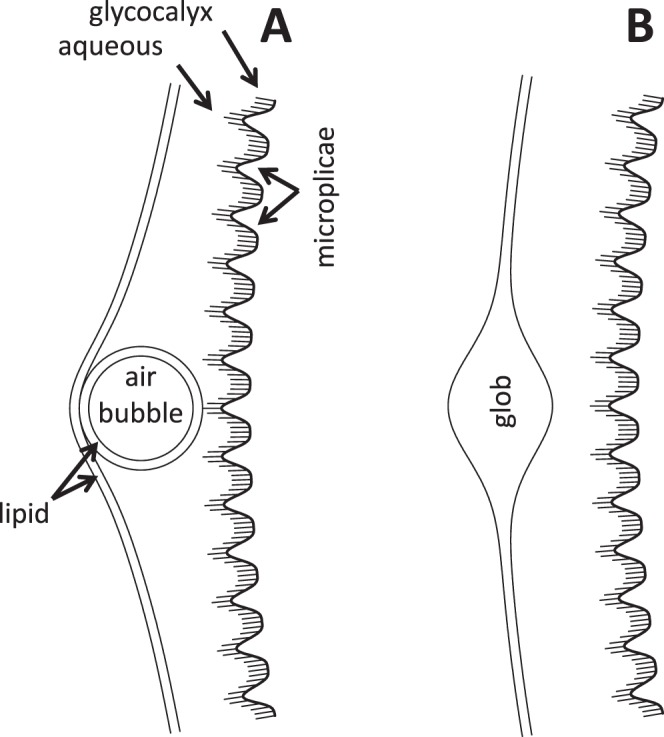
Sections of the tear film (not drawn to scale). (A) Section through a bubble. (B) Section through a lipid “glob.”
Figure 5.
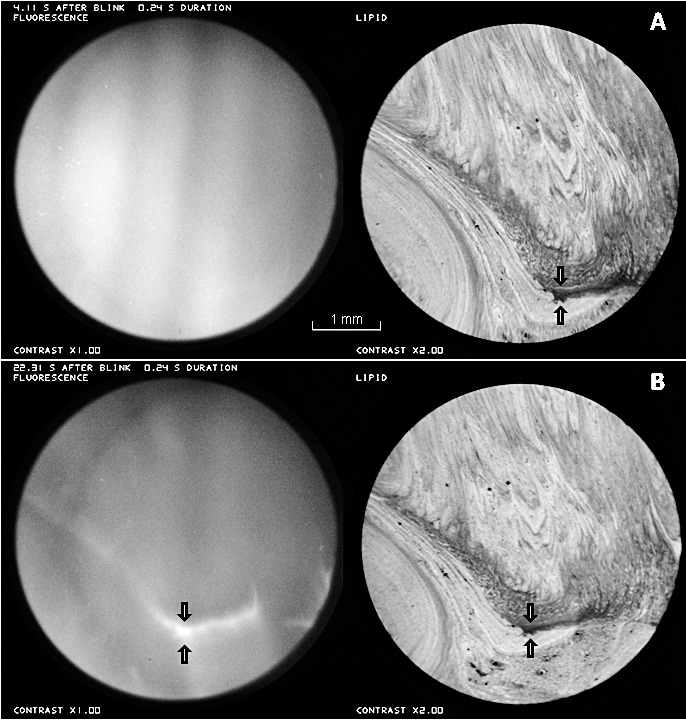
Contraction of the thin lipid between the arrows, in the 18.2 seconds between (A) and (B), causes thickening in the aqueous layer, with a corresponding bright streak between the arrows, in the fluorescence image in (B). Healthy tear film, 25-year-old white male.
Another factor to consider in the interpretation of lipid images is that breakup may cause lipid surface distortion, which then appears as a sort of noninvasive breakup pattern in the lipid image. Thus, it was important to study TFLL images before any detectable fluorescence dimming or in the early stage of tear thinning (slight fluorescence dimming, as in Fig. 6A) before this surface distortion may become apparent in the lipid image.
Figure 6.
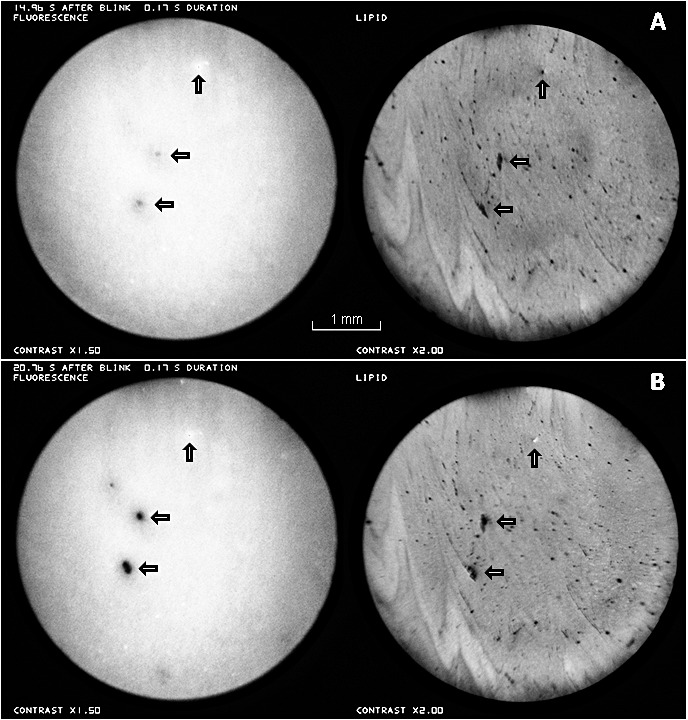
Fluorescein breakup apparently associated with holes or thin lipid in the TFLL (horizontal arrows). A small bubble is indicated by the vertical arrows. (A) Approximately 15 seconds after a blink. (B) Approximately 21 seconds after a blink. Healthy tear film, 27-year-old white female, same subject as in Figure 2. See Supplementary Video S1.
Figure 2A, recorded just after a blink shows the appearance of a bubble near the center of both images. In the fluorescence image, the dark center, corresponding to the air bubble, is surrounded by a brighter ring corresponding to thicker aqueous tears surrounding the bubble as illustrated in Figure 3A. Note that the image of the bubble (which may be stuck to the corneal surface) appears quite sharp, but other details are blurred by the upward movement of the TFLL during the 0.1 second exposure. Figure 2B was recorded in the next video image, 0.1 seconds later, and is interpreted as the appearance after the bubble has burst. In the TFLL image, white (thick) lipid, presumably released from the bubble envelope, is seen spreading upwards and outwards from the original bubble position (a similar lipid image of a bursting bubble has been discussed by King-Smith et al.)5 The divergent tangential flow of lipid, spreading out from the burst bubble, causes a corresponding divergent tangential flow of the underlying aqueous layer, and so causes the observed darkening of fluorescence (thinning) of the aqueous layer.
Figure 2.
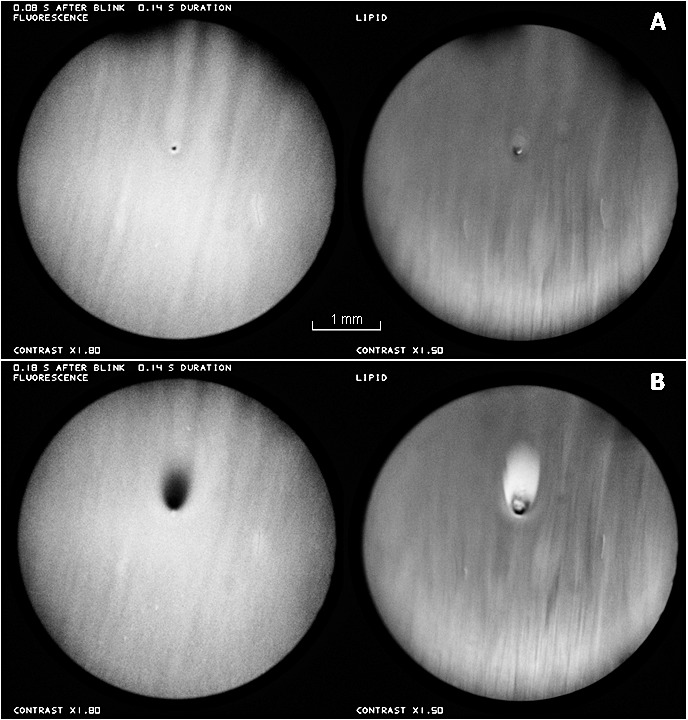
Fluorescence (left) and TFLL (right) images of a bubble just above the center of the images. (A) Just after a blink, before the bubble bursts. Upper eye lashes (out of focus) are seen at the top of this image and in some later images. (B) 0.1 seconds later, after the bubble has burst. Healthy tear film, 27-year-old white female. See end of Supplementary Video S1.
Large thick “globs” of lipid, secreted in the blink process, are shown in Figure 4. Some of the globs are marked by stars in the fluorescein image of Figure 4A, which was recorded just after a blink; fluorescence from these regions may be dim because aqueous is displaced by the thick lipid, as in Figure 3B. At this time, the lipid image is relatively dark, perhaps because the outer surface is rough and so scatters light out of the return optical path, as discussed previously. Figure 4B shows that breakup (arrows) occurred within 4 seconds of the blink apparently triggered by globs. The breakup region is surrounded by a region of higher fluorescence (thicker tear film?) perhaps corresponding to a tangential flow of aqueous squeezed out from under the glob (there is some indication of brighter regions surrounding the globs already in Figure 4A). The subject blinked, presumably because of discomfort, immediately after the images of Figure 4B were recorded.
Figure 4.
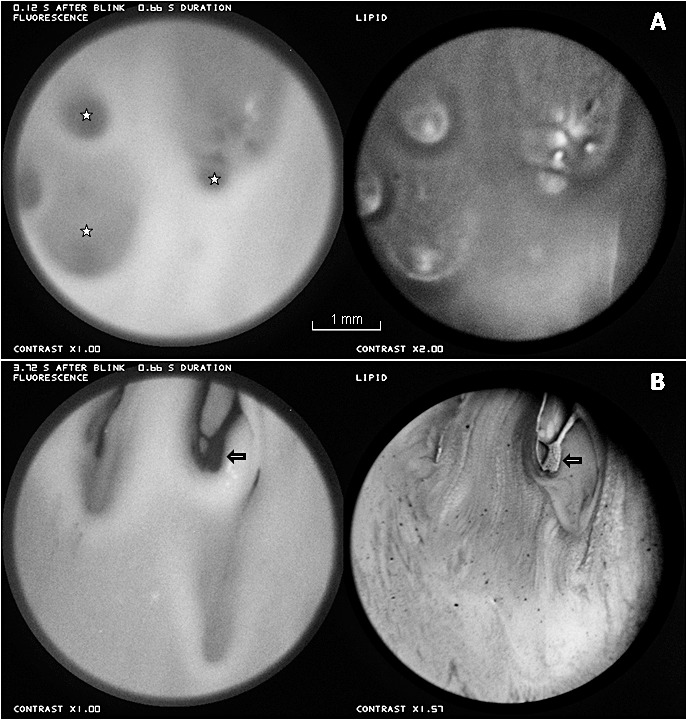
Large thick “globs” of lipid. (A) Just after a blink, globs are marked by stars in the fluorescein image. (B) Approximately 4 seconds later, globs seem to have triggered breakup (arrows). Dry eye condition, 33-year-old white female.
Figure 5 illustrates the development of a bright fluorescent streak corresponding to a dark (thin) region of lipid between the arrows. Over the interval of 18.2 seconds between Figures 5A and 5B, the distance between an upper thin white line in the lipid (upper arrows, more visible in Figure 5A than 5B) and the lower edge of the dark lipid area (lower arrows) decreased 25% from 20 to 15 pixels. This contraction of the lipid layer caused a corresponding convergent tangential flow of the aqueous layer, giving rise to the bright streak in the fluorescence image. One other clear example of tear film thickening under a thin lipid area was observed (images not shown).
Figure 6 shows the development of two breakup spots in the fluorescein images, which seem to be caused by holes or thin lipid in the lipid images (horizontal arrows). In Figure 6A, at approximately 15 seconds after the blink, the incipient fluorescein breakup appears blurred; this is probably not due to defocus, because the dark dot of a bubble in the fluorescein image appears sharp (vertical arrows). At approximately 21 seconds after the blink, Figure 6B, the fluorescein breakup is considerably stronger. To study the dynamics of breakup, each region of fluorescence dimming in Figures 6A and 6B was fitted by a two dimensional Gaussian function of the form
 |
where z(x,y) corresponds to fitted intensity at position x, y, while z0, A, x0, y0, and σ were adjusted for a least squares fit to recorded intensity using SigmaPlot 9.0 (Systat Software; Chicago, IL). The dimming at the center of each breakup region (given by A in Equation 1) in Figure 6A was estimated to be only 22% to 30% of the corresponding dimming in Figure 6B, whereas the time after the blink in Figure 6A was 72% of the time in Figure 6B; thus, dimming was more rapid in the interval between Figures 6A and 6B than in the interval between the blink and Figure 6A.
Figure 7 shows another example where tear film thinning and breakup seem to be associated with thin (dark) lipid (e.g., at the position of the star). As in Figure 6, tear film thinning is inversely correlated with lipid thickness. It may be noted that, as in Figure 6A, the fluorescence image is blurred compared with the lipid image.
The upward arrows in Figure 8 show an arcuate region of breakup in the fluorescence image whose direction and curvature correspond to that in the lipid image. It may be noted that the TFLL in the region of breakup does not seem particularly thin (dark) and does not differ obviously in appearance from surrounding lipid. Inspection of the video recording did not show any detectable divergent flow of the lipid layer, suggesting that the arcuate fluorescence dimming (tear thinning) was due to evaporation rather than tangential flow. Horizontal arrows show breakup corresponding to thin (dark) lipid spots, as in Figure 6. The downward arrow shows a bubble. The large semicircular patch of TFLL, star, was seen to expand during the video recording, and seems similar to patches, described by McDonald,22 generated by lipid “pouring forth” from individual meibomian glands.
Figure 8.
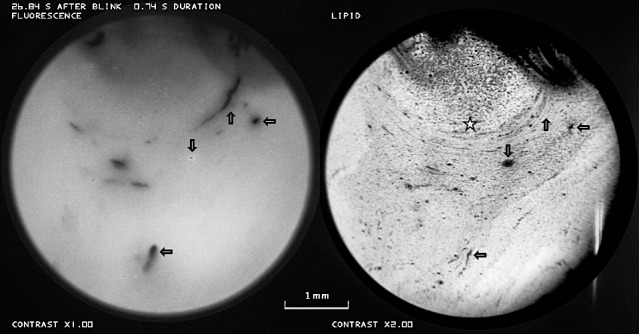
Upward arrows indicate a curved region of breakup in the fluorescence image, which matches the curvature in the lipid image. However this lipid does not differ obviously in appearance from surrounding lipid. Horizontal arrows show breakup corresponding to thin lipid and downward arrows show a bubble. The star marks a semicircular patch of lipid (see text). There is some obstruction by out of focus upper eye lashes. Vertical streak at lower right of this and other TFLL images is an artifact. Healthy tear film, 25-year-old white male. See Supplementary Video S2.
Figure 9 shows another example of tear film thinning and breakup, which is associated with a relatively thick strip (finger?) of lipid between the slanting arrows. The interval between Figures 9A and 9B was 12.6 seconds. A dark dot in the lipid images lies between the slanting arrows and a light spot is indicated by downward arrows. Any contribution to tear thinning from divergent tangential flow was small; the distance between the dark dot and light spot did not increase measurably, and the width of the lipid strip increased only approximately 10%. However strong dimming of the fluorescein image was observed; in the area of the square (20×20 pixels) in Figure 9B, the intensity was reduced to only 17% of the fluorescent intensity in the corresponding region of Figure 9A, and most of this fluorescence (Fig. 9B) was from the crystalline lens. To explain this dimming in terms of tangential flow would require an expansion of the lipid image by a factor of at least 100/17 equal to 5.9 times, which is much greater than the observed expansion. Thus, the dimming in this dark strip was due mainly to evaporation rather than tangential flow, despite the relatively thick lipid in this strip.
Figure 9.
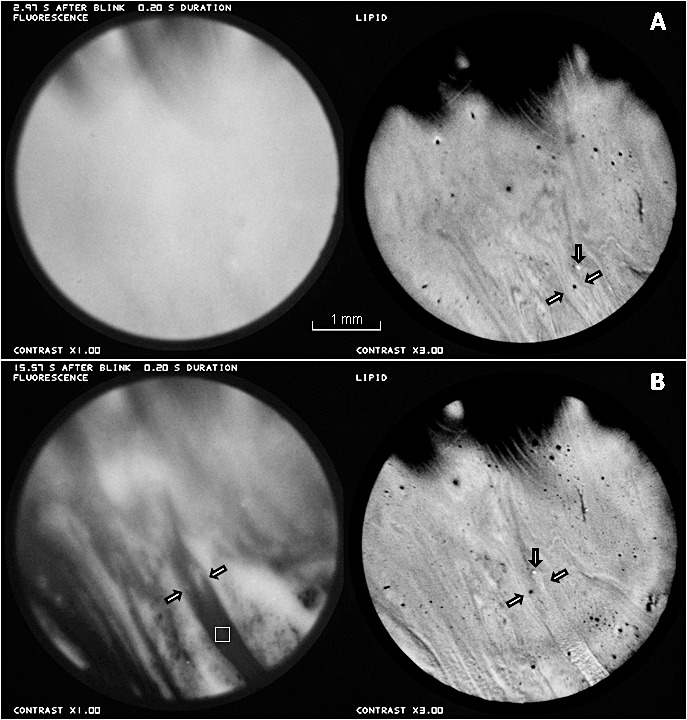
An example of tear thinning and breakup matching a relatively thick strip of lipid between the slanting arrows. Time interval between (A) and (B) was 12.6 seconds. Thinning from divergent tangential flow was small (see text) so most of the dimming in the fluorescence image (e.g., at square in [B]) was due to evaporation. Healthy tear film, 26-year-old white male.
Discussion
Two applications of these simultaneous fluorescence and TFLL images have been demonstrated. First, the combined images help to recognize objects such as bubbles (Figs. 2, 3, 6, 8) and large thick lipid globs (Figs. 3, 4). The latter were recorded for a dry eye condition, and perhaps represent the effect of a strong blink in unplugging meibomian glands which may have been temporarily blocked by viscous meibum and/or keratinized material.23
The second application of the simultaneous images is in elucidating the relationship between tear film thinning (or thickening) and the TFLL pattern. For example in Figure 4, the thick lipid globs seen just after a blink are seen to trigger tear breakup within four seconds after the blink (Fig. 4B). This breakup occurred considerably earlier than for Figures 6 to 9, suggesting it was caused by a different mechanism. Inspection of the video recording suggests that the breakup involved binding of the globs to the cornea surface and that discomfort, which caused an additional blink, might be due to drag on the epithelium similar to that in filamentary keratitis.24
An unexpected result was the development of bright fluorescence under a thin lipid structure in Figure 5. This was related to contraction of the thin lipid region causing a corresponding flow of aqueous tears, which in turn, gave rise to localized tear thickening. This convergent tangential flow was presumably driven by relatively high surface tension in the thin lipid structure.25
In Figures 6 to 9, regions of tear film thinning and breakup correspond closely to structures in the TFLL image (whereas regions of tear thinning [or thickening] and breakup are usually seen to correlate with lipid layer structures, it may be noted that a reverse correlation, predicting which regions of the lipid layer will give rise to tear thinning and breakup, is not always possible). In Figures 6 and 7, tear film thinning and breakup occur in regions of thin (dark) lipid. These findings are consistent with the proposal that tear thinning and breakup can be caused by localized evaporation, which tends to be greater through thin lipid.15,26
At some locations in Figure 8, given by horizontal arrows, breakup is again associated with thin lipid. However, an arcuate region of breakup in Figure 8 (upward arrows), while it matches an arcuate pattern in the TFLL, does not seem to be associated with particularly thin lipid, the lipid over the region of breakup looks little different from surrounding lipid. In Figure 9, the slanting strip of tear thinning/breakup (arrows) matches a slanting strip of lipid, which, surprisingly, is lighter (and therefore probably thicker) than surrounding lipid. Fluorescence dimming was much greater than expected from tangential flow and so was mainly due to evaporation. Thus, it seems that tear thinning and breakup can be caused by evaporation (rather than tangential flow) through regions of lipid that are not thinner than surrounding lipid.
The tear thinning and breakup for relatively thick lipid structures in Figures 8 and 9 indicate that the lipid in these regions is a poorer barrier to evaporation than the surrounding lipid, presumably due to a difference in lipid composition and/or structure. A possible factor in the reduction of evaporation resistance might be degradation of the lipid (e.g., by bacterial lipases which may break down esters into free fatty acids, cholesterol, and fatty alcohols).27 This may disrupt the normal TFLL structure, which is based largely on wax, cholesteryl, and other esters.28,29
Tear thinning and breakup in fluorescence images appear blurred compared with the corresponding TFLL structure (Figs. 6A, 7); this is not an artifact of the optical system because other objects in the fluorescence image may appear considerably sharper (e.g., the bubble in Fig. 6A). Figure 10 provides an explanation of this blurring if the thinning is due to local evaporation. Flow of water is shown by blue arrows. Local evaporation causes a hollow in the outer tear film surface (solid curve) and surface tension then causes a fall of pressure under this hollow. A pressure gradient is therefore generated, which causes a convergent tangential flow of tears (vertical blue arrows), thus, removing tears from the surroundings and broadening the hollow (dashed curve). This “healing” flow, together with osmosis induced by tear hyperosmolarity, reduces the central rate of thinning from evaporation. As thinning progresses, the flux (total convergent flow) of water from the surroundings, into the central region, will be reduced by the increase in viscous drag in the thinner tear film; for a given pressure gradient, flux varies as the cube of tear film thickness (e.g., Equation 23 of Braun13). Therefore, the rate of thinning, which is inversely related to the convergent flux, may increase as the tear film thins toward breakup. This may help explain the finding that the fluorescence dimming for the small breakup areas in Figure 6 was more rapid at later times after a blink (between Figs. 6A and 6B).
Figure 10.
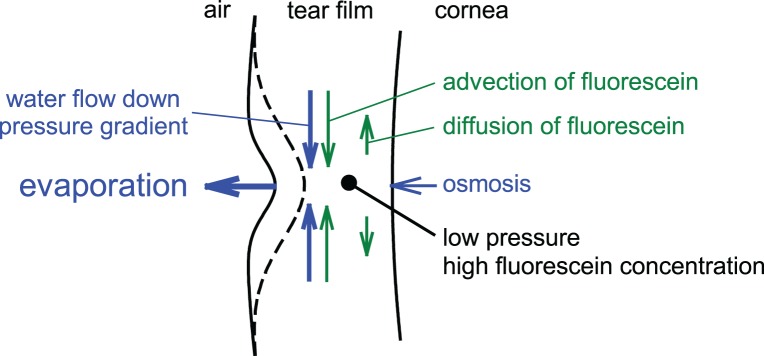
Flow of water (blue) and fluorescein (green) caused by localized evaporation. See text for details.
Flow of fluorescein is shown by green arrows in Figure 10. The convergent tangential flow of tears will carry dissolved fluorescein with it, a process called advection. Evaporation and fluorescein advection both tend to increase fluorescein concentration in the central region. This will cause a diffusion of fluorescein away from the center tending to counteract the increasing fluorescein concentration from evaporation and advection. The relative size of advection compared with diffusion depends on the viscosity, surface tension and thickness of the tear film, the diffusion constant of fluorescein, and the width of the hollow. Our unpublished simulations indicate that advection is typically greater than diffusion in the initial stages of thinning for a small evaporation hole, as indicated in Figure 10. The central fluorescence depends on both tear thickness and fluorescein concentration (and, hence, quenching), and so will depend on the effects of evaporation, osmosis, convergent tangential flow, fluorescein advection, and fluorescein diffusion as indicated in Figure 10.
In conclusion, tear film thinning and breakup patterns in these studies were generally associated with structures in the TFLL, as expected if breakup is usually related to increased evaporation through defective regions of the TFLL. Surprisingly, these defective TFLL regions were not always thinner than their surroundings, indicating that they may have had a defective composition and/or structure (e.g., due to bacterial lipases breaking down lipids such as wax and cholesteryl esters).
Supplementary Material
Acknowledgments
The authors thank Loraine T. Sinnott for statistical and other advice and Kimberly J. Shaw for administrative assistance and manuscript comments.
Supported by NEI Grant EY017951 (PEK-S), National Science Foundation Grant 1022706 (RJB), and NEI Grant EY0015519 (KKN, JJN)..
Disclosure: P.E. King-Smith, None; K.S. Reuter, None; R.J. Braun, None; J.J. Nichols, None; K.K. Nichols, None
References
- 1. Lemp MA, Baudouin C, Baum J, et al. The definition and classification of dry eye disease: report of the Definition and Classification Subcommittee of the International Dry Eye Work Shop (2007). Ocul Surf. 2007; 5: 75–92 [DOI] [PubMed] [Google Scholar]
- 2. Bron AJ. Methodologies to diagnose and monitor dry eye disease: report of the Diagnostic Methodology Subcommittee of the international Dry Eye Work Shop (2007). Ocular Surface. 2007; 5: 108–152 [DOI] [PubMed] [Google Scholar]
- 3. Mengher LS, Bron AJ, Tonge SR, Gilbert DJ. A non-invasive instrument for clinical assessment of the pre-corneal tear film stability. Curr Eye Res. 1985; 4: 1–7 [DOI] [PubMed] [Google Scholar]
- 4. Holly FJ. Formation and rupture of the tear film. Exp Eye Res. 1973; 15: 515–525 [DOI] [PubMed] [Google Scholar]
- 5. King-Smith PE, Nichols JJ, Nichols KK, Fink BA, Braun RJ. Contributions of evaporation and other mechanisms to tear film thinning and breakup: a review. Optom Vis Sci. 2008; 85: 623–630 [DOI] [PubMed] [Google Scholar]
- 6. Farris RL. Tear osmolarity–a new gold standard? Adv Exp Med Biol. 1994; 350: 495–503 [DOI] [PubMed] [Google Scholar]
- 7. Sullivan BD, Whitmer D, Nichols KK, et al. An objective approach to dry eye disease severity. Invest Ophthalmol Vis Sci. 2010; 51: 6125–6130 [DOI] [PubMed] [Google Scholar]
- 8. Bron AJ, Tiffany JM, Yokoi N, Gouveia SM. Using osmolarity to diagnose dry eye: a compartmental hypothesis and review of our assumptions. Adv Exp Med Biol. 2002; 506: 1087–1095 [DOI] [PubMed] [Google Scholar]
- 9. Pflugfelder SC. Tear dysfunction and the cornea: LXVIII Edward Jackson Memorial Lecture. Am J Ophthalmol. 2011; 152: 900–909 e1 [DOI] [PMC free article] [PubMed] [Google Scholar]
- 10. Liu H, Begley C, Chen M, et al. A link between tear instability and hyperosmolarity in dry eye. Invest Ophthalmol Vis Sci. 2009; 50: 3671–3679 [DOI] [PubMed] [Google Scholar]
- 11. Nichols JJ, King-Smith PE, Hinel EA, Thangavelu M, Nichols KK. The use of fluorescent quenching in studying the contribution of evaporation to tear thinning. Invest Ophthalmol Vis Sci. 2012; 53: 5426–5432 [DOI] [PMC free article] [PubMed] [Google Scholar]
- 12. Nichols JJ, Mitchell GL, King-Smith PE. Thinning rate of the precorneal and prelens tear films. Invest Ophthalmol Vis Sci. 2005; 46: 2353–2361 [DOI] [PubMed] [Google Scholar]
- 13. Braun RJ. Dynamics of the Tear Film. Annu Rev Fluid Mech. 2012; 44: 267–297 [Google Scholar]
- 14. King-Smith PE, Fink BA, Nichols JJ, et al. The contribution of lipid layer movement to tear film thinning and breakup. Invest Ophthalmol Vis Sci. 2009; 50: 2747–2756 [DOI] [PubMed] [Google Scholar]
- 15. King-Smith PE, Hinel EA, Nichols JJ. Application of a novel interferometric method to investigate the relation between lipid layer thickness and tear film thinning. Invest Ophthalmol Vis Sci. 2010; 51: 2418–2423 [DOI] [PMC free article] [PubMed] [Google Scholar]
- 16. Kimball SH, King-Smith PE, Nichols JJ. Evidence for the major contribution of evaporation to tear film thinning between blinks. Invest Ophthalmol Vis Sci. 2010; 51: 6294–6297 [DOI] [PMC free article] [PubMed] [Google Scholar]
- 17. Doane MG. An instrument for in vivo tear film interferometry. Optom Vis Sci. 1989; 66: 383–388 [DOI] [PubMed] [Google Scholar]
- 18. King-Smith PE, Fink BA, Nichols JJ, Nichols KK, Hill RM. Interferometric imaging of the full thickness of the precorneal tear film. J Opt Soc Am A Opt Image Sci Vis. 2006; 23: 2097–2104 [DOI] [PubMed] [Google Scholar]
- 19. King-Smith PE, Nichols JJ, Braun RJ, Nichols KK. High resolution microscopy of the lipid layer of the tear film. Ocul Surf. 2011; 9: 197–211 [DOI] [PMC free article] [PubMed] [Google Scholar]
- 20. Mishima S, Gasset A, Klyce SD Jr., Baum JL. Determination of tear volume and tear flow. Invest Ophthalmol. 1966; 5: 264–276 [PubMed] [Google Scholar]
- 21. Schiffman RM, Christianson MD, Jacobsen G, Hirsch JD, Reis BL. Reliability and validity of the Ocular Surface Disease Index. Arch Ophthalmol. 2000; 118: 615–621 [DOI] [PubMed] [Google Scholar]
- 22. McDonald JE. Surface phenomena of tear films. Trans Am Ophthalmol Soc. 1968; 66: 905–939 [PMC free article] [PubMed] [Google Scholar]
- 23. Knop E, Knop N, Millar T, Obata H, Sullivan DA. The international workshop on meibomian gland dysfunction: report of the subcommittee on anatomy, physiology, and pathophysiology of the meibomian gland. Invest Ophthalmol Vis Sci. 2011; 52: 1938–1978 [DOI] [PMC free article] [PubMed] [Google Scholar]
- 24. Nelson JD. In-Office Diagnostic Tests for Dry Eye Disease. In: Asbell PA, Lemp MA. (ed) Dry Eye Disease. New York: Thieme; 2006. [Google Scholar]
- 25. Berger RE, Corrsin S. A surface tension gradient mechanism for driving the pre-corneal tear film after a blink. J Biomech. 1974; 7: 225–238 [DOI] [PubMed] [Google Scholar]
- 26. Craig JP, Tomlinson A. Importance of the lipid layer in human tear film stability and evaporation. Optom Vis Sci. 1997; 74: 8–13 [DOI] [PubMed] [Google Scholar]
- 27. Dougherty JM, McCulley JP. Bacterial lipases and chronic blepharitis. Invest Ophthalmol Vis Sci. 1986; 27: 486–491 [PubMed] [Google Scholar]
- 28. Butovich IA. Lipidomics of human meibomian gland secretions: chemistry, biophysics, and physiological role of meibomian lipids. Prog Lipid Res. 2011; 50: 278–301 [DOI] [PMC free article] [PubMed] [Google Scholar]
- 29. Chen J, Green-Church KB, Nichols KK. Shotgun lipidomic analysis of human meibomian gland secretions with electrospray ionization tandem mass spectrometry. Invest Ophthalmol Vis Sci. 2010; 51: 6220–6231 [DOI] [PMC free article] [PubMed] [Google Scholar]
Associated Data
This section collects any data citations, data availability statements, or supplementary materials included in this article.


