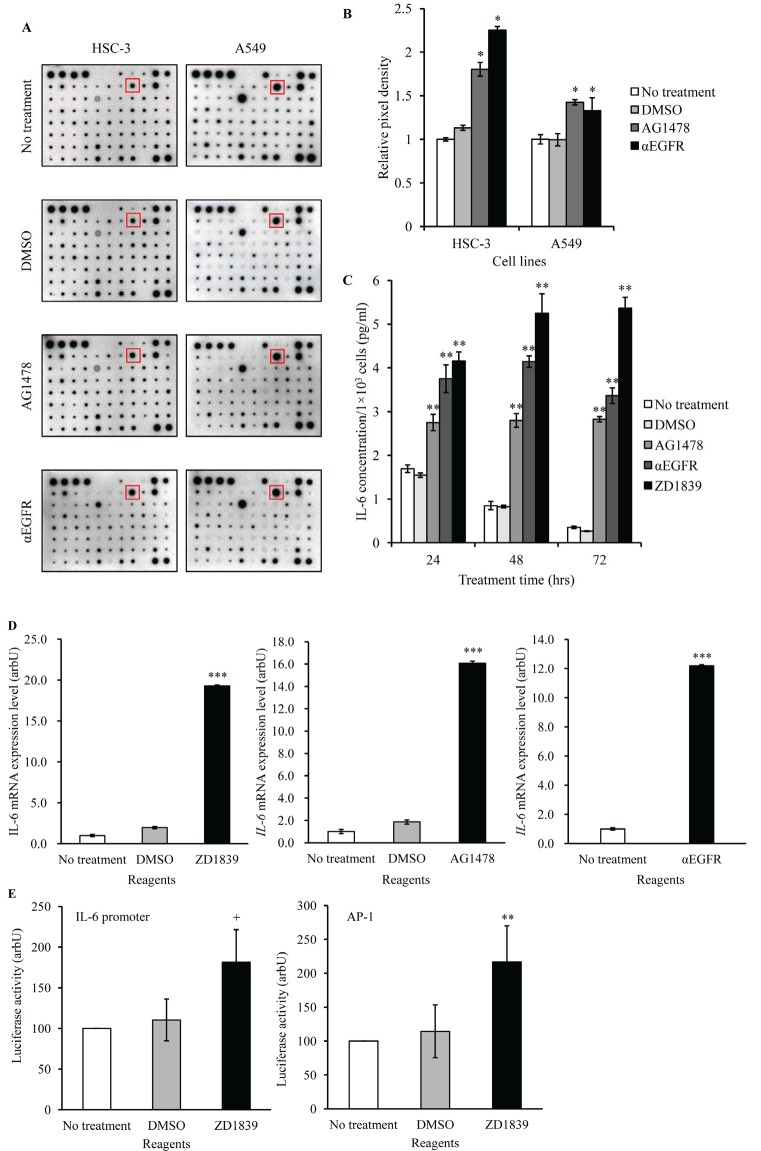
Figure 4. IL-6 is increased in cancer cells treated with EGFR-TKI.
(A) HSC-3 and A549 cells were treated with AG1478 (10 μM) or αEGFR antibody(10 μg/ml) for 24 hrs. Then, cytokines and growth factors included in CM were assayed using cytokine membrane array. DMSO was used as a vehicle. (B) Detected signal density obtained from the results of cytokine membrane array was measured using ScionImage software. Positive control spots were used as the internal control. *P < 0.01 by student's t test (vs DMSO). (C) HSC-3 cells were treated with AG1478 (10 μM), αEGFR antibody (5 μg/ml), ZD1839 (10 μM) or DMSO for 24 hrs, and CM was collected and assayed using an IL-6 ELISA kit. **P < 0.001 by student's t test (vs DMSO). (D) HSC-3 cells were treated with AG1478 (10 μM), ZD1839 (10 μM), or αEGFR antibody (5 μg/ml). Then, IL-6 mRNA expression was measured using qPCR. GAPDH was used as the internal control. Bars represent average ± SD of three independent experiments. ***P < 0.001 by student's t test (vs DMSO or no treatment). arbU; arbitrary units. (E) HSC-3 cells transfected with pGL4-IL-6 promoter luciferase vector or AP-1 luciferase vector were treated with DMSO or ZD1839 (10 μM) for 48 hrs. Then, luciferase activity was assayed using the dual-luciferase reporter assay system. +P =0.01 and **P < 0.01 by student's t test (vs DMSO). arbU; arbitrary units.

