

Abstract
Purpose
To review and interpret optic nerve head (ONH) anatomy detected with spectral domain optical coherence tomography (SD-OCT) pertaining to the clinical examination of the optic disc and propose that a paradigm change for clinical assessment of the ONH is necessary.
Design
Perspective.
Methods
Presently, the clinician evaluates neuroretinal rim health according to the appearance of the optic disc, the clinically visible surface of the ONH. Recent anatomic findings with SD-OCT have challenged the basis and accuracy of current rim evaluation. We demonstrate why incorporation of SD-OCT imaging of the ONH into the clinical examination of the disc is required.
Results
Disc margin based rim evaluation lacks a solid anatomic basis and results in variably inaccurate measurements for two reasons. First, the clinically visible disc margin is an unreliable outer border of rim tissue due to clinically and photographically invisible extensions of Bruch’s membrane. Second, rim tissue orientation is not considered in width measurements. We propose alternative anatomically and geometrically accurate SD-OCT based approaches for rim assessment that have enhanced detection of glaucoma. We also argue for new data acquisition and analysis strategies with SD-OCT that account for the large inter-individual variability in the angle between the fovea and ONH.
Conclusions
We propose a 4-point paradigm change for clinical assessment of the ONH that is anchored to the eye-specific anatomy and geometry of the ONH and fovea. Our approach is designed to enhance the accuracy and consistency of rim width, as well as peripapillary and macular intraretinal thickness measurements.
Since Helmholtz’s description of the direct ophthalmoscope in 1851,1 clinical examination of the optic disc has been a cornerstone of ophthalmic practice. The optic disc constitutes the clinically visible surface of the neural and connective tissues of the optic nerve head (ONH). By current convention, clinical disc examination requires identification of the outer and inner borders of the neuroretinal rim, respectively, the optic disc margin and optic disc cup. The amount of rim tissue is then estimated within the apparent plane of the disc margin as either the ratio of the size of the cup to the size of the disc,2 or the rim area.3 These concepts are applied whether the examination is performed with direct ophthalmoscopy, slit lamp biomicroscopy, optic disc photography or with a growing number of quantitative imaging modalities.
Advances in spectral domain optical coherence tomography (SD-OCT) have for the first time permitted imaging of ONH anatomy. Structures such as the anterior4–6 and posterior7, 8 lamina cribrosa surfaces, Bruch’s membrane/retinal pigment epithelium complex and its termination within the ONH,6, 9, 10 border tissue of Elschnig,5 and the scleral canal opening9 can now be readily visualized. Accurately colocalizing fundus photographs to SD-OCT image data has allowed clinicians to identify structures that correspond to common clinical landmarks, for example, the optic disc margin.9, 10
In this article we explain how recent SD-OCT findings undermine the current concepts of the clinical disc margin and rim quantification from both anatomic10 and geometric11–13 perspectives. In light of these findings, we propose a 4-part paradigm for incorporating new insights provided by SD-OCT imaging of ONH anatomy into the clinical examination of the optic disc to achieve a clinical assessment of the ONH. The paradigm recognises the variable relationship between the fovea, the path of the retinal nerve fibre bundles and the ONH14 among individuals. Its logic links the evaluation of the neuroretinal rim, and peripapillary and macular retinal nerve fibre layer (RNFL) to the specific anatomy and geometry of each individual ONH and its relative orientation with the fovea.
Anatomic assumptions underlying the clinically visible optic disc margin
The optic disc margin is a clinical landmark that is traditionally defined to be the inner edge of the scleral lip or crescent15 (Fig. 1). Within this conceptual framework, the disc margin is assumed to be a single and consistent anatomic structure around the entire ONH and a true outer border of the neuroretinal rim, and therefore the landmark from which the width of the rim can be measured.
Fig. 1.

Current concepts of optic disc margin anatomy. Top: Optic disc appearance of a right eye. Bottom: Corresponding view of the optic nerve head. In this example, the temporal disc margin is defined by the inner edge of the scleral lip or crescent (dotted lines) while the nasal disc margin corresponds to the termination of retinal pigment epithelium, which also coincides with the inner edge of the sclera. In both instances, the disc margin is depicted as the true outer border of the neuroretinal rim. RNFL = retinal nerve fibre layer; RPE = retinal pigment epithelium. Modified from Hogan, Alvarado Wedell.12
Current examination methods require identification of the disc margin whether the examination is performed clinically, photographically or with confocal scanning laser tomography, an imaging technique that maps the surface topography of the ONH.16
Anatomic errors in the current evaluation of the neuroretinal rim
Recent histological findings in monkey eyes9 and SD-OCT findings in human eyes,10 (in each case, colocalised to optic disc stereophotographs with the disc margin traced by a glaucomatologist), have revealed two new findings that challenge the anatomic assumptions which underlie optic disc margin based neuroretinal rim evaluation. First, the clinical disc margin is rarely a single anatomic entity, nor are the structures that underlie it consistent in an individual eye. Hence, the structure corresponding to the disc margin at the 3 ‘o’clock position may be different to that at the 9 ‘o’ clock position. Similarly, the structure corresponding to it at the 3 ‘o’ clock position in two eyes may also be different.10 Second, what the clinician perceives as the disc margin in clinical examination or with photographs is frequently not a true anatomic outer border of the neuroretinal rim due to regionally variable and invisible extensions of Bruch’s membrane that have not been previously appreciated (Fig. 2). In such cases, there can be a serious overestimation of the remaining rim tissue.13
Fig. 2.
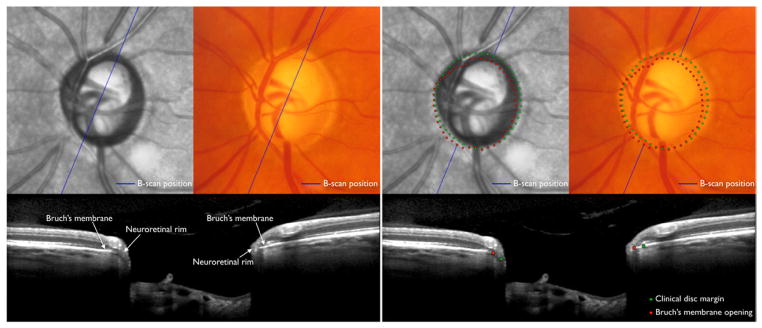
Optic disc margin anatomy with conventional optic disc photography and spectral domain optical coherence tomography (SD-OCT) in the left eye of a patient with glaucoma. Top: Optic disc with infrared illumination (first and third columns) with SD-OCT imaging and photography (second and fourth columns) precisely co-localised. Bottom: Co-localised B-scan images corresponding to the position (blue line) indicated in the fundus images. Clinically visible optic disc margin (green dots; top right) traced in the disc photograph projected to the B-scan (bottom right), and Bruch’s membrane opening identified in the B-scan (red dots; bottom right) projected to the fundus photograph (top right). In this case, there is a clinically invisible overhang of Bruch’s membrane in the superior temporal quadrant resulting in a significant overestimation of the neuroretinal rim width with disc margin based evaluation, while in the inferior nasal quadrant the rim is actually wider than perceived clinically.
Separate from these new issues regarding the anatomic outer border of the neuroretinal rim, its inner border, which constitutes the cup margin, is clinically evaluated with a stereoscopic evaluation of the rim width within the perceived plane of the disc margin. However, the rationale to support the existence of an anatomically defensible junction between the neuroretinal rim and cup is weak. Current imaging techniques similarly divide rim and cup on the basis of an arbitrary depth below a fixed plane.
The consequence of these findings is that current parameters, including cup-to-disc ratio and neuroretinal rim area are unlikely to accurately estimate the amount of remaining neural tissue in the ONH.13
Anatomic rationale for Bruch’s membrane opening as the outer border of the neuroretinal rim
The termination of Bruch’s membrane at the ONH represents the opening through which retinal ganglion cell axons exit the eye to form the choroidal and scleral portions of the neural canal. As such, this anatomic opening, termed Bruch’s membrane opening (BMO), is a true outer border of the neural tissues since axons cannot pass through an intact Bruch’s membrane to exit the eye. Whether or not BMO is clinically visible, it is a true and anatomically accurate landmark from which neuroretinal rim measurements can be made. It is also a structure that is consistently identified with SD-OCT.9, 13, 17
The stability of BMO under a variety of conditions provides another rationale for its utility as a landmark. BMO is unaltered in the face of large changes in intraocular pressure induced by glaucoma surgery.18 The two-dimensional plane that best fits BMO is also axially stable with surgical reduction of intraocular pressure.18 There is no published evidence yet on the stability of BMO with glaucoma progression; however, in experimental glaucoma in monkeys, BMO position in 3-D histomorphometry of the ONH appears unaltered in spite of changes in the neural component of the ONH and in the positions of the anterior and posterior scleral canal opening.19
Geometric errors in the current evaluation of the neuroretinal rim
Neuroretinal rim measurement with clinical, photographic or confocal scanning laser tomographic techniques is made along the two-dimensional plane of the perceived optic disc margin. However, in a single eye, the orientation of rim tissue varies around the ONH. At one extreme, axons may exit the eye almost parallel to the visual axis, while at the other, they may exit the eye at a much shallower angle, typically in the temporal sector which can have a shallow sloping rim.20 Hence, potentially significant errors in rim width can occur if the measurement plane is fixed.13 For example, for the same number of axons, the conventional rim width will be larger when its orientation is more horizontal compared to when it is more perpendicular to the fixed plane of measurement (Fig. 3). Even if a rim measurement is made from an anatomically accurate location, that is BMO, its width along the approximately horizontal fixed plane of BMO will be influenced by the orientation of the overlying rim tissue (Fig. 3).
Fig. 3.

Influence of neuroretinal rim orientation on rim width measurement. Portions of B-scans from the same eye with spectral domain optical coherence tomography; one in which the rim orientation is relatively flat (top left) and in another where it is relatively steep (top right). Bottom: Measurement of rim width along the fixed Bruch’s membrane opening (BMO) plane, termed BMO-horizontal rim width (BMO-HRW) and along the axis resulting in the minimum rim width from BMO, termed BMO-minimum rim width (BMO-MRW). The actual amount of rim tissue represented by BMO-MRW is identical in these two sections, however, BMO-HRW is over 60% wider in the section shown to the left compared to one on the right.
Geometric rationale for formulating a minimum rim width measurement
Because of the varying orientation of the neuroretinal rim relative to BMO, Povazay et al.,12 and Chen11 first proposed that the minimum distance from BMO to the internal limiting membrane represents the most geometrically accurate measurement of neuroretinal rim width. We subsequently characterised the difference between this rim measurement, termed BMO-minimum rim width (BMO-MRW), and conventional ones13 and its utility in the detection of progressive ONH change in experimental primate glaucoma.21 Most recently we showed that BMO-MRW significantly enhanced the ability to detect glaucomatous optic neuropathy compared to current confocal scanning laser tomography and current SD-OCT analyses.22
Automated algorithms for identifying (segmenting) BMO in B-scans of SD-OCT images have been described and incorporated into commercial software.17, 23–25 However, to date, the primary rationale for this implementation has been for automated detection of the optic disc margin and derivation of a rim width measurement along a single fixed plane,23, 25 akin to current clinical methods. Hence, while SD-OCT technology is providing unprecedented detail on ONH anatomy, which to date has not been possible, its use has been limited to mimicking the manner in which the optic disc is clinically examined rather than incorporating the anatomy clinicians have not been able to see before into practice.
Clinical examples
The optic disc photograph and 24 co-localised SD-OCT radial B-scans around the ONH of each of 30 glaucoma patients and 10 control subjects illustrating: (1) the clinical disc margin is not a single anatomic location; (2) clinically invisible extensions of BM internal to the disc margin are regionally present in most eyes and (3) the dependence of rim width measurement on rim tissue orientation are available online (http://ophthalmology.medicine.dal.ca/research/onh.html).
Anatomic variation in fovea position relative to the optic nerve head
In clinical fundus images, the fovea is located below the level of the centre of the ONH in most individuals. In a recent study on the angle between the fovea and BMO centre relative to the horizontal axis defined by the fundus image, termed the fovea-BMO centre axis, in 222 patients with ocular hypertension or glaucoma showed that while the mean angle of this axis was −7° (the fovea being 7° below), the range was from −17° to +6°, or 23° (Demirel S, written communication, January 25, 2013; Fig. 4). While the positions of these two structures relative to the fundus image vary considerably between subjects, the anatomic path of RNFL bundles is governed primarily by these two structures as the bundles approach the ONH and exit the eye.14 In fundus images, the positions of the fovea and ONH may also vary slightly within the same individual from day to day because of cyclotorsion,26 however, the path of RNFL bundles remains constant relative to the fovea-BMO centre axis.
Fig. 4.

Inter-individual variability in the axis connecting the fovea and Bruch’s membrane opening (BMO) centre (fovea-BMO centre axis) in 222 patients with ocular hypertensive or glaucoma. Left: Schematic demonstrating the range of the fovea-BMO centre axis (solid line), from +6° above (top left) to −17° below (bottom left) the horizontal in the image frame (dashed line). Right: Frequency histogram with a mean value of −7° (centre left). Filled circle = fovea; filled square = BMO centre; dots = BMO. Data courtesy of Dr. Shaban Demirel, Devers Eye Institute, Portland, OR.
Rationale for regionalisation of the neuroretinal rim, peripapillary and macular nerve fibre layer relative to the fovea-Bruch’s membrane opening centre axis
Currently, image acquisition and data analysis algorithms report regional data according to the temporal, superior, nasal and inferior sector positions that are established relative to the fixed horizontal and vertical axes of the image. Hence, for example, the neuroretinal rim width, or peripapillary RNFL thickness in a given sector is assumed to refer to precisely the same anatomic location among different persons. However, because the fovea-BMO centre axis can vary by as much as 23°, the anatomic difference between two eyes of an individual geometric sector position may also be as large as 23° (Fig. 5).
Fig. 5.

Impact of regionalisation of neuroretinal rim width and peripapillary retinal nerve fibre layer thickness measurements based on the axis connecting the fovea and Bruch’s membrane opening (BMO) centre (fovea-BMO centre axis). Top centre: eye with fovea-BMO centre axis of +6°. Top right: eye with fovea-BMO centre axis of −17°. Middle left: Sector regionalisation according to positions that are fixed relative to the imaging frame of the imaging device, currently applied to all eyes in the analyses of rim width and retinal nerve fibre layer thickness. Middle centre and right: Current regionalisation with fixed sector orientation leads to measurements from variably different anatomic locations. Bottom centre and right: Regionalisation relative to fovea-BMO centre axis. In this case rotating the sector orientation according to the fovea-BMO centre axis ensures that sectors contain measurements from the same anatomic locations.
Because sector positions refer to measurements from different anatomic locations, artificially large inter-individual differences in sectoral neuroretinal rim width, peripapillary and macular RNFL thickness likely occur. As a result, the limits of normal variation in these measurements, as reflected in normative databases, are probably artificially increased, and may decrease the diagnostic precision of imaging devices. Errors in mapping ocular structures to the visual field may also be induced and contribute to the poor observed correlation between measures of structure and function in glaucoma.27, 28
Rationale for image acquisition relative to the fovea-Bruch’s membrane opening centre axis
Since it is important to regionalise neuroretinal rim width, peripapillary and macular RNFL thickness according to the fovea-BMO centre axis, it is reasonable to extend the same logic also to data acquisition. Currently, data acquisition by imaging devices occurs invariably according to a fixed coordinate system for sectors pre-set in the device.
It is logical therefore that the fovea-BMO centre axis be determined first in each eye, followed by data acquisition relative to this axis to ensure that measurements are distributed according to the anatomy of the individual eye. Such an approach will allow the most robust sampling of the constituent anatomy and the most meaningful comparison between individuals. Furthermore, because of image registration software, follow-up images can then be acquired at the same anatomical positions in each eye.
Proposed paradigm change for clinical assessment of the optic nerve head
Below, we propose a 4-point paradigm change that incorporates the new insights provided by SD-OCT imaging of ONH anatomy into the clinical examination of the optic disc for clinical assessment of the ONH (Fig. 6).
Fig. 6.
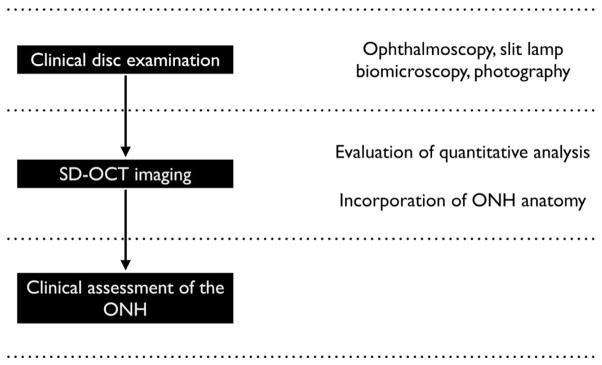
Schematic of incorporating spectral domain optical coherence tomography (SD-OCT) imaging that includes quantitative analyses and an understanding of optic nerve head (ONH) anatomy into a clinical examination of the optic disc with ophthalmoscopy, slit lamp biomicroscopy or photography to yield an clinically informed assessment of the ONH.
1. Optical coherence tomography imaging of the optic nerve head should not mimic the clinical examination of the optic disc
Because of the fundamental differences between the clinical examination of the optic disc and the SD-OCT imaging of the ONH, we believe that constraining SD-OCT analyses to mimic the disc examination is erroneous. Instead, we propose that clinical practice should incorporate knowledge of SD-OCT detected ONH anatomy into the clinical disc examination in the same manner that diagnostic imaging techniques in other areas of medicine have advanced their fields. For example, pulmonologists are trained to review imaging studies (X-ray, computed tomographic and magnetic resonance images) to enhance their clinical chest examination (palpation, percussion and auscultation). In this regard, the practice of referring to the SD-OCT detected BMO as the optic disc margin is inaccurate and potentially misleading. Incorporating the anatomic insights provided by SD-OCT into the clinical examination will be informative and should enable clinicians to make more accurate diagnoses. Constraining SD-OCT to conventional concepts of disc anatomy and terminology will inhibit its clinical potential.
2. Neuroretinal rim measurement should be anatomically and geometrically accurate
Quantifying neuroretinal rim width requires identification of its inner border relative to an anatomic landmark that is a true outer border of the rim. Currently, BMO is the most consistent SD-OCT detected outer border of the neuroretinal rim and a stable landmark that is readily visible in all but a few exceptional B-scans.9, 22 The minimum distance from BMO to the internal limiting membrane represents the geometrically correct width of the neuroretinal rim.
Automated algorithms that detect BMO and the internal limiting membrane with SD-OCT images are now available.17, 23–25 Those that quantify BMO-MRW regionally and determine its probability of being within age-specific normal could be developed and be available for clinical use.
3. Acquisition and regionalisation of data based on fovea-Bruch’s membrane opening centre axis
Acquisition and regionalisation of ONH and retinal imaging data should respect the anatomic relationship between the fovea and the ONH. In doing so, regional estimates of the neuroretinal rim and the peripapillary and macular RNFL layer thickness will be anatomically correct and consistently comparable among individuals. The practical effect of correct regionalisation should be lower inter-individual variation, leading to narrower limits of normal variation and potentially more accurate and sensitive identification of early damage. Correct regionalisation may also increase the correspondence between structural and visual field measures.
Such regionalisation strategies will not impact global measurements as the latter represent sums or averages around the entire ONH or macula.
4. Optical coherence tomography imaging of optic nerve head anatomy should enhance, rather than replace, the clinical optic disc examination
One of the key goals of the clinical optic disc examination is to assess the amount and health of the neuroretinal rim. In the clinical examination of the optic disc, the amount of rim tissue should be estimated based on the assumption that the disc margin represents the outer border of rim tissue. The examination should continue to characterise the colour and health of the rim regionally, or by clock hour, around the optic disc and checking for the presence of pallor, bowing or excavation of the ONH surface, optic disc haemorrhages and peripapillary RNFL defects. The clinical examination is essential even if SD-OCT imaging is available as many of the qualitative aspects of the examination, such as the colour of the rim and the presence of haemorrhages cannot be detected readily with SD-OCT or other imaging devices.
The clinician should, however, be cognisant of the limitations of current methods of rim width measurement and aware that potentially serious errors in rim evaluation can occur due to the reasons discussed above. For pragmatic reasons, it is unrealistic to expect or require that each clinical optic disc examination by all physicians in all environments be accompanied with SD-OCT imaging. When the clinical disc examination is unequivocally normal, SD-OCT imaging is unlikely to be additionally informative (Fig. 7). However, when there is suspicion of abnormality, SD-OCT will provide an anatomically accurate assessment of the neuroretinal rim (Fig. 8).
Fig. 7.

Incorporation of spectral domain optical coherence tomography (SD-OCT) into a clinical examination of the optic disc in a normal left eye (top). In this case where the clinical appearance appears unequivocally normal, SD-OCT (bottom) with analysis of Bruch’s membrane opening minimum rim width (BMO-MRW) by clock hour is unlikely to be additionally informative. There is a minor mismatch between the clinically visible disc margin (green dots) and BMO (red dots) indicating that disc margin or BMO based rim values are similar. At most clock hour positions, BMO-MRW appears wide. Future algorithms that indicate whether individual BMO-MRW values lie within or outside age-specific normal values could be clinically valuable.
Fig. 8.

Incorporation of spectral domain optical coherence tomography (SD-OCT) into a clinical examination of the optic disc in a right eye suspected of glaucoma (top). In this case SD-OCT (bottom) with analysis with Bruch’s membrane opening minimum rim width (BMO-MRW) by clock hour provides valuable additional information. There is a considerable mismatch between the clinically visible disc margin (green dots) and BMO (red dots) indicating a clinically invisible extension of Bruch’s membrane, especially inferiorly and nasally. In these locations as well as the superior sector, which is the most suspicious, the neuroretinal rim is considerably thinner than the clinician would estimate from disc margin based evaluation. Future algorithms that indicate whether individual BMO-MRW values lie within or outside age-specific normal values could be clinically valuable.
Finally, we believe that SD-OCT detected anatomy of the ONH should be displayed relative to a clinical photograph infrared image of the disc by sectors or clock-hour positions according to the fovea-BMO centre axis (Figs. 7 and 8). Hence, clinicians can incorporate knowledge of this anatomy into their clinical disc examination and formulate a clinical assessment of the ONH at the time imaging is performed. In the future, segmental rim widths in a given image could be compared to normative databases in an anatomically and geometrically accurate manner.
Summary
From recent findings on ONH anatomy with SD-OCT, we have argued that the foundation of current clinical optic disc margin based evaluation of the neuroretinal rim is inaccurate because it lacks a solid anatomic and geometric foundation. We propose a paradigm change from the current clinical examination of the optic disc to the clinical assessment of the ONH that includes SD-OCT imaging (Fig. 8). The immediate consequence of the new quantitative measures proposed is that our ability to detect glaucoma is enhanced.22 We anticipate as data acquisition and analysis takes place according to the specific fovea-BMO centre axis of an individual eye, inter-individual variation in several important quantitative measures, including thickness of the peripapillary and macular RNFL, and other segmented layers of the retina, will decrease and further enhance detection of glaucoma. Finally, as longitudinal data are acquired, our ability to detect earlier and clinically meaningful change may similarly be improved.
Acknowledgments
a. Funding/Support
BCC: Grant MOP11357 from the Canadian Institutes of Health Research, Ottawa, ON, Canada.
CFB: RO1EY011610 and RO1EY021281 from the National Eye Institute, National Institutes of Health, Bethesda, MD.
d. Other Acknowledgements:
The authors are grateful to Drs. Marcelo Nicolela, Neil O’Leary, Alexandre Reis, Faisal AlMobarak, Brad Fortune, Nicholas Strouthidis and Hongli Yang for their contribution and discussions leading to the various research projects and ideas represented in this article; to Drs. Shaban Demirel, Stuart Gardiner and Brad Fortune of the Portland Progression Project for providing the data in Figure 4; to Mr. Glen Sharpe and Ms. Donna Hutchison for data collection and processing; and to Mr. Juan Reynaud for software support.
Footnotes
c. Contributions of Authors:
Design of study (BCC, CFB); Conduct of study (BCC, CFB); Analysis and interpretation of data (BCC, CFB); and Preparation, review and approval of manuscript (BCC, CFB).
b. Financial Disclosures
BCC: Allergan (Consultant, lecture fees), Carl Zeiss Meditec (Equipment support, lecture fees), Heidelberg Engineering (Unrestricted research and equipment support).
CFB: Merck, Sharpe and Dohme (Consultant, lecture fees), Heidelberg Engineering (Unrestricted research and equipment support; Consultant, no financial reimbursement), Reichert (Equipment support).
Publisher's Disclaimer: This is a PDF file of an unedited manuscript that has been accepted for publication. As a service to our customers we are providing this early version of the manuscript. The manuscript will undergo copyediting, typesetting, and review of the resulting proof before it is published in its final citable form. Please note that during the production process errors may be discovered which could affect the content, and all legal disclaimers that apply to the journal pertain.
References
- 1.von Helmholtz H. Beschreibung eines Augenspiegels zur Untersuchung der Netzhaut am lebenden Auge. Berlin: A Förstner’sche Verlagsbuchhandlung; 1851. [Google Scholar]
- 2.Armaly MF. Lessons to be learned from a glaucoma survey. J Iowa State Med Soc. 1960;50:501–507. [PubMed] [Google Scholar]
- 3.Balazsi AG, Drance SM, Schulzer M, Douglas GR. Neuroretinal rim area in suspected glaucoma and early chronic open-angle glaucoma. Correlation with parameters of visual function. Arch Ophthalmol. 1984;102(7):1011–1014. doi: 10.1001/archopht.1984.01040030813022. [DOI] [PubMed] [Google Scholar]
- 4.Agoumi Y, Sharpe GP, Hutchison DM, Nicolela MT, Artes PH, Chauhan BC. Laminar and prelaminar tissue displacement during intraocular pressure elevation in glaucoma patients and healthy controls. Ophthalmology. 2011;118(1):52–59. doi: 10.1016/j.ophtha.2010.05.016. [DOI] [PubMed] [Google Scholar]
- 5.Strouthidis NG, Grimm J, Williams GA, Cull GA, Wilson DJ, Burgoyne CF. A comparison of optic nerve head morphology viewed by spectral domain optical coherence tomography and by serial histology. Invest Ophthalmol Vis Sci. 2010;51(3):1464–1474. doi: 10.1167/iovs.09-3984. [DOI] [PMC free article] [PubMed] [Google Scholar]
- 6.Srinivasan VJ, Adler DC, Chen Y, et al. Ultrahigh-speed optical coherence tomography for three-dimensional and en face imaging of the retina and optic nerve head. Invest Ophthalmol Vis Sci. 2008;49(11):5103–5110. doi: 10.1167/iovs.08-2127. [DOI] [PMC free article] [PubMed] [Google Scholar]
- 7.Lee EJ, Kim TW, Weinreb RN, Park KH, Kim SH, Kim DM. Visualization of the lamina cribrosa using enhanced depth imaging spectral-domain optical coherence tomography. Am J Ophthalmol. 2011;152(1):87–95. e81. doi: 10.1016/j.ajo.2011.01.024. [DOI] [PubMed] [Google Scholar]
- 8.Park HY, Jeon SH, Park CK. Enhanced depth imaging detects lamina cribrosa thickness differences in normal tension glaucoma and primary open-angle glaucoma. Ophthalmology. 2012;119(1):10–20. doi: 10.1016/j.ophtha.2011.07.033. [DOI] [PubMed] [Google Scholar]
- 9.Strouthidis NG, Yang H, Reynaud JF, et al. Comparison of clinical and spectral domain optical coherence tomography optic disc margin anatomy. Invest Ophthalmol Vis Sci. 2009;50(10):4709–4718. doi: 10.1167/iovs.09-3586. [DOI] [PMC free article] [PubMed] [Google Scholar]
- 10.Reis AS, Sharpe GP, Yang H, Nicolela MT, Burgoyne CF, Chauhan BC. Optic disc margin anatomy in patients with glaucoma and normal controls with spectral domain optical coherence tomography. Ophthalmology. 2012;119(4):738–747. doi: 10.1016/j.ophtha.2011.09.054. [DOI] [PMC free article] [PubMed] [Google Scholar]
- 11.Chen TC. Spectral domain optical coherence tomography in glaucoma: qualitative and quantitative analysis of the optic nerve head and retinal nerve fiber layer (an AOS thesis) Trans Am Ophthalmol Soc. 2009;107:254–281. [PMC free article] [PubMed] [Google Scholar]
- 12.Povazay B, Hofer B, Hermann B, et al. Minimum distance mapping using three-dimensional optical coherence tomography for glaucoma diagnosis. J Biomed Opt. 2007;12(4):041204. doi: 10.1117/1.2773736. [DOI] [PubMed] [Google Scholar]
- 13.Reis AS, O’Leary N, Yang H, et al. Influence of clinically invisible, but optical coherence tomography detected, optic disc margin anatomy on neuroretinal rim evaluation. Invest Ophthalmol Vis Sci. 2012;53(4):1852–1860. doi: 10.1167/iovs.11-9309. [DOI] [PMC free article] [PubMed] [Google Scholar]
- 14.Airaksinen PJ, Tuulonen A, Werner EB. Clinical evaluation of the optic disc and retinal nerve fiber layer. In: Ritch R, Shields MB, Krupin T, editors. The Glaucomas. St. Louis: Mosby-Year Book; 1996. pp. 617–657. [Google Scholar]
- 15.Hogan MJ, Alvarado JA, Weddell JE. Histology of the Human Eye. Philadelphia: Saunders; 1971. pp. 523–606. [Google Scholar]
- 16.Zinser G, Wijnaendts-van-Resandt RW, Dreher AW, Weinreb RW, Harbarth U, Burk ROW. Confocal laser tomographic scanning of the eye. Proc SPIE. 1989;1161:337–344. [Google Scholar]
- 17.Hu Z, Abramoff MD, Kwon YH, Lee K, Garvin MK. Automated segmentation of neural canal opening and optic cup in 3D spectral optical coherence tomography volumes of the optic nerve head. Invest Ophthalmol Vis Sci. 2010;51(11):5708–5717. doi: 10.1167/iovs.09-4838. [DOI] [PMC free article] [PubMed] [Google Scholar]
- 18.Reis AS, O’Leary N, Stanfield MJ, Shuba LM, Nicolela MT, Chauhan BC. Laminar displacement and prelaminar tissue thickness change after glaucoma surgery imaged with optical coherence tomography. Invest Ophthalmol Vis Sci. 2012;53(9):5819–5826. doi: 10.1167/iovs.12-9924. [DOI] [PubMed] [Google Scholar]
- 19.Bellezza AJ, Rintalan CJ, Thompson HW, Downs JC, Hart RT, Burgoyne CF. Deformation of the lamina cribrosa and anterior scleral canal wall in early experimental glaucoma. Invest Ophthalmol Vis Sci. 2003;44(2):623–637. doi: 10.1167/iovs.01-1282. [DOI] [PubMed] [Google Scholar]
- 20.Jonas JB, Gusek GC, Guggenmoos-Holzmann I, Naumann GO. Correlations of the neuroretinal rim area with ocular and general parameters in normal eyes. Ophthalmic Res. 1988;20(5):298–303. doi: 10.1159/000266730. [DOI] [PubMed] [Google Scholar]
- 21.Strouthidis NG, Fortune B, Yang H, Sigal IA, Burgoyne CF. Longitudinal change detected by spectral domain optical coherence tomography in the optic nerve head and peripapillary retina in experimental glaucoma. Invest Ophthalmol Vis Sci. 2011;52(3):1206–1219. doi: 10.1167/iovs.10-5599. [DOI] [PMC free article] [PubMed] [Google Scholar]
- 22.Chauhan BC, O’Leary N, Almobarak FA, et al. Enhanced detection of open-angle glaucoma with an anatomically accurate optical coherence tomography-derived neuroretinal rim parameter. Ophthalmology. 2013;120(3):535–543. doi: 10.1016/j.ophtha.2012.09.055. [DOI] [PMC free article] [PubMed] [Google Scholar]
- 23.Abramoff MD, Lee K, Niemeijer M, et al. Automated segmentation of the cup and rim from spectral domain OCT of the optic nerve head. Invest Ophthalmol Vis Sci. 2009;50(12):5778–5784. doi: 10.1167/iovs.09-3790. [DOI] [PMC free article] [PubMed] [Google Scholar]
- 24.Lee K, Niemeijer M, Garvin MK, Kwon YH, Sonka M, Abramoff MD. Segmentation of the optic disc in 3-D OCT scans of the optic nerve head. IEEE Trans Med Imaging. 2010;29(1):159–168. doi: 10.1109/TMI.2009.2031324. [DOI] [PMC free article] [PubMed] [Google Scholar]
- 25.Mwanza JC, Chang RT, Budenz DL, et al. Reproducibility of peripapillary retinal nerve fiber layer thickness and optic nerve head parameters measured with cirrus HD-OCT in glaucomatous eyes. Invest Ophthalmol Vis Sci. 2010;51(11):5724–5730. doi: 10.1167/iovs.10-5222. [DOI] [PMC free article] [PubMed] [Google Scholar]
- 26.Patel NB, Wheat JL, Rodriguez A, Tran V, Harwerth RS. Agreement between retinal nerve fiber layer measures from Spectralis and Cirrus spectral domain OCT. Optom Vis Sci. 2012;89(5):E652–666. doi: 10.1097/OPX.0b013e318238c34e. [DOI] [PMC free article] [PubMed] [Google Scholar]
- 27.Caprioli J, Miller JM. Correlation of structure and function in glaucoma. Quantitative measurements of disc and field. Ophthalmology. 1988;95(6):723–727. doi: 10.1016/s0161-6420(88)33116-7. [DOI] [PubMed] [Google Scholar]
- 28.Hood DC, Anderson SC, Wall M, Raza AS, Kardon RH. A test of a linear model of glaucomatous structure-function loss reveals sources of variability in retinal nerve fiber and visual field measurements. Invest Ophthalmol Vis Sci. 2009;50(9):4254–4266. doi: 10.1167/iovs.08-2697. [DOI] [PMC free article] [PubMed] [Google Scholar]