

Abstract
The goal of this MR-imaging study was to quantify vertebral bone marrow fat content and composition in diabetic and non-diabetic postmenopausal women with fragility fractures and to compare them with non-fracture controls with and without type-2 diabetes mellitus. Sixty-nine postmenopausal women (mean age 63±5 years) were recruited. Thirty-six patients (47.8%) had spinal and/or peripheral fragility fractures. Seventeen fracture patients were diabetic. Thirty-three women (52.2%) were non-fracture controls. Sixteen women were diabetic non-fracture controls. To quantify vertebral bone marrow fat content and composition, patients underwent MR-spectroscopy (MRS) of the lumbar spine at 3 Tesla. Bone mineral density (BMD) was determined by dual-energy X-Ray-absorptiometry (DXA) of the hip and lumbar spine (LS) and quantitative computed tomography (QCT) of the LS. To evaluate associations of vertebral marrow fat content and composition with spinal and/or peripheral fragility fractures and diabetes, we used linear regression models adjusted for age, race, and spine vBMD by QCT. At the LS, non-diabetic and diabetic fracture patients had lower vBMD than controls and diabetics without fractures (p=0.018; p=0.005). However, aBMD by DXA did not differ between fracture and non-fracture patients. After adjustment for age, race, and spinal vBMD, the prevalence of fragility fractures was associated with -1.7% lower unsaturation levels (confidence interval [CI] -2.8% to - 0.5%, p=0.005) and +2.9% higher saturation levels (CI 0.5% to 5.3%, p=0.017). Diabetes was associated with -1.3% (CI -2.3% to -0.2%, p=0.018) lower unsaturation and +3.3% (CI 1.1% to 5.4%. p=0.004) higher saturation levels. Diabetics with fractures had the lowest marrow unsaturation and highest saturation. There were no associations of marrow fat content with diabetes or fracture. Our results suggest that altered bone marrow fat composition is linked with fragility fractures and diabetes. MRS of spinal bone marrow fat may therefore serve as a novel tool for BMD-independent fracture risk assessment.
Keywords: Fragility Fractures, MR Spectroscopy, Bone Marrow Fat, Unsaturation Level, Type-2 Diabetes mellitus
Introduction
In the last decade, numerous pathophysiologic links have been discovered between bone and adipose tissue (1,2). Osteoblasts and adipocytes differentiate from the same mesenchymal stem cells. Aging and estrogen deficiency - two conditions pivotally involved in the pathophysiology of osteoporosis - are associated with lower osteogenic and greater adipogenic lineage commitment of mesenchymal stem cells (1,3,4). In addition, fat and bone are increasingly recognized to be capable of mutual regulation. States of altered fat mass and/or fat distribution such as HIV-related lipodystrophy (5,6) and anorexia nervosa (7) were shown to be linked with low bone mineral density. However, due to major age-, context-, and site-specificity, the connection between fat and bone is complex (8). Subcutaneous adipose tissue, visceral fat, and bone marrow fat exhibit distinct, tissue-specific properties and therefore different metabolic activity. Bone marrow fat expresses genetic and metabolic traits of brown adipose tissue (9,10) and appears to be an insulin-sensitive tissue closely linked to systemic energy metabolism (2).
Non-invasive imaging techniques such as high-resolution magnetic resonance imaging (HR-MRI) have significantly advanced clinical and translational research on bone quality (11). In addition, biochemical approaches including MR-spectroscopy can be used to investigate metabolic abnormalities of bone and its micro-environment by quantifying bone marrow fat characteristics (12,13). The non-invasive assessment of bone marrow adiposity and bone marrow fat composition by MRI is based on presence and types of hydrogen bonds found in the bone marrow volume of interest. Besides individual spectral peaks representing water and signals from saturated lipids, unsaturated lipids can be resolved due to the presence of double bonds. Several MRI-studies have confirmed the results of histomorphometric analyses of bone biopsies (14,15) and reported an inverse association of bone marrow fat and bone mineral density (BMD), especially upon aging (13,16,17).
Recently researchers have started to examine bone marrow fat composition in addition to the mere quantification of the amount of bone marrow fat. In fact, a few publications have shown that bone marrow fat composition might be abnormal in patients with chronic diseases such as osteoporosis (18) or type 2 diabetes mellitus (19). Using MR-spectroscopy, Yeung et al. were the first to report significantly lower unsaturation of bone marrow lipids in postmenopausal osteopenic and osteoporotic women than healthy controls (18). Baum et al. found significantly lower unsaturation levels in postmenopausal women with type-2 diabetes mellitus than non-diabetic controls (19). These independent results are particularly interesting in the light of epidemiologic data, which indicate an inverse association between dietary intake of poly-unsaturated lipids and hip fracture risk in older adults (20).
To the best of our knowledge, there are no in-vivo data on bone marrow fat composition in patients with fragility fractures. It is also unknown if type 2 diabetes and fracture status interact with respect to bone marrow fat. Therefore, it was the goal of our study to quantify bone marrow fat content and composition in diabetic and non-diabetic women with prevalent fragility fractures and to compare them with non-fracture controls with and without diabetes.
Patients and Methods
Patients
We recruited non-diabetic and diabetic postmenopausal women for the following four study groups: Non-diabetic patients with fragility fractures (Fx, n=19), non-diabetic controls without fragility fractures (Co, n=17), diabetic patients with fragility fractures (DMFx, n=17), and diabetic patients without fragility fractures (DM, n=16). Recruitment was performed by media outlets including online and newspaper advertisement, flyers, and radio announcements. For inclusion women had to be between 50-75 years old. Their body mass index (BMI) was required to range between 18 and 37 kg/m2 as subjects with higher BMI would not fit into the gantry of the MRI scanner. All participants had to be mobile and able to move without assistance. At minimum, diabetics had to present with a three-year history of anti-diabetic treatment (by oral therapies and/or insulin). Fragility fractures were confirmed by review of medical records and previous radiographs. All radiographs were reviewed by a board-certified musculoskeletal radiologist (TML). Spine fractures were graded semi-quantitatively according to Genant et al (21). A fragility fracture was defined as a fracture resulting from low impact trauma such as a fall from standing height. Fracture patients only qualified for the study if their fragility fracture(s) had occurred after menopause (Fx group) and after the onset of diabetes and menopause (DMFx group). Patients were not eligible for participation if they had juvenile or premenopausal idiopathic osteoporosis, a history of severe neuropathic disease, recent history of immobilization (>3 months), hyperparathyroidism, hyperthyroidism, immobilization, alcoholism, chronic drug use, chronic gastrointestinal disease, significant chronic renal impairment (i.e. chronic kidney disease [CKD stages IV and V], chronic hepatic impairment, unstable cardiovascular disease and uncontrolled hypertension. Chronic treatment with antacids, estrogen, rosiglitazone, pioglitazone, adrenal or anabolic steroids, anticonvulsants, anticoagulants, pharmacological doses of vitamin A supplements, fluorides, bisphosphonates, calcitonin, and/or tamoxifen was also an exclusion criterion. The study protocol was approved by the University of California, San Francisco Committee of Human Research. Before enrollment, all patients gave written informed consent.
Laboratory Analyses
Fasting blood was drawn between 8 and 11am and samples were sent to a Bay Area branch of Quest Diagnostics (Madison, NJ) for analysis. The test panel included serum calcium, parathyroid hormone (PTH), 25-OH Vitamin D3, fasting glucose, HbA1c, and C-reactive protein (CRP).
Dual-energy X-ray absorptiometry (DXA)
Areal bone mineral bone density (aBMD) was determined by DXA of the lumbar spine (L1-L4) and the proximal femur (femoral neck and total hip region) (Prodigy, GE/Lunar, Milwaukee, WI, USA). Quality assurance was performed in accordance with guidelines of the International Society of Clinical Densitometry (22).
Quantitative Computed Tomography (QCT)
Volumetric bone mineral bone density (vBMD) of the lumbar spine (L1-L3) was assessed by quantitative computed tomography using a 64-row multi-detector CT scanner (GE Healthcare, Milwaukee, WI). QCT scans were acquired with a density calibration phantom placed underneath each patient (Mindways Osteoporosis Phantom, Mindways, Austin, TX). The scan region covered mid-T12 to mid-L4. The scan protocol was standardized and consisted of a tube voltage of 120kVp, and a tube load of 200mAs. Slice thickness was 2.5 mm. QCT scans were analyzed on a remote workstation using a commercially available software (QCT Pro; Mindways, Austin, TX). Vertebral bodies (L1-L3) were aligned and centered to facilitate the automated detection of the regions of interest by the software. The vertebral ROIs (1cm thick; oval shape) were located in the anterior three quarters of the vertebral bodies L1, L2 and L3, equidistant to both endplates.
Magnetic Resonance Imaging
Using a 4-channel spine coil, MR scans were acquired on a 3Tesla scanner (Signa HDx, GE Healthcare, Milwaukee, WI, USA). For spectroscopy prescription, we used a sagittal T2-weighted fast spin echo (FSE) sequence [echo time (TE) 85 ms, repetition time (TR) 5000 ms, echo train length 32, bandwidth 62.2 kHz; field of view (FOV) 22 cm; slice thickness 5 mm; spacing 1 mm]. Unless spine fractures or focal lesions (e.g. hemangiomas) were identified, the spectroscopy measurement box (15×15×20mm) was placed in the center of the vertebral bodies L1, L2, and L3 (Figure 1). The Point Resolved Spectroscopy (PRESS) method was used and the spectroscopy sequence parameters were: echo time (TE) 37 ms, repetition time (TR) 3000 ms, 64 averages without water suppression, sweep width = 5000 Hz, data points = 4096. To eliminate potential confounding by surrounding signal, we used six outer volume saturation bands. Moreover, we applied default auto-shimming as provided by the manufacturer.
Figure 1. Bone Marrow Spectroscopy by MRI (3 Tesla).
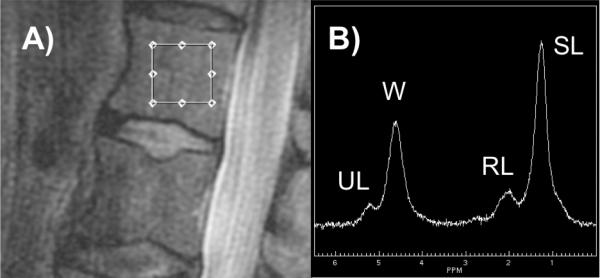
A) Dimension and location of spectroscopy measurement box. B) Representative bone marrow spectrum with individual peaks for saturated lipids (SL), unsaturated lipids (UL), residual lipids (RL), and water (W) after fitting.
MR-Image analysis
All MR-images were reviewed by a board-certified musculoskeletal radiologist (TML). Spectroscopy data were transferred to a research workstation. Using an in-house developed software, corrections for phase, frequency shift, and baseline distortion were performed on reconstructed spectral data (23). Four main peaks were resolved and included unsaturated lipids (UL; oleofinic double-bond –CH =CH-protons at 5.3 ppm), water (at 4.7 ppm), residual lipids (RL; CH2 methylene protons alpha to a double bond –CH = CHCH2- at 2.0 ppm), and saturated lipids (SL; bulk CH2 methylene protons at 1.3 ppm; Figure 1). As previously described (13,24), the peaks were fitted to obtain their line widths and areas. MRS analyses were performed with automated fitting and quantification software. If necessary, manual adjustment of spectral fitting was performed by a MR-spectroscopy expert (XL) who was blinded to individual patient characteristics such as diabetes and fracture status. Subsequently, total bone marrow fat content (FC) was calculated for each vertebral level (L1, L2, L3) using the following equation: FC (%) = [(UL+SL+RL/(UL+SL+RL+water)] × 100 %. Unsaturation level was calculated as UL (%) = [UL/(UL+SL+RL)] × 100 %. Saturation level was calculated as SL (%) = [SL/(UL+SL+RL)] × 100 %. Residual lipids were calculated as RL (%) = [RL/(UL+SL+RL)] × 100 %. Subsequently, patient-specific means were calculated for FC, UL, SL, and RL of L1-L3. Reproducibility data FC and UL for were provided in a previous publication (CVFC = 1.7%; CVUL= 10.7%) (13).
Statistical Analysis
PASW Statistics 18.0 Statistical Database Software (IBM, Armonk, NY) was used for data analysis. Data distribution was explored by Shapiro-Wilk tests, inspection of histograms, normal and detrended Q-Q plots and boxplots.
For each of the four study groups (i.e. Co, Fx, DM, DMFx). Means and standard deviations were calculated for age, BMI, BMD, T-Scores, laboratory analyses, FC, UL, SL, and RL. One-way ANOVA and subsequent Tukey-Kramer tests were performed to identify significant group differences in age, BMI, BMD, T-Scores, lab results, and MRS. In addition, one-way ANOVA was performed to detect clinical differences between diabetics and non-diabetics (i.e. DM + DMFx versus Co + Fx), and between fracture and non-fracture patients (i.e. Fx + DMFx versus Co + DM). Linear regression models, adjusted for age, race, and spine BMD by QCT, were used to assess the relationships between bone marrow fat content, unsaturated lipids, saturated lipids, residual lipids, fracture, and diabetes. Statistical significance was defined as p < 0.05.
Results
Demographics And clinical characteristics
Patient demographics and clinical characteristics are presented in Table 1. Fx and DMFx were significantly older than non-diabetic Co (p<0.012). Mean BMI did not differ among the four groups. Serum calcium, PTH, and CRP were within the normal healthy range and did not differ between Co, Fx, DM, and DMFx. 25-OH vitamin D was highest in non-diabetic Fx, and the group differences of 25-OH-vitamin D levels reached significance versus Co, Fx, and DMFx. The pooled ANOVA of diabetics (DM + DMFx) versus non-diabetics (Co + Fx) revealed significantly lower vitamin D levels in diabetics than non-diabetics (p=0.034). The pooled ANOVA of fracture (Fx + DMFx) versus non-fracture (Co + DM) patients yielded significantly higher 25-OH vitamin D levels in fracture than non-fracture patients (p=0.010).
Table 1.
Demographic, metabolic, and densitometric characteristics of study participants (n=69).
| Co (n=17) | Fx (n=19) | DM (n=16) | DMFx (n=17) | |
|---|---|---|---|---|
| DEMOGRAPHICS | ||||
| Age (yrs) | 60.0 ± 4.9 | 65.2 ± 5.3a | 61.1 ± 4.2 | 65.5 ± 4.7a |
| BMI (kg/m2) | 25.8 ± 4.9 | 25.3 ± 3.5 | 27.1 ± 3.3 | 27.6 ± 4.7 |
| Caucasian (%) | 64.7% | 84.2% | 31.3% | 35.3% |
| Asian (%) | 23.5% | 10.5% | 43.8% | 29.4% |
| African-American (%) | 0.0% | 0.0% | 12.5% | 29.4% |
| Hispanic (%) | 11.8% | 5.3% | 6.3% | 0.0% |
| Native Hawaiian/Pacific Islander (%) | 0.0% | 0.0% | 6.3% | 5.9% |
| METABOLISM | ||||
| Calcium (mg/dl) | 9.6 ± 0.3 | 9.5 ± 0.4 | 9.5 ± 0.3 | 9.6 ± 0.4 |
| PTH (pg/ml) | 34.9 ± 13.4 | 34.3 ± 24.2 | 37.8 ± 15.2 | 38.8 ± 25.9 |
| 25-OH Vitamin D3 (ng/ml) | 30.1 ± 11.2 | 42.1 ± 11.7a | 28.1 ± 11.9b | 31.5 ± 13.2b |
| Fasting Glucose (mg/dl) | 89.3 ± 10.0 | 91.1 ± 11.8 | 159.9 ± 78.6a,b | 146.4 ± 67.6a,b |
| HbA1c (%) | 5.8 ± 0.3 | 5.9 ± 0.4 | 7.6 ± 1.5a,b | 7.8 ± 2.8a,b |
| CRP (mg/dl) | 0.3 ± 0.5 | 0.3 ± 0.3 | 0.3 ± 0.3 | 0.2 ± 0.2 |
| BONE MINERAL DENSITY (DXA) | ||||
| BMD L1-L4 (g/cm2) | 1.132 ± 0.197 | 0.994 ± 0.156 | 1.159 ± 0.142b | 1.088 ± 0.132 |
| T-Score L1-L4 | -0.4 ± 1.6 | -1.4 ± 1.3 | -0.2 ± 1.2b | -0.8 ± 1.1 |
| BMD Femoral Neck (g/cm2) | 0.872 ± 0.119 | 0.832 ± 0.071 | 0.897 ± 0.076 | 0.834 ± 0.098 |
| T-Score Femoral Neck | -1.2 ± 0.87 | -1.5 ± 0.5 | -1.0 ± 0.5 | -1.5 ± 0.7 |
| BMD Total Hip (g/cm2) | 0.909 ± 0.120 | 0.850 ± 0.096 | 0.980 ± 0.080b | 0.899 ± 0.095 |
| T-Score Total Hip | -0.8 ± 1.0 | -1.3 ± 0.8 | -0.2 ± 0.6b | -0.9 ± 0.8 |
| BONE MINERAL DENSITY (QCT) | ||||
| BMD L1-L3 (mg/cm3) | 127.4 ± 29.3 | 100.3 ± 24.6a | 136.7 ± 34.5b | 104.4 ± 16.1c |
Data are expressed as means ± SD. Boldface indicates significant differences.
p<0.05 versus Co
p<0.05 versus Fx
p<0.05 versus DM.
Eleven patients had multiple fragility fractures (Fx: n=3; DMFx: n=8), thus the total number of prevalent postmenopausal fragility fractures was 50 (in 36 patients). Specifically, fracture sites for the Fx group (n=22 fractures in 19 patients) included the ankle (n=9), vertebrae (n=5; Grade 1: n=1; Grade 2: n=3; Grade 3: n=1), metatarsals (n=3), humerus (n=2), wrist (n=1), elbow (n=1) and pelvis (n=1). In the DMFx group (n=28 fractures in 17 patients), fractures sites included ankle (n=7), vertebrae (n=5; Grade 1: n=3; Grade 2: n=1; Grade 3: n=1), metatarsals (n=8), humerus (n=3), wrist (n=2), elbow (n=1), patella (n=1), and rib (n=1).
Bone Mineral Density
Bone mineral density results for spine and hip are shown in Table.1. DXA was performed in all but one patient who suffered a sudden back pain attack, which did not allow the completion of all study procedures. Another patient's spine DXA had to be excluded because of degenerative disease and scoliosis. QCT data were available from all patients. Mean T-scores measured with DXA in the Co, Fx, DM, and DMFx cohorts were in the osteopenic range. Vertebral and total hip aBMD were highest in non-fractured DM and lowest in non-diabetic Fx patients (spine aBMD p=0.019; total hip aBMD p=0.001). Differences between non-fractured and fractured DM women were not significant (p>0.05) with DXA while QCT BMD measurements were significantly lower in DMFx than DM (p=0.005). QCT spinal BMD was also lower in Fx versus Co (p=0.018).
Bone Marrow Fat
MR-Spectroscopy data were available from all 69 patients (L1 65/69, L2 66/69, L3 64/69). FC in the three vertebral levels was highly correlated (L1/L2: r=0.892, L1/L3: r=0.891; L2/L3: r=0.910; p for all < 0.001) UL (L1/L2: r=0.555; L1/L3: r=0.511; L2/L3: r=0.567; p for all < 0.001) and SL (L1/L2: r=0.562; L1/L3: r=0.508; L2/L3: r=0.581; p for all < 0.001) were also highly correlated across vertebral levels. Since the intervertebral levels were so highly correlated, the patient-specific means, calculated from the available L1, L2, and L3 values, were used in all subsequent analyses. The linewidth of each peaks were similar between the three vertebral levels, and the mean linewidth (combining data from all levels) of the water, unsaturated lipids and saturated lipids were 54.2 ± 6.9 Hz, 47.7 ± 14.0 Hz, 54.9 ± 8.3 Hz, (mean ± SD), respectively. Adjusted means (± standard error of the mean; SEM) for total marrow fat, unsaturation levels, saturation levels, and residual lipids are given in Table 2. Adjustment was performed for age, race, and spine BMD by QCT. DMFx had the lowest unsaturation levels (versus Co p<0.001; versus DM p=0.036). There were statistical trends towards lower unsaturation levels in Fx versus Co (p=0.086) and DM versus Co (p=0.077). Vice versa, saturated bone marrow lipids were highest in DMFx (versus Co p<0.001). DM without fractures also had higher saturated bone marrow lipids than Co (p= 0.018).
Table 2.
Bone marrow fat content and composition by MR-spectroscopy (MRS)
| BONE MARROW FAT (by MR-Spectroscopy) | Co (n=17) | Fx (n=19) | DM (n=16) | DMFx (n=17) |
|---|---|---|---|---|
| Total Bone Marrow Fat Content (%) | 71.7 ± 2.2 | 65.1 ± 2.1 | 70.7 ± 2.5 | 69.4 ± 2.4 |
| Bone Marrow Fat Unsaturation (%) | 7.4 ± 0.5 | 6.1 ± 0.5 | 6.4 ± 0.6 | 4.3 ± 0.6a,c |
| Bone Marrow Fat Saturation (%) | 75.3 ± 1.1 | 78.2 ± 1.2 | 79.2 ± 1.0a | 82.0 ± 1.1a |
| Residual Bone Marrow Lipids (%) | 17.3 ± 0.7 | 15.7 ± 0.8 | 14.4 ± 0.7a | 13.7 ± 0.7a |
Data are averaged for L1-L3, means are adjusted for age, race, spine BMD by QCT ± SEM. Boldface indicates significant differences.
p<0.05 versus Co
bp<0.05 versus Fx,
p<0.05 versus DM.
Residual lipids were lower in DM and DMFx than Co (p=0.021; p<0.001). Comparisons of absolute group differences and a 2-way ANOVA with adjustment for age and race, and spine BMD by QCT indicated no interaction between diabetes and fracture cohorts for total marrow fat content (p=0.531), unsaturated lipid levels (p=0.749), saturated lipids (p=0.735), and residual lipids (p=0.443).
In linear regression models adjusted for age, race, and spine BMD by QCT that included both fracture and diabetes status, fracture was associated with -1.7% lower unsaturation levels (confidence interval [CI -2.8% to -0.5%], p=0.005). Diabetes was associated with -1.3% lower unsaturation levels [CI -2.3% to -0.2%; p=0.018). Vice versa, saturation levels were significantly associated with positive fracture status (+2.9% [CI 0.5% – 5.3%], p=0.017) and diabetes (+3.3% [CI 1.1% - 5.4%], p=0.004). Coherently, diabetics with fractures (DMFx) had the lowest unsaturation levels and the highest saturation levels (Figure 2). Moreover, diabetes but not fracture was associated with 2.0% lower residual lipids ([CI -3.4% to -0.6%], p=0.007). In a similar regression model for bone marrow fat as outcome measure, there were no associations of total bone marrow fat and fracture (B = -0.044 [CI -0.093 to +0.006], p = 0.082) or diabetes (B = 0.023 [CI = -0.018 to +0.063], p = 0.267).
Figure 2. Bone marrow fat composition in controls (Co), postmenopausal women with fragility fractures (Fx), diabetic postmenopausal women without fractures (DM) and diabetic postmenopausal women with fragility fractures (DMFx).
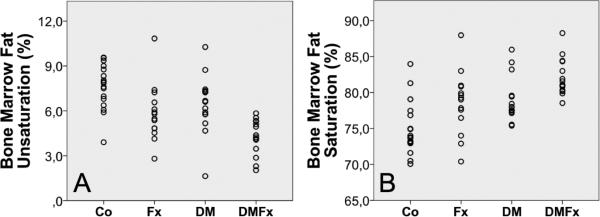
A. Unsaturation levels B. Saturation levels
Discussion
Previous studies of human bone biopsies and MRI-based imaging studies have shown an inverse association between bone marrow adiposity and bone mineral density (13,16,17). Only a small number of studies have investigated bone marrow fat content in patients with clinical or radiologic signs of impaired bone quality beyond low BMD (25,26). Due to recent advances in MR-imaging, non-invasive research in bone marrow fat research has been given a novel perspective: Bone marrow fat composition seems to be of relevance and can be quantified by MR spectroscopy. Two MR-imaging studies found independently that bone marrow fat unsaturation was particularly low in patients with low bone mass (18) and diabetes mellitus (19). Extending on these data obtained from non-fracture patients, we have designed a study to specifically examine bone marrow fat content and composition in diabetic and non-diabetic women with prevalent fragility fractures and to compare them with non-fractured controls with and without diabetes.
The principal and novel finding of this study was that fracture and type-2 diabetes were associated with low bone marrow fat unsaturation and high bone marrow fat saturation levels independent of age, race, and local BMD. Our data suggest that the link between fracture history and altered bone marrow fat composition is independent of diabetes and vice versa. Highlighting a combined aggravating effect of the two independent factors fracture and diabetes, diabetic patients with fractures had the lowest unsaturation and the highest saturation levels (Figure 2).
Total marrow fat content was similar in fracture and non-fracture patients, irrespective of diabetes. In contrast, two previous studies have reported increased marrow fat content with fracture, but these studies were limited to vertebral fractures (25,27). Our study included primarily non-vertebral fractures, and it is possible that this relationship is stronger with vertebral fracture. From a diagnostic research perspective, the lack of group differences in total bone marrow fat was particularly interesting because it suggests an added value of measuring bone marrow fat composition instead of determining only fat fraction. Our data suggest that bone marrow fat unsaturation and/or saturation indices could be promising predictive parameters that could complement fracture risk assessment by BMD. Further, we found compositional analyses of bone marrow fat to be particularly promising in type-2 diabetic patients in whom clinical fracture risk is typically too high for a given T-score (28,29). Therefore, it seems of clinical interest that type 2 diabetes does not seem to be a limiting factor for the interpretation of MR-spectroscopy.
From a clinical perspective our fracture and non-fracture patients were comparable. We adjusted for existing differences in race and age. With respect to laboratory analyses, only 25-(OH) vitamin D was significantly higher in fracture than in non-fracture patients. This finding was counter-intuitive at first glance, but upon chart review we found that patients with fractures were more likely to use vitamin D supplements, perhaps in response to their fracture history.
At this point in time it certainly needs to be stressed that – in spite of promising in-vivo results - the pathophysiology and systemic impact of abnormal bone marrow fat composition as expressed by low unsaturation and high saturation in fracture patients is a matter of future research. On the one hand, several studies have provided independent evidence that dietary intake of n-3 poly-unsaturated fatty acids (PUFA) and the right n-3/n-6 PUFA ratio might be crucial for BMD (30-32) and hip fracture risk (20). In addition, PUFA have been shown to be able to modulate cellular activity of osteoblasts and osteoclasts (33,34), and calcium metabolism (35,36). On the other hand side, higher consumption of saturated fatty acids seems linked with osteoporotic fractures (37). However, it is unknown how dietary fat intake relates to bone marrow fat composition, the parameter that we have measured in our study. Bone marrow fat unsaturation levels were particularly low in diabetics, especially those with prevalent fragility fractures. The opposite was the case for saturated bone marrow fat which was higher in diabetics than non-diabetics and highest in diabetics with fractures. The pathophysiologic mechanisms involved in bone marrow fat changes seen in diabetics are likely to be even more complex than in nondiabetics. However, potential pathways that might be of relevance in diabetics include the concept of accelerated adipocyte senescence resulting from poor glycemic control (38-41), the accumulation of secondary diabetic complications and the potential anti-diabetic properties of dietary PUFA (42). In our patients low bone marrow fat unsaturation and high bone marrow fat saturation levels co-occurred in fracture subjects, thus at this point it remains unclear if one aspect of this imbalance might precede in appearance and relevance or if both components of this are part of the same underlying pathophysiological process.
Our study has some limitations. Although we found significant differences between fracture and non-fracture patients, the total number of patients enrolled (n=69) was relatively small. The racial and ethnical composition of our study groups was heterogeneous. Using current in vivo MRS techniques, the reproducibility of unsaturation level quantification was less optimal as compared to the fat content quantification. However, the percent differences in unsaturation level between the groups are much higher than the CV of 10.7% (for example, it was (4.3-6.4)/6.4=-32.8% between the DM and DMFx groups, Table 2). MRS sequences using long TEs (43) or other further technique development can potentially increase the quantification reproducibility of the unsaturation level using in vivo MRS. Due to the invasiveness of a bone biopsy, we do not have a direct confirmation of our findings at the tissue level. Nevertheless, recent ex-vivo biopsy data obtained by high-resolution magic angle spinning (HRMAS) NMR spectroscopy, confirmed our findings and showed low bone marrow fat unsaturation levels in iliac crest samples of patients with osteoporotic fractures (44). Another weakness might be that we have only performed spectroscopic analyses of a single skeletal region (i.e. the lumbar spine). We would also like to point out that as defined by our inclusion criteria fracture patients had spinal and/or peripheral fragility fractures. While it is interesting that vertebral bone marrow fat composition appears to be a determinant of fracture prevalence of all sfracture sites combined, we would also like to stress that this does not exclude potentially relevant interactions between fracture types (such as e.g. spinal fractures versus hip fractures or peripheral fractures) and distinct compositional changes in bone marrow fat. It should also be kept in mind that the pool of both saturated and unsaturated lipids found in the human body is large and the type of non-invasive MR-spectroscopy used in this study cannot resolve individual fatty acids. Although it is certainly arguable that MR-spectroscopy is a challenging tool for clinical fracture risk assessment because of complex methodology, high costs and longer scan-time than DXA or QCT, it should be stressed that data acquisition would be feasible in clinical settings e.g. following routine MR imaging of the lumbar spine. Coil and patient set-up for MR-spectroscopy up do not differ from a normal spine exams. Future research in larger fracture cohorts should aim to study the relationship of bone marrow fat composition with age and gender. It would be also important to investigate if nutritional interventions with diets or supplements that are rich in unsaturated lipids could influence bone marrow fat composition. Likewise, we need to explore the impact of anti-osteoporotic drugs, and the effects of weight gain/weight loss on bone marrow fat content and composition.
In conclusion, the results of our study indicate that bone marrow fat composition differs between postmenopausal women with and without prevalent fragility fractures. In addition, type 2 diabetes mellitus seems independently associated with low unsaturation and high saturation levels, which is highlighted by a cumulative negative effect in diabetic patients with prevalent fractures. Bearing in mind the diagnostic limitations of densitometric techniques, our findings suggest that the MRI-based analysis of bone marrow composition might serve as a novel imaging tool for the non-invasive, BMD-independent assessment of high fracture-risk. Future research should seek to integrate imaging findings with emerging insights in marrow adipocyte biology to understand the pathomechanisms that drive these changes.
Acknowledgements
The authors thank Thelma Munoz and Melissa Guan for their help in patient recruitment and consenting. Moreover, we are grateful to Michael Weber, PhD, for his greatly valued advise on statistical techniques. This study was supported by NIH RC1 AR058405 (to TML) and the Erwin-Schrödinger Grant No. J-3079 (Austrian Science Fund; to JMP).
Authors’ Roles
Study design: AVS, and TML. Study conduct: AVS, TML. Data collection: SPY, TB, JMP, and DK. Data analysis: JMP, TB, SPY, XL. Data interpretation: JMP, AVS, XL, TML. Drafting manuscript: JMP, TML. Revising manuscript content: JMP, AVS, XL, DK and TML. Approving final version of manuscript: JMP, XL, SPY, DK, TB, AVS, TML. JMP takes responsibility for the integrity of the data analysis.
Footnotes
Disclosures
All authors state that they have no conflicts of interest.
References
- 1.Rosen CJ, Bouxsein ML. Mechanisms of disease: is osteoporosis the obesity of bone? Nat Clin Pract Rheumatol. 2006;2(1):35–43. doi: 10.1038/ncprheum0070. [DOI] [PubMed] [Google Scholar]
- 2.Lecka-Czernik B. Marrow fat metabolism is linked to the systemic energy metabolism. Bone. 2012;50(2):534–539. doi: 10.1016/j.bone.2011.06.032. [DOI] [PMC free article] [PubMed] [Google Scholar]
- 3.Kassem M, Marie PJ. Senescence-associated intrinsic mechanisms of osteoblast dysfunctions. Aging Cell. 2011;10(2):191–197. doi: 10.1111/j.1474-9726.2011.00669.x. [DOI] [PubMed] [Google Scholar]
- 4.Foo C, Frey S, Yang HH, Zellweger R, Filgueira L. Downregulation of beta-catenin and transdifferentiation of human osteoblasts to adipocytes under estrogen deficiency. Gynecological endocrinology : the official journal of the International Society of Gynecological Endocrinology. 2007;23(9):535–540. doi: 10.1080/09513590701556483. [DOI] [PubMed] [Google Scholar]
- 5.Warriner AH, Mugavero MJ. Bone changes and fracture risk in individuals infected with HIV. Current rheumatology reports. 2010;12(3):163–169. doi: 10.1007/s11926-010-0099-9. [DOI] [PubMed] [Google Scholar]
- 6.Buehring B, Kirchner E, Sun Z, Calabrese L. The frequency of low muscle mass and its overlap with low bone mineral density and lipodystrophy in individuals with HIV--a pilot study using DXA total body composition analysis. Journal of clinical densitometry : the official journal of the International Society for Clinical Densitometry. 2012;15(2):224–232. doi: 10.1016/j.jocd.2011.10.003. [DOI] [PubMed] [Google Scholar]
- 7.Rigotti NA, Nussbaum SR, Herzog DB, Neer RM. Osteoporosis in women with anorexia nervosa. The New England journal of medicine. 1984;311(25):1601–1606. doi: 10.1056/NEJM198412203112503. [DOI] [PubMed] [Google Scholar]
- 8.Kawai M, de Paula FJ, Rosen CJ. New insights into osteoporosis: the bone-fat connection. J Intern Med. 2012 doi: 10.1111/j.1365-2796.2012.02564.x. [DOI] [PMC free article] [PubMed] [Google Scholar]
- 9.Krings A, Rahman S, Huang S, Lu Y, Czernik PJ, Lecka-Czernik B. Bone marrow fat has brown adipose tissue characteristics, which are attenuated with aging and diabetes. Bone. 2012;50(2):546–552. doi: 10.1016/j.bone.2011.06.016. [DOI] [PMC free article] [PubMed] [Google Scholar]
- 10.Gimble JM, Nuttall ME. Bone and fat: old questions, new insights. Endocrine. 2004;23(2-3):183–188. doi: 10.1385/ENDO:23:2-3:183. [DOI] [PubMed] [Google Scholar]
- 11.Bauer JS, Link TM. Advances in osteoporosis imaging. European journal of radiology. 2009;71(3):440–449. doi: 10.1016/j.ejrad.2008.04.064. [DOI] [PubMed] [Google Scholar]
- 12.Griffith JF, Yeung DK, Chow SK, Leung JC, Leung PC. Reproducibility of MR perfusion and (1)H spectroscopy of bone marrow. Journal of magnetic resonance imaging : JMRI. 2009;29(6):1438–1442. doi: 10.1002/jmri.21765. [DOI] [PubMed] [Google Scholar]
- 13.Li X, Kuo D, Schafer AL, Porzig A, Link TM, Black D, Schwartz AV. Quantification of vertebral bone marrow fat content using 3 Tesla MR spectroscopy: reproducibility, vertebral variation, and applications in osteoporosis. J Magn Reson Imaging. 2011;33(4):974–979. doi: 10.1002/jmri.22489. [DOI] [PMC free article] [PubMed] [Google Scholar]
- 14.Justesen J, Stenderup K, Ebbesen EN, Mosekilde L, Steiniche T, Kassem M. Adipocyte tissue volume in bone marrow is increased with aging and in patients with osteoporosis. Biogerontology. 2001;2(3):165–171. doi: 10.1023/a:1011513223894. [DOI] [PubMed] [Google Scholar]
- 15.Meunier P, Aaron J, Edouard C, Vignon G. Osteoporosis and the replacement of cell populations of the marrow by adipose tissue. A quantitative study of 84 iliac bone biopsies. Clinical orthopaedics and related research. 1971;80:147–154. doi: 10.1097/00003086-197110000-00021. [DOI] [PubMed] [Google Scholar]
- 16.Bredella MA, Torriani M, Ghomi RH, Thomas BJ, Brick DJ, Gerweck AV, Rosen CJ, Klibanski A, Miller KK. Vertebral bone marrow fat is positively associated with visceral fat and inversely associated with IGF-1 in obese women. Obesity. 2011;19(1):49–53. doi: 10.1038/oby.2010.106. [DOI] [PMC free article] [PubMed] [Google Scholar]
- 17.Griffith JF, Yeung DK, Antonio GE, Lee FK, Hong AW, Wong SY, Lau EM, Leung PC. Vertebral bone mineral density, marrow perfusion, and fat content in healthy men and men with osteoporosis: dynamic contrast-enhanced MR imaging and MR spectroscopy. Radiology. 2005;236(3):945–951. doi: 10.1148/radiol.2363041425. [DOI] [PubMed] [Google Scholar]
- 18.Yeung DK, Griffith JF, Antonio GE, Lee FK, Woo J, Leung PC. Osteoporosis is associated with increased marrow fat content and decreased marrow fat unsaturation: a proton MR spectroscopy study. Journal of magnetic resonance imaging : JMRI. 2005;22(2):279–285. doi: 10.1002/jmri.20367. [DOI] [PubMed] [Google Scholar]
- 19.Baum T, Yap SP, Karampinos DC, Nardo L, Kuo D, Burghardt AJ, Masharani UB, Schwartz AV, Li X, Link TM. Does vertebral bone marrow fat content correlate with abdominal adipose tissue, lumbar spine bone mineral density, and blood biomarkers in women with type 2 diabetes mellitus? Journal of magnetic resonance imaging : JMRI. 2012;35(1):117–124. doi: 10.1002/jmri.22757. [DOI] [PMC free article] [PubMed] [Google Scholar]
- 20.Farina EK, Kiel DP, Roubenoff R, Schaefer EJ, Cupples LA, Tucker KL. Dietary intakes of arachidonic acid and alpha-linolenic acid are associated with reduced risk of hip fracture in older adults. J Nutr. 2011;141(6):1146–1153. doi: 10.3945/jn.110.133728. [DOI] [PMC free article] [PubMed] [Google Scholar]
- 21.Genant HK, Wu CY, van Kuijk C, Nevitt MC. Vertebral fracture assessment using a semiquantitative technique. Journal of bone and mineral research : the official journal of the American Society for Bone and Mineral Research. 1993;8(9):1137–1148. doi: 10.1002/jbmr.5650080915. [DOI] [PubMed] [Google Scholar]
- 22.Lewiecki EM, Gordon CM, Baim S, Leonard MB, Bishop NJ, Bianchi ML, Kalkwarf HJ, Langman CB, Plotkin H, Rauch F, Zemel BS, Binkley N, Bilezikian JP, Kendler DL, Hans DB, Silverman S. International Society for Clinical Densitometry 2007 Adult and Pediatric Official Positions. Bone. 2008;43(6):1115–1121. doi: 10.1016/j.bone.2008.08.106. [DOI] [PubMed] [Google Scholar]
- 23.Nelson SJ. Analysis of volume MRI and MR spectroscopic imaging data for the evaluation of patients with brain tumors. Magnetic resonance in medicine : official journal of the Society of Magnetic Resonance in Medicine / Society of Magnetic Resonance in Medicine. 2001;46(2):228–239. doi: 10.1002/mrm.1183. [DOI] [PubMed] [Google Scholar]
- 24.Li X, Youngren JF, Hyun B, Sakkas GK, Mulligan K, Majumdar S, Masharani UB, Schambelan M, Goldfine ID. Technical evaluation of in vivo abdominal fat and IMCL quantification using MRI and MRSI at 3 T. Magnetic resonance imaging. 2008;26(2):188–197. doi: 10.1016/j.mri.2007.06.006. [DOI] [PMC free article] [PubMed] [Google Scholar]
- 25.Schellinger D, Lin CS, Hatipoglu HG, Fertikh D. Potential value of vertebral proton MR spectroscopy in determining bone weakness. AJNR Am J Neuroradiol. 2001;22(8):1620–1627. [PMC free article] [PubMed] [Google Scholar]
- 26.Schellinger D, Lin CS, Lim J, Hatipoglu HG, Pezzullo JC, Singer AJ. Bone marrow fat and bone mineral density on proton MR spectroscopy and dual-energy X-ray absorptiometry: their ratio as a new indicator of bone weakening. AJR American journal of roentgenology. 2004;183(6):1761–1765. doi: 10.2214/ajr.183.6.01831761. [DOI] [PubMed] [Google Scholar]
- 27.Wehrli FW, Hopkins JA, Hwang SN, Song HK, Snyder PJ, Haddad JG. Cross-sectional study of osteopenia with quantitative MR imaging and bone densitometry. Radiology. 2000;217(2):527–538. doi: 10.1148/radiology.217.2.r00nv20527. [DOI] [PubMed] [Google Scholar]
- 28.Vestergaard P. Discrepancies in bone mineral density and fracture risk in patients with type 1 and type 2 diabetes--a meta-analysis. Osteoporosis international : a journal established as result of cooperation between the European Foundation for Osteoporosis and the National Osteoporosis Foundation of the USA. 2007;18(4):427–444. doi: 10.1007/s00198-006-0253-4. [DOI] [PubMed] [Google Scholar]
- 29.Schwartz AV, Vittinghoff E, Bauer DC, Hillier TA, Strotmeyer ES, Ensrud KE, Donaldson MG, Cauley JA, Harris TB, Koster A, Womack CR, Palermo L, Black DM. Association of BMD and FRAX score with risk of fracture in older adults with type 2 diabetes. JAMA. 2011;305(21):2184–2192. doi: 10.1001/jama.2011.715. [DOI] [PMC free article] [PubMed] [Google Scholar]
- 30.Farina EK, Kiel DP, Roubenoff R, Schaefer EJ, Cupples LA, Tucker KL. Protective effects of fish intake and interactive effects of long-chain polyunsaturated fatty acid intakes on hip bone mineral density in older adults: the Framingham Osteoporosis Study. Am J Clin Nutr. 2011;93(5):1142–1151. doi: 10.3945/ajcn.110.005926. [DOI] [PMC free article] [PubMed] [Google Scholar]
- 31.Jarvinen R, Tuppurainen M, Erkkila AT, Penttinen P, Karkkainen M, Salovaara K, Jurvelin JS, Kroger H. Associations of dietary polyunsaturated fatty acids with bone mineral density in elderly women. European journal of clinical nutrition. 2012;66(4):496–503. doi: 10.1038/ejcn.2011.188. [DOI] [PubMed] [Google Scholar]
- 32.Weiss LA, Barrett-Connor E, von Muhlen D. Ratio of n-6 to n-3 fatty acids and bone mineral density in older adults: the Rancho Bernardo Study. The American journal of clinical nutrition. 2005;81(4):934–938. doi: 10.1093/ajcn/81.4.934. [DOI] [PubMed] [Google Scholar]
- 33.Griel AE, Kris-Etherton PM, Hilpert KF, Zhao G, West SG, Corwin RL. An increase in dietary n-3 fatty acids decreases a marker of bone resorption in humans. Nutr J. 2007;6:2. doi: 10.1186/1475-2891-6-2. [DOI] [PMC free article] [PubMed] [Google Scholar]
- 34.Watkins BA, Li Y, Seifert MF. Dietary ratio of n-6/n-3 PUFAs and docosahexaenoic acid: actions on bone mineral and serum biomarkers in ovariectomized rats. J Nutr Biochem. 2006;17(4):282–289. doi: 10.1016/j.jnutbio.2005.05.012. [DOI] [PubMed] [Google Scholar]
- 35.Coetzer H, Claassen N, van Papendorp DH, Kruger MC. Calcium transport by isolated brush border and basolateral membrane vesicles: role of essential fatty acid supplementation. Prostaglandins, leukotrienes, and essential fatty acids. 1994;50(5):257–266. doi: 10.1016/0952-3278(94)90164-3. [DOI] [PubMed] [Google Scholar]
- 36.Ortiz-Alvarado O, Miyaoka R, Kriedberg C, Leavitt DA, Moeding A, Stessman M, Monga M. Omega-3 fatty acids eicosapentaenoic acid and docosahexaenoic acid in the management of hypercalciuric stone formers. Urology. 2012;79(2):282–286. doi: 10.1016/j.urology.2011.08.022. [DOI] [PubMed] [Google Scholar]
- 37.Orchard TS, Cauley JA, Frank GC, Neuhouser ML, Robinson JG, Snetselaar L, Tylavsky F, Wactawski-Wende J, Young AM, Lu B, Jackson RD. Fatty acid consumption and risk of fracture in the Women's Health Initiative. The American journal of clinical nutrition. 2010;92(6):1452–1460. doi: 10.3945/ajcn.2010.29955. [DOI] [PMC free article] [PubMed] [Google Scholar]
- 38.Kirkland JL, Tchkonia T, Pirtskhalava T, Han J, Karagiannides I. Adipogenesis and aging: does aging make fat go MAD? Experimental gerontology. 2002;37(6):757–767. doi: 10.1016/s0531-5565(02)00014-1. [DOI] [PubMed] [Google Scholar]
- 39.Monickaraj F, Aravind S, Gokulakrishnan K, Sathishkumar C, Prabu P, Prabu D, Mohan V, Balasubramanyam M. Accelerated aging as evidenced by increased telomere shortening and mitochondrial DNA depletion in patients with type 2 diabetes. Molecular and cellular biochemistry. 2012;365(1-2):343–350. doi: 10.1007/s11010-012-1276-0. [DOI] [PubMed] [Google Scholar]
- 40.de Heredia FP, Larque E, Portillo MP, Canteras M, Zamora S, Garaulet M. Age-related changes in fatty acids from different adipose depots in rat and their association with adiposity and insulin. Nutrition. 2008;24(10):1013–1022. doi: 10.1016/j.nut.2008.03.022. [DOI] [PubMed] [Google Scholar]
- 41.Morley JE. Diabetes and aging: epidemiologic overview. Clin Geriatr Med. 2008;24(3):395–405. v. doi: 10.1016/j.cger.2008.03.005. [DOI] [PubMed] [Google Scholar]
- 42.Kalupahana NS, Claycombe KJ, Moustaid-Moussa N. (n-3) Fatty acids alleviate adipose tissue inflammation and insulin resistance: mechanistic insights. Adv Nutr. 2011;2(4):304–316. doi: 10.3945/an.111.000505. [DOI] [PMC free article] [PubMed] [Google Scholar]
- 43.Lundbom J, Hakkarainen A, Fielding B, Soderlund S, Westerbacka J, Taskinen MR, Lundbom N. Characterizing human adipose tissue lipids by long echo time 1H-MRS in vivo at 1.5 Tesla: validation by gas chromatography. NMR Biomed. 2010;23(5):466–472. doi: 10.1002/nbm.1483. [DOI] [PubMed] [Google Scholar]
- 44.Li X, Shet K, Rodriguez JP, Pino AM, Kurhanewicz J, Schwartz A, Rosen CJ. Unsaturation Level Decreased in Bone Marrow Lipids of Postmenopausal Women with Low Bone Density Using High Resolution HRMAS NMR. 34st Annual Conference of American Society of Bone Mineral Research (ASBMR); Minneapolis, MN, USA. Oct 9-12, 2012. [Google Scholar]