

Abstract
Background
In schizophrenia (SZ), disturbances in integration of activity among brain regions appear to be as important as abnormal activity of any single region. Brain regions are connected through white matter (WM) tracts, and diffusion tensor imaging (DTI) has provided compelling evidence for WM abnormalities in SZ. However, DTI alone cannot currently pinpoint the biological basis of these abnormalities.
Methods
In this study, we combined a myelin-specific and an axon-specific MRI approach to examine potentially distinct abnormalities of WM components in SZ. Magnetization transfer ratio (MTR) provides information on myelin content while diffusion tensor spectroscopy (DTS) provides information on metabolite diffusion within axons. We collected data from a 1x3x3cm voxel within the right prefrontal cortex WM at 4 Tesla and studied 23 patients with SZ and 22 age and sex matched healthy control participants.
Results
MTR was significantly reduced in SZ, suggesting reduced myelin content. By contrast, the apparent diffusion coefficient of N-acetylaspartate (NAA ADC) was significantly elevated, suggesting intra-axonal abnormalities. Greater abnormality of both MTR and NAA ADC correlated with more adverse outcomes in the patient group.
Conclusions
The results suggest that WM abnormalities in SZ include both abnormal myelination and abnormal NAA diffusion within axons. These processes may be associated with abnormal signal transduction and abnormal information processing in SZ.
Keywords: magnetic resonance spectroscopy, diffusion, white matter, frontal lobe, magnetization transfer ratio, N-acetylaspartate
INTRODUCTION
Diffusion tensor imaging (DTI) provides information about water molecule diffusion and yields three diffusion eigenvalues labeled λ1, λ2, and λ3 from largest to smallest. The brain’s white matter (WM) contains axon fibers, and water molecular diffusion takes place along the long axis of these fibers [axial diffusivity (AD)= λ1] more than perpendicular to it [radial diffusivity (RD)=(λ2+λ3)/2]. Fractional anisotropy (FA) reflects directionality of diffusion (isotropic vs. anisotropic). Finally, mean or apparent diffusion coefficient [ADC=(λ1+ λ2+λ3)/3] reflects the distance traveled by a molecule in unit time, partly reflecting geometry of the surrounding space. Past DTI studies have provided strong evidence for widespread disruptions in WM integrity in schizophrenia (SZ). FA reductions are associated with passivity phenomena (1), auditory hallucinations (2), impairments in working memory (3, 4) and executive function (5–8), and abnormal fMRI connectivity (9, 10). A related literature provides evidence of deficits in integration of large-scale neuronal networks (11–13) and in expression of myelin- and oligodendrocyte-related genes postmortem in SZ (14). Thus, abnormal integration of activity across brain regions appears critical to SZ pathophysiology.
Although WM abnormalities are central to SZ as an abnormal connection syndrome (15–17), the link between DTI and brain function remains abstract because of the non-specific nature of the DTI signal (18). FA, AD, and RD abnormalities are commonly interpreted as reflecting loss of “white matter integrity” but its exact nature cannot be determined using DTI alone. Water exists in intra- and extracellular compartments and there is exchange of water molecules between the two. Thus DTI abnormalities may reflect multiple processes (demyelination, fiber crossing, axonal swelling or atrophy) and even different abnormalities in different cases (19).
Separate in vivo measures of axon and myelin integrity would be valuable to address this issue. Notably, indices of axonal diameter and myelin sheath thickness would allow one to predict whether signal conduction speed is abnormal in SZ brains. Here, we utilize two MR-based approaches to probe specific WM abnormalities in SZ: magnetization transfer ratio (MTR) and diffusion tensor spectroscopy (DTS). MTR relies on magnetization exchange between water molecules in different physical environments. In biological tissue, “bound” water molecules around myelin lipids exchange protons with “free” water molecules. This exchange can be measured using a magnetization transfer paradigm where signal from “bound water” is saturated and the loss of “free water” signal (reflecting transfer to “bound water”) is measured. The larger the WM myelin component, the greater is the proton exchange, and the higher the MTR. MTR is reduced in SZ, suggesting reduced myelin complement in this condition (20, 21) although a recent study reported partially discrepant results (22).
DTS measures the diffusion of intracellular metabolites such as N-acetylaspartate (NAA). Because NAA is located exclusively in neurons and almost exclusively in the cytosol where diffusion is less restricted than within organelles (23), NAA diffusion provides specific information about intra-neuronal structure. DTS measures are based on molecular Brownian motion and are independent of metabolite concentration and transverse (T2) relaxation times; therefore the NAA reductions (24) and NAA T2 abnormalities (25) observed in SZ do not confound NAA diffusion. DTS approaches have been validated in a variety of contexts, including as probes of cellular diffusion (26) and in seminal studies of axon diameter (27). The only clinical studies using DTS are in acute cerebral ischemia, where NAA ADC is significantly reduced, (28–30) and MELAS (mitochondrial myopathy, encephalopathy, lactic acidosis, and stroke-like episodes), where it is elevated (31). The DTS parameter of greatest interest in the present study is NAA ADC which has no directionality. By contrast, FA as well as AD and RD scale with directionality of structures in the voxel, and macroscopic curvature artifacts render them uninterpretable in a large voxel (see Discussion). NAA ADC is informative about axon abnormalities: demyelination with preserved axon diameter would leave NAA ADC normal while changes in NAA diffusion within axons with preserved myelination would modify NAA ADC.
NAA ADC can be determined by axonal geometry or by NAA distribution within axonal organelles (e.g. mitochondria). Interactions between axon health and myelin sheath thickness are complex and bidirectional. Larger axons have thicker myelin sheaths, and vice versa. The ratio between axon diameter and fiber diameter (defined as axon diameter + myelin sheath thickness) is termed the g-ratio. The g-ratio evolves during brain development and reaches a level of 0.6 in adulthood (32–34). Divergence from this optimal g-ratio in either direction is associated with abnormalities in conduction speed (35).
The combination of MTR and DTS affords the ability to probe axon vs. myelin-related abnormalities separately in the human WM. Based on strong evidence for myelination abnormalities (36–39) as well as a mechanistic relationship between developmental myelination and SZ (40, 41), we hypothesized that myelin sheath thickness and MTR are reduced in SZ. Given the paucity of published information on axon structure in SZ, we could not predict NAA ADC changes.
METHODS
Participants
Following approval by the McLean Hospital IRB, we recruited 22 healthy controls from the community and 23 participants with SZ from the clinical services at McLean Hospital. Demographic and clinical characteristics of the study participants are provided in Table 1. See Supplementary Materials for details of inclusion/exclusion criteria, participant screening, and standard study procedures.
Table 1.
Demographic and clinical characteristics of study participants
| Healthy Control (N=22) | Schizophrenia (N=23) | Statistical Evaluation | |
|---|---|---|---|
| Age (y) | 31.4±6.7 | 34.0±9.2 | F(43,1)=1.19; p=0.286 |
| Gender | 12M, 10F | 14M, 9F | χ2=0.18; p=0.668 |
| BMI | 23.4±2.8 | 26.9±4.5 | F(42,1)=9.13; p=0.004 |
| Education* | 6.8±1.0 | 4.4±1.4 | F(42,1)=42.70; p<0.001 |
| Parental SES† | 5.9±1.0 | 5.5±1.6 | F(26,1)=0.46; p=0.505 |
| Age at onset (y) | -- | 21.8±6.8 | |
| Lifetime number of suicide attempts | -- | 1.5±2.5 | |
| Lifetime number of hospitalizations | -- | 6.7±6.1 | |
| MADRS | -- | 10.2±10.4 | |
| YMRS | -- | 8.1±7.8 | |
| PANSS | -- | 49.8±14.0 | |
| Lithium (No.) | -- | 3 | |
| Anticonvulsants (No.) | -- | 4 | |
| SGAs (No.) | -- | 19 | |
| FGAs (No.) | -- | 2 | |
| CPZ equivalents | -- | 501±459 | |
| Benzodiazepines (No.) | -- | 7 |
SGA: second generation antipsychotic; FGA: first generation antipsychotic. Other abbreviations as in the text.
Parental SES calculated according to the Hollingshead scale.
Education code: 3: graduated high school; 4: part college; 5: graduated 2 year college; 6: graduated 4 year college; 7: part graduate/professional school; 8: completed graduate/professional school
Magnetic Resonance Imaging and Spectroscopy
See Supplementary Materials for details of anatomic imaging and voxel placement (Figure 1).
Figure 1.
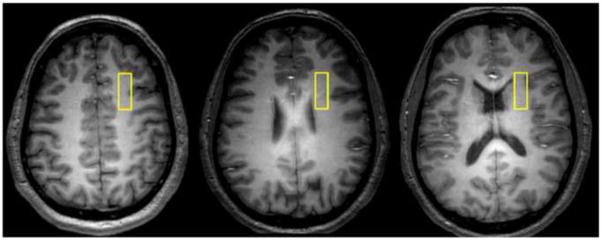
Representative axial images depicting the location of our 1x3x3cm white matter voxel in the right prefrontal cortex.
MTR
The MTR experiment relies on measuring water signal magnitude in the presence and absence of a saturation pulse, which causes saturation of signal coming from “bound” water molecules. Because there is exchange between “bound” and “free” water molecules, the saturation pulse measurably attenuates the signal coming from “free” water molecules (measured as the water resonance following the pulse) (Figure 2A). MTR is calculated based on water signal intensity acquired in the presence (Ms) and absence (Mc) of the saturation pulse [MTR = (Mc−Ms)/Mc].
Figure 2.

(A) MR spectra of the water resonance acquired from a healthy control participant in the presence (red) and absence (black) of the saturation pulse. The reduction in magnetization of the water resonance (ΔM) and the “restricted water” resonance (amplified scale) are also shown. ΔM forms the basis of calculations for the magnetization transfer ratio (MTR). (B) MTR presented from healthy controls (green), schizophrenia patients (red), and from a phantom (blue). The region highlighted by the box exhibits direct RF off-resonance effects and hence was excluded from the calculations presented in this paper.
We used a BISTRO saturation pulse train (42) constructed with multiple hyperbolic Sec pulses (width=50 ms) with varied RF pulse amplitudes and applied at the beginning of a standard point-resolved spectroscopy (PRESS) sequence (prior to the 90 degree pulse) to saturate “bound-water” signal with a specific frequency offset (42, 43). Data were obtained in 50 Hz steps at a range of frequencies offset 400 to 1000Hz in either direction from the water signal and a single MTR number was calculated by averaging across frequencies. Saturation time (tsat) was 2.6 s with TR/TE=3000/30ms and repetitions=2.
DTS measurements
The standard PRESS sequence was modified by incorporating diffusion gradients for DTS measurements. Bipolar diffusion gradients with 6 directions: [1,1,0] [1,0,1] [0,1,1] [−1,1,0] [−1,0,1] [0,−1,1] and one control [0,0,0] (totaling 7 spectra) were applied to calculate diffusion tensors of signal from water and metabolites. The applied b value was 1412 s/mm2, calibrated by a home-made phantom with water ADC assumed to be 2.1×10⁻³ mm2/s at room temperature (~20°C) (44). In these measurements, TR/TE=3000/135 ms, diffusion time (Dt)=60 ms, repetitions=96 and 4 for metabolites and water diffusion measurements, respectively. Metabolite spectra were acquired with water saturation using VAPOR (45). Free induction decays were stored separately prior to averaging for correction of frequency- and phase-drifts, and eddy currents resulting from diffusion gradients or instability of machine hardware. Total experiment time including MTR and DTS measurements of water and metabolites was around 70 minutes. The water data from the DTS experiment are analogous to DTI data from the literature with one major exception: they were collected from a large 1x3x3 cm3 voxel. In addition, before or after each human subject study, we carried out a phantom DTS scan to correct for measurement errors from potential machine instability.
MRI and MRS data processing/analysis
An MR physicist (FD) processed all MRI/MRS data blind to diagnosis. Post-processing of the free induction decays including apodization, Fourier transformation, frequency, phase, and eddy current correction of individual spectra in the DTS experiment, as well as calculation of MTR and DTS constants were carried out using software provided in the Varian Console and home-grown software running on MATLAB. Note that MTR and DTS measurements depend on relative signal change with saturation RF pulse or diffusion gradient, respectively. We digitized the water or NAA signal (resonance peak area) and normalized it to baseline, i.e. to the signal without RF saturation in MTR or to that without diffusion gradients in DTS. The units for ADC, RD, and AD are mm2/second x10−3.
We collected Creatine (Cr) and Choline (Cho) data along with NAA in our DTS studies. The SNR is lower for these metabolites than for NAA but it was possible to carry out analyses of Cho in our DTS data. This is valuable because Cho is compartmentalized differently from NAA, i.e. more of it is found in astrocytes than neurons (46). If Cho and NAA ADC show differential patterns in SZ, this would support the neuron—selective significance of NAA ADC.
Statistical approach
All analyses were carried out using SPSS (V.18). The statistical plan had three stages: tests of data quality, tests of our main hypotheses, and exploratory tests of associations between multiple variables in the dataset. First, two-sample t-tests and chi-square tests compared sample characteristics and signal-to-noise ratio (SNR) for the 135 ms DTS-PRESS spectrum (MRS data quality measure) across groups.
Second, we entertained our two main hypotheses: (1) that there would be a reduction in MTR and (2) NAA ADC may be abnormal in schizophrenia. These hypotheses were tested using two general linear models with MTR and NAA ADC as outcomes and diagnosis as predictor. Given the richness of the data we collected, we carried out parallel secondary analyses on NAA RD, AD and FA, and water RD, AD, and FA. Since age and smoking can impact white matter health, we reran the main analyses with these variables as covariates.
Third, we carried out a series of correlation analyses using Pearson’s coefficients (or Spearman where specifically mentioned for variables with skewed distribution). We examined correlations between the various diffusion variables in order to detect any possible structured covariance. We also examined the relationship between MTR and NAA ADC with age, education level, and BMI for the full dataset, and MTR and NAA ADC with duration of illness, lifetime number of suicide attempts, lifetime number of hospitalizations, NAART score, MCAS score, CPZ equivalents, PANNS, YMRS, and MADRS scores for the SZ group. In addition, we carried out ANOVAs with sex and race as independent variables and MTR or NAA ADC as the dependent variable. We did not control for multiple comparisons in any of these exploratory analyses because our goal was to allow detection of even modest relationships so they could be pursued in future studies. We were willing to accept the risk of Type-I error inherent in this approach because these didn’t concern our primary hypotheses and we did not have adequate power in this small clinical sample to correct for multiple comparisons.
RESULTS
See Table 1 for demographic and clinical variables; the two groups were well-matched with the exceptions usually noted in samples of patients with schizophrenia: BMI and participant educational attainment. In order to assess the reliability of our measures, we first carried out a test-retest study (see Supplementary Materials).
Magnetization Transfer Ratio (MTR) Spectroscopy
MTR measurements are described in Figure 2. Data from a phantom aqueous NaCl-solution showed a very low MTR of <1%, a face-valid finding because there is no “bound” water in an aqueous solution. In the human brain, “bound” water molecules (i.e. those interacting with lipids and proteins) cause a loss of water signal intensity, leading to a non-zero MTR. There was a significant reduction in MTR in SZ as compared with healthy controls [F(36,1)=5.339, p=0.027] and this remained when age and smoking were added as covariates [F(36,1)=5.682, p=0.023] (Table 2).
Table 2.
MTR and DTS data summary.
| Normal Control | Schizophrenia | Statistical Evaluation | Effect Size (Cohen’s d) | |
|---|---|---|---|---|
| MTR | 0.17±0.02 | 0.15±0.03 | F(36,1)=5.339, p=0.027 | 0.78 |
| NAA RD | 0.15±0.04 | 0.17±0.05 | F(41,1)=1.674, p=0.203 | 0.44 |
| NAA AD | 0.33±0.09 | 0.40±0.10 | F(41,1)=4.189, p=0.047* | 0.74 |
| NAA ADC | 0.21±0.05 | 0.25±0.05 | F(41,1)=6.348, p=0.016* | 0.80 |
| NAA FA | 0.48±0.16 | 0.52±0.16 | F(41,1)=0.696, p=0.409 | 0.25 |
| Water RD | 0.53±0.06 | 0.59±0.10 | F(41,1)=4.865, p=0.033* | 0.73 |
| Water AD | 0.76±0.09 | 0.87±0.14 | F(41,1)=8.417, p=0.006* | 0.93 |
| Water ADC | 0.61±0.05 | 0.68±0.11 | F(41,1)=7.687, p=0.008* | 0.82 |
| Water FA | 0.24±0.11 | 0.25±0.07 | F(41,1)=0.422, p=0.519 | 0.11 |
Statistical analyses are described in the text.
p<0.05
DTS
DTS measurements in a phantom preparation ([NAA] = 12 mM, [Cr] = 8 mM and [Cho] = 3 mM, pH=7.0) demonstrated isotropic diffusion, as expected in a structure-free medium (FA ≤ 0.08 for all three chemicals), and ADCs were in good agreement with published values (0.64±0.08, 0.74±0.06 and 0.92±0.06 for NAA, Cr and Cho, respectively) (44). The spectra obtained during a typical in vivo DTS experiment are shown in Figure 3. Note that we show water-suppressed spectra for simplicity, although we also collected water-unsuppressed spectra for calculation of water diffusion. See Supplementary Materials for discussion of SNR in our DTS data.
Figure 3.

Sample water-suppressed MRS spectra showing the modulation of metabolite signal with diffusion gradients. The top row shows data from a typical healthy control, the bottom row from a schizophrenia patient. In each row, the leftmost spectrum is with no gradients applied, and the next 6 spectra show a variety of x/y/z gradients as shown. Note the variable decrement in metabolite signal with differing gradients, giving rise to the calculation of the diffusion tensor.
NAA ADC was significantly elevated in SZ when compared with controls [F(41,1)=6.348, p=0.016] and this was true when age and smoking are added to the model [F(41,1)=5.500, p=0.023]. This measure was not correlated with MTR (R= −0.242, p=0.156). Water ADC was also elevated in SZ [F(41,1)=7.687, p=0.008] but not correlated with MTR (R= −0.129, p=0.447). For reasons discussed below, we did not consider FA a primary outcome (NAA FA and water FA in SZ were not significantly different from control in this study; see Table 2 for details). In addition, Cho ADC was not significantly different between healthy control and SZ groups (0.20±0.06 and 0.22±0.05, respectively; [F(37,1)=0.227, p=0.637]).
As expected, there were numerous statistically significant correlations (not shown) among the NAA diffusion parameters as well as among the water diffusion parameters (exceptions were NAA RD-AD, NAA FA-ADC, and water FA-ADC). By contrast, there were no correlations between any water and any NAA diffusion parameters, suggesting these measures were at least partially independent although they share some common mechanisms (e.g. intra-axonal water and NAA diffusion).
MTR, DTS, and Demographic/Clinical Variables
MTR correlated negatively with BMI (R= −0.449, p=0.005) and positively with education level (R=0.440, p=0.006) in the full dataset. It also correlated with number of lifetime suicide attempts (Spearman R= −0.553, p=0.014) and number of lifetime hospitalizations (R= −0.620, p=0.005) among patients (Supplementary Figure 1). NAA ADC correlated negatively with NAART score (R= −0.462, p=0.040) and education level (R= −0.393, p=0.010). By contrast, water ADC was not correlated with NAART score (R=0.309, p=0.173) or education level (R= −0.141, p=0.367). Because the two groups were not matched for BMI and education we also ran the MTR/BMI (R= −0.591, p=0.008), MTR/education (R= −0.118, p=0.592), and NAA ADC/education (R= −0.544, p=0.011) correlations within the SZ group only. No other correlation analysis was statistically significant, despite the liberal approach of not correcting for multiple comparisons.
DISCUSSION
We applied a combined MTR-DTS approach to probe microstructural WM abnormalities in chronically ill SZ patients. We implemented several data quality measures: a test-retest study in healthy controls, phantom calibration of each human acquisition, frequency/phase/eddy current correction of individual diffusion spectra, and SNR calculation for individual spectra. We found that MTR was reduced and NAA ADC was elevated in SZ, suggesting that WM pathology in SZ is driven by both myelination deficits and axon abnormalities.
Several additional features of the DTS data lend face validity to our findings. For example, the water FA and ADC and the NAA FA and ADC values for healthy controls are similar to those observed in other DTI and DTS studies (e.g. (27, 47)). NAA is a larger molecule, diffuses more slowly than water, and is predicted to have a lower AD; this is exactly what we observe. In addition, since NAA is intracellular, it is predicted to have more anisotropic diffusion than water, and we find that NAA FA is higher than water FA in healthy controls. However, note that FA is sensitive to noise and the NAA resonance has lower signal-to-noise than that of water. Finally, our finding of reduced MTR is consistent with the elevated water RD in SZ since the latter is proposed as an indicator of myelin reduction.
The clinical significance of these findings was highlighted by the fact that low MTR was associated with worse educational attainment, markers of a more severe phenotype (lifetime hospitalizations and suicide attempts), and higher BMI; while higher NAA ADC was associated with lower NAART scores and educational attainment. Thus, for each measure, the direction of change in patients compared to controls (reduced MTR, elevated NAA ADC) was also associated with more adverse outcomes within the patient group. In addition, we did not see similar correlations with water ADC, suggesting that there is additional value in measuring NAA ADC. This suggests the WM abnormalities we observed in schizophrenia may be related to factors that determine functional outcomes in this condition. Although we cannot currently propose a mechanism for these effects, future studies can examine the relationship between specific cognitive functions or clinical symptoms and MTR/DTS in specific WM tracts.
Our findings suggest that both myelination (measured by MTR) and axonal abnormalities (measured by DTS) play a role in WM abnormalities in SZ. One interpretation consistent with our hypotheses is that myelin is reduced in SZ accompanied by an increase in intra-axonal space available for diffusion (increase in axonal diameter or reduced hindrance within axons). The axon-selectivity of the NAA ADC findings is further supported by the absence of similar changes in Cho ADC. The myelin and axon changes would act in concert to lead to abnormal signal transduction between brain regions in SZ. In addition, they would each reduce the anisotropy of water molecule diffusion, leading to well-documented DTI abnormalities. Consistent with this assumption, we also observe changes in water diffusion along with those in MTR and NAA ADC. The simultaneous elevation of NAA and water ADC in SZ is distinct from stroke where both measures are reduced (30). On the other hand, it is noteworthy that the MTR and DTS measures did not correlate with each other. This suggests the possibility of independent mechanisms leading to myelin and axon abnormalities. Future longitudinal studies in early stages of schizophrenia may be instructive in how these mechanisms evolve.
This interpretation suggests abnormalities in the g-ratio in schizophrenia. We cannot calculate a g-ratio from the current dataset since MTR and DTS data have different units. Therefore, we calculated NAA ADC/MTR as a simpler index. This ratio is 1.35±0.27 for controls and 1.66±0.39 for patients (mean±SD), a 24% between-group difference (p = 0.007). Although not a primary outcome of this study, we note that this difference is substantial and highly significant.
Although abnormalities in axonal geometry are one possible explanation for our DTS data, others are possible. For example, molecular diffusion properties can be affected by membrane permeability during anesthesia (48) and there may be membrane permeability abnormalities in SZ. In addition, abnormalities in the proportion of NAA localized in mitochondria, or in NAA cleavage in extracellular space as part of myelin synthesis (49) may also impact NAA ADC. Since mitochondrial abnormalities are reported in schizophrenia (50), abnormal NAA distribution in mitochondria is an attractive alternative hypothesis to be pursued.
The relationship between NAA diffusion and transverse T2 relaxation is intriguing because each measure reflects a related but distinct aspect of NAA’s microenvironment. While T2 relaxation is determined by spin-spin interactions between the index molecule and its immediate neighbors, diffusion reflects the distance traveled by a molecule in unit time. We recently reported, in a dataset partially overlapping with the current one, that NAA T2 relaxation time is shortened in SZ while that of water is prolonged (51). This contrasts with the current findings of elevated NAA and water ADC in SZ. This pattern suggests that WM microenvironment changes in SZ may be more complex than only axonal geometry changes and involve both greater NAA diffusion and more frequent interaction with other molecules. In addition, there is no significant correlation between NAA ADC and NAA T2 in our data (R=−0.214; p=0.218) suggesting these measures reflect independent processes. Deeper insight into this issue would come from analysis of NAA T2 relaxation for multi-exponential decay. Multiple-component T2 relaxation may offer a clue that NAA signal arises from molecules in different environments. Here, we calculated T2 times based on 4 echo times, not enough to explore multi-exponential decay. Future studies with more detailed T2 relaxation data are needed.
Although DTS capitalizes on NAA diffusion in the same manner DTI does on water diffusion, brain NAA concentration is 5000-fold lower than brain water concentration (approximately 10mM and 50M, respectively). Thus, while DTI can achieve whole-brain coverage with milimetric voxels in minutes, we collect data from a single large voxel over many repetitions to obtain reliable DTS data. The large DTS voxel can be associated with macroscopic curvature effects: as axons course through the voxel they may curve and the DTS signal averaged over a large volume partly reflects curvature as opposed to diffusion. To address this confound, the results of a DTS study can be examined for macroscopic curvature effects. If macroscopic curvature effects are operative, RD and AD should covary (e.g., curved fibers would yield high RD and low AD, while straight fibers would yield low RD and high AD). If RD and AD vary independently of one another (as is the case with NAA), this suggests the findings are not secondary to macroscopic curvature. In addition, macroscopic curvature affects water and NAA parameters equally while biologically-specific changes cause independent variation in these parameters. The absence of covariation between NAA and water parameters in our study is reassuring in this regard. Nonetheless, we focused on ADC as the DTS parameter least affected by macroscopic curvature. This is because ADC has no directionality while all other DTS measures do.
In addition to these conceptual caveats, our study has several limitations. First is the potential for variable voxel placement, which could result in the inclusion of axons of different diameters in different brains, impacting the ADC measures. Our voxel is anchored by anatomical landmarks which improve reliability as demonstrated by our test-retest study. Collecting data from the entire brain is currently possible for MTR but not for DTS. Chemical shift imaging can collect high quality MRS data from the entire brain (52, 53) but these are challenging to implement with diffusion gradients. Second, the NAA signal we measure contains contributions from NAA and N-acetylaspartylglutamate (NAAG). NAAG is located both intra- and extracellularly (54) and our DTS measures may be confounded by this contamination. NAAG is similar to NAA in chemical structure so the two MRS signals are challenging to resolve. NAAG concentration in the PFC white matter is 1.5mM in healthy individuals (of which an unknown fraction is extracellular) (55) whereas NAA concentrations are usually calculated at 10mM (56). Therefore, we do not expect NAAG contribution to be a major factor in our results. Third, MTR is not a specific measure of myelin content. MTR abnormalities can arise from acute inflammation, edema, and other processes that impact brain water content (57). This limits the utility of MTR in pathologies where gross brain water abnormalities are seen. There is no evidence for such abnormalities in SZ and past applications of MTR in SZ have revealed subtle changes (20, 22). Others have used a “myelin water fraction” approach which takes advantage of the differential T2 relaxation properties of water molecules trapped within myelin (58) but this approach is technically challenging. Fourth, the SZ patients in this study were chronically ill and taking medications. DTI abnormalities are widely reported in chronically ill patients, in fact more consistently than in first-episode patients with SZ (59) or those with other psychiatric diagnoses (60, 61). In addition, we are not aware of any literature on psychotropic medications causing alterations in WM microstructure; there was no relationship between CPZ equivalents and MTR or NAA ADC in our study. Nonetheless, we cannot rule out medication effects; this needs to be addressed in future studies. Finally, we did not correct for cardiac gating effects which can impact the MRS signal. Since our MRS sequence involved interleaved acquisition, such effects were unlikely to impact the findings.
In conclusion, we used a novel MRI/MRS approach to probe WM abnormalities in SZ and provided in vivo evidence for both abnormal axon geometry and myelination. Our findings suggest that signal transduction speeds are abnormal in SZ, possibly leading to information processing abnormalities and cognitive deficits. Future studies will focus on early stages of illness and on abnormalities in specific WM pathways with specific cognitive or clinical presentations.
Supplementary Material
Acknowledgments
We are grateful to the participants for volunteering for research.
Funding: R01MH094594(DO); R21MH092704 (FD); Shervert Frazier Research Institute at McLean Hospital to BMC
Footnotes
Conflict of interest
The authors report no biomedical financial interests or potential conflicts of interest.
Publisher's Disclaimer: This is a PDF file of an unedited manuscript that has been accepted for publication. As a service to our customers we are providing this early version of the manuscript. The manuscript will undergo copyediting, typesetting, and review of the resulting proof before it is published in its final citable form. Please note that during the production process errors may be discovered which could affect the content, and all legal disclaimers that apply to the journal pertain.
References
- 1.Sim K, Yang GL, Loh D, Poon LY, Sitoh YY, Verma S, et al. White matter abnormalities and neurocognitive deficits associated with the passivity phenomenon in schizophrenia: a diffusion tensor imaging study. Psychiatry Res. 2009;172:121–127. doi: 10.1016/j.pscychresns.2009.02.003. [DOI] [PubMed] [Google Scholar]
- 2.Shergill SS, Kanaan RA, Chitnis XA, O’Daly O, Jones DK, Frangou S, et al. A diffusion tensor imaging study of fasciculi in schizophrenia. Am J Psychiatry. 2007;164:467–473. doi: 10.1176/ajp.2007.164.3.467. [DOI] [PubMed] [Google Scholar]
- 3.Karlsgodt KH, van Erp TG, Poldrack RA, Bearden CE, Nuechterlein KH, Cannon TD. Diffusion tensor imaging of the superior longitudinal fasciculus and working memory in recent-onset schizophrenia. Biol Psychiatry. 2008;63:512–518. doi: 10.1016/j.biopsych.2007.06.017. [DOI] [PubMed] [Google Scholar]
- 4.Kubicki M, Westin CF, Nestor PG, Wible CG, Frumin M, Maier SE, et al. Cingulate fasciculus integrity disruption in schizophrenia: a magnetic resonance diffusion tensor imaging study. Biol Psychiatry. 2003;54:1171–1180. doi: 10.1016/s0006-3223(03)00419-0. [DOI] [PMC free article] [PubMed] [Google Scholar]
- 5.Rusch N, Spoletini I, Wilke M, Bria P, Di Paola M, Di Iulio F, et al. Prefrontal-thalamic-cerebellar gray matter networks and executive functioning in schizophrenia. Schizophr Res. 2007;93:79–89. doi: 10.1016/j.schres.2007.01.029. [DOI] [PubMed] [Google Scholar]
- 6.Takei K, Yamasue H, Abe O, Yamada H, Inoue H, Suga M, et al. Structural disruption of the dorsal cingulum bundle is associated with impaired Stroop performance in patients with schizophrenia. Schizophr Res. 2009;114:119–127. doi: 10.1016/j.schres.2009.05.012. [DOI] [PubMed] [Google Scholar]
- 7.Nestor PG, Kubicki M, Gurrera RJ, Niznikiewicz M, Frumin M, McCarley RW, et al. Neuropsychological correlates of diffusion tensor imaging in schizophrenia. Neuropsychology. 2004;18:629–637. doi: 10.1037/0894-4105.18.4.629. [DOI] [PMC free article] [PubMed] [Google Scholar]
- 8.Nestor PG, Kubicki M, Niznikiewicz M, Gurrera RJ, McCarley RW, Shenton ME. Neuropsychological disturbance in schizophrenia: a diffusion tensor imaging study. Neuropsychology. 2008;22:246–254. doi: 10.1037/0894-4105.22.2.246. [DOI] [PMC free article] [PubMed] [Google Scholar]
- 9.Spoletini I, Cherubini A, Di Paola M, Banfi G, Rusch N, Martinotti G, et al. Reduced fronto-temporal connectivity is associated with frontal gray matter density reduction and neuropsychological deficit in schizophrenia. Schizophr Res. 2009;108:57–68. doi: 10.1016/j.schres.2008.11.011. [DOI] [PubMed] [Google Scholar]
- 10.Schlosser RG, Nenadic I, Wagner G, Gullmar D, von Consbruch K, Kohler S, et al. White matter abnormalities and brain activation in schizophrenia: a combined DTI and fMRI study. Schizophr Res. 2007;89:1–11. doi: 10.1016/j.schres.2006.09.007. [DOI] [PubMed] [Google Scholar]
- 11.Williamson P. Are anticorrelated networks in the brain relevant to schizophrenia? Schizophr Bull. 2007;33:994–1003. doi: 10.1093/schbul/sbm043. [DOI] [PMC free article] [PubMed] [Google Scholar]
- 12.Garrity AG, Pearlson GD, McKiernan K, Lloyd D, Kiehl KA, Calhoun VD. Aberrant “default mode” functional connectivity in schizophrenia. Am J Psychiatry. 2007;164:450–457. doi: 10.1176/ajp.2007.164.3.450. [DOI] [PubMed] [Google Scholar]
- 13.Whitfield-Gabrieli S, Thermenos HW, Milanovic S, Tsuang MT, Faraone SV, McCarley RW, et al. Hyperactivity and hyperconnectivity of the default network in schizophrenia and in first-degree relatives of persons with schizophrenia. Proc Natl Acad Sci U S A. 2009;106:1279–1284. doi: 10.1073/pnas.0809141106. [DOI] [PMC free article] [PubMed] [Google Scholar]
- 14.Tkachev D, Mimmack ML, Ryan MM, Wayland M, Freeman T, Jones PB, et al. Oligodendrocyte dysfunction in schizophrenia and bipolar disorder. Lancet. 2003;362:798–805. doi: 10.1016/S0140-6736(03)14289-4. [DOI] [PubMed] [Google Scholar]
- 15.Stephan KE, Friston KJ, Frith CD. Dysconnection in schizophrenia: from abnormal synaptic plasticity to failures of self-monitoring. Schizophr Bull. 2009;35:509–527. doi: 10.1093/schbul/sbn176. [DOI] [PMC free article] [PubMed] [Google Scholar]
- 16.Paus T, Keshavan M, Giedd JN. Why do many psychiatric disorders emerge during adolescence? Nat Rev Neurosci. 2008;9:947–957. doi: 10.1038/nrn2513. [DOI] [PMC free article] [PubMed] [Google Scholar]
- 17.Kubicki M, McCarley R, Westin CF, Park HJ, Maier S, Kikinis R, et al. A review of diffusion tensor imaging studies in schizophrenia. J Psychiatr Res. 2007;41:15–30. doi: 10.1016/j.jpsychires.2005.05.005. [DOI] [PMC free article] [PubMed] [Google Scholar]
- 18.Whitford TJ, Ford JM, Mathalon DH, Kubicki M, Shenton ME. Schizophrenia, Myelination, and Delayed Corollary Discharges: A Hypothesis. Schizophr Bull. doi: 10.1093/schbul/sbq105. [DOI] [PMC free article] [PubMed] [Google Scholar]
- 19.Alexander AL, Lee JE, Lazar M, Field AS. Diffusion tensor imaging of the brain. Neurotherapeutics. 2007;4:316–329. doi: 10.1016/j.nurt.2007.05.011. [DOI] [PMC free article] [PubMed] [Google Scholar]
- 20.Kubicki M, Park H, Westin CF, Nestor PG, Mulkern RV, Maier SE, et al. DTI and MTR abnormalities in schizophrenia: analysis of white matter integrity. Neuroimage. 2005;26:1109–1118. doi: 10.1016/j.neuroimage.2005.03.026. [DOI] [PMC free article] [PubMed] [Google Scholar]
- 21.Price G, Cercignani M, Chu EM, Barnes TR, Barker GJ, Joyce EM, et al. Brain pathology in first-episode psychosis: magnetization transfer imaging provides additional information to MRI measurements of volume loss. Neuroimage. 2010;49:185–192. doi: 10.1016/j.neuroimage.2009.07.037. [DOI] [PMC free article] [PubMed] [Google Scholar]
- 22.Mandl RC, Schnack HG, Luigjes J, van den Heuvel MP, Cahn W, Kahn RS, et al. Tract-based Analysis of Magnetization Transfer Ratio and Diffusion Tensor Imaging of the Frontal and Frontotemporal Connections in Schizophrenia. Schizophr Bull. 2008 doi: 10.1093/schbul/sbn161. [DOI] [PMC free article] [PubMed] [Google Scholar]
- 23.Tsai G, Coyle JT. N-acetylaspartate in neuropsychiatric disorders. Prog Neurobiol. 1995;46:531–540. doi: 10.1016/0301-0082(95)00014-m. [DOI] [PubMed] [Google Scholar]
- 24.Lim KO, Adalsteinsson E, Spielman D, Sullivan EV, Rosenbloom MJ, Pfefferbaum A. Proton magnetic resonance spectroscopic imaging of cortical gray and white matter in schizophrenia. Arch Gen Psychiatry. 1998;55:346–352. doi: 10.1001/archpsyc.55.4.346. [DOI] [PubMed] [Google Scholar]
- 25.Ongur D, Prescot AP, Jensen JE, Rouse ED, Cohen BM, Renshaw PF, et al. T2 relaxation time abnormalities in bipolar disorder and schizophrenia. Magn Reson Med. 2010;63:1–8. doi: 10.1002/mrm.22148. [DOI] [PubMed] [Google Scholar]
- 26.Ackerman JJ, Neil JJ. The use of MR-detectable reporter molecules and ions to evaluate diffusion in normal and ischemic brain. NMR Biomed. 23:725–733. doi: 10.1002/nbm.1530. [DOI] [PMC free article] [PubMed] [Google Scholar]
- 27.Upadhyay J, Hallock K, Ducros M, Kim DS, Ronen I. Diffusion tensor spectroscopy and imaging of the arcuate fasciculus. Neuroimage. 2008;39:1–9. doi: 10.1016/j.neuroimage.2007.08.046. [DOI] [PMC free article] [PubMed] [Google Scholar]
- 28.Harada M, Uno M, Hong F, Hisaoka S, Nishitani H, Matsuda T. Diffusion-weighted in vivo localized proton MR spectroscopy of human cerebral ischemia and tumor. NMR Biomed. 2002;15:69–74. doi: 10.1002/nbm.759. [DOI] [PubMed] [Google Scholar]
- 29.Abe O, Okubo T, Hayashi N, Saito N, Iriguchi N, Shirouzu I, et al. Temporal changes of the apparent diffusion coefficients of water and metabolites in rats with hemispheric infarction: experimental study of transhemispheric diaschisis in the contralateral hemisphere at 7 tesla. J Cereb Blood Flow Metab. 2000;20:726–735. doi: 10.1097/00004647-200004000-00010. [DOI] [PubMed] [Google Scholar]
- 30.Dreher W, Busch E, Leibfritz D. Changes in apparent diffusion coefficients of metabolites in rat brain after middle cerebral artery occlusion measured by proton magnetic resonance spectroscopy. Magn Reson Med. 2001;45:383–389. doi: 10.1002/1522-2594(200103)45:3<383::aid-mrm1050>3.0.co;2-g. [DOI] [PubMed] [Google Scholar]
- 31.Liu Z, Liu X, Hui L, Zhao D, Wang X, Xie S, et al. The appearance of ADCs in the non-affected areas of the patients with MELAS. Neuroradiology. 2011;53:227–232. doi: 10.1007/s00234-010-0729-y. [DOI] [PubMed] [Google Scholar]
- 32.Chomiak T, Hu B. What is the optimal value of the g-ratio for myelinated fibers in the rat CNS? A theoretical approach. PLoS One. 2009;4:e7754. doi: 10.1371/journal.pone.0007754. [DOI] [PMC free article] [PubMed] [Google Scholar]
- 33.Kandel ER, Schwartz JH, Jessell TM. Principles of Neural Science. 3. New York, NY: Elsevier; 1991. [Google Scholar]
- 34.Paus T, Toro R. Could Sex Differences in White Matter be Explained by g ratio? Front Neuroanat. 2009;3:14. doi: 10.3389/neuro.05.014.2009. [DOI] [PMC free article] [PubMed] [Google Scholar]
- 35.Nave KA. Myelination and the trophic support of long axons. Nat Rev Neurosci. 2010;11:275–283. doi: 10.1038/nrn2797. [DOI] [PubMed] [Google Scholar]
- 36.Uranova NA, Vostrikov VM, Vikhreva OV, Zimina IS, Kolomeets NS, Orlovskaya DD. The role of oligodendrocyte pathology in schizophrenia. Int J Neuropsychopharmacol. 2007;10:537–545. doi: 10.1017/S1461145707007626. [DOI] [PubMed] [Google Scholar]
- 37.Flynn SW, Lang DJ, Mackay AL, Goghari V, Vavasour IM, Whittall KP, et al. Abnormalities of myelination in schizophrenia detected in vivo with MRI, and post-mortem with analysis of oligodendrocyte proteins. Mol Psychiatry. 2003;8:811–820. doi: 10.1038/sj.mp.4001337. [DOI] [PubMed] [Google Scholar]
- 38.McCullumsmith RE, Gupta D, Beneyto M, Kreger E, Haroutunian V, Davis KL, et al. Expression of transcripts for myelination-related genes in the anterior cingulate cortex in schizophrenia. Schizophr Res. 2007;90:15–27. doi: 10.1016/j.schres.2006.11.017. [DOI] [PMC free article] [PubMed] [Google Scholar]
- 39.Hakak Y, Walker JR, Li C, Wong WH, Davis KL, Buxbaum JD, et al. Genome-wide expression analysis reveals dysregulation of myelination-related genes in chronic schizophrenia. Proceedings of the National Academy of Sciences of the United States of America. 2001;98:4746–4751. doi: 10.1073/pnas.081071198. [DOI] [PMC free article] [PubMed] [Google Scholar]
- 40.Budel S, Padukkavidana T, Liu BP, Feng Z, Hu F, Johnson S, et al. Genetic variants of Nogo-66 receptor with possible association to schizophrenia block myelin inhibition of axon growth. J Neurosci. 2008;28:13161–13172. doi: 10.1523/JNEUROSCI.3828-08.2008. [DOI] [PMC free article] [PubMed] [Google Scholar]
- 41.Bernstein HG, Steiner J, Bogerts B. Glial cells in schizophrenia: pathophysiological significance and possible consequences for therapy. Expert Rev Neurother. 2009;9:1059–1071. doi: 10.1586/ern.09.59. [DOI] [PubMed] [Google Scholar]
- 42.de Graaf RA, Luo Y, Garwood M, Nicolay K. B1-insensitive, single-shot localization and water suppression. J Magn Reson B. 1996;113:35–45. doi: 10.1006/jmrb.1996.0152. [DOI] [PubMed] [Google Scholar]
- 43.Chen W, Luo Y, Merkle H, Zhu X-H, Adriany G, Garwood M, et al. Low-Power, B1-Insensitive, Frequency-Selective Saturation Pulse for use of Water Suppression and Saturation Transfer in NMR. SMR, 3rd Annual Meeting; Nice, France. 1995. p. 1016. [Google Scholar]
- 44.Kan HE, Techawiboonwong A, van Osch MJ, Versluis MJ, Deelchand DK, Henry PG, et al. Differences in apparent diffusion coefficients of brain metabolites between grey and white matter in the human brain measured at 7 T. Magn Reson Med. 2012;67:1203–1209. doi: 10.1002/mrm.23129. [DOI] [PubMed] [Google Scholar]
- 45.Tkac I, Starcuk Z, Choi IY, Gruetter R. In vivo 1H NMR spectroscopy of rat brain at 1 ms echo time. Magn Reson Med. 1999;41:649–656. doi: 10.1002/(sici)1522-2594(199904)41:4<649::aid-mrm2>3.0.co;2-g. [DOI] [PubMed] [Google Scholar]
- 46.Choi JK, Dedeoglu A, Jenkins BG. Application of MRS to mouse models of neurodegenerative illness. NMR Biomed. 2007;20:216–237. doi: 10.1002/nbm.1145. [DOI] [PubMed] [Google Scholar]
- 47.Camchong J, Lim KO, Sponheim SR, Macdonald AW. Frontal white matter integrity as an endophenotype for schizophrenia: diffusion tensor imaging in monozygotic twins and patients’ nonpsychotic relatives. Front Hum Neurosci. 2009;3:35. doi: 10.3389/neuro.09.035.2009. [DOI] [PMC free article] [PubMed] [Google Scholar]
- 48.Valette J, Guillermier M, Besret L, Hantraye P, Bloch G, Lebon V. Isoflurane strongly affects the diffusion of intracellular metabolites, as shown by 1H nuclear magnetic resonance spectroscopy of the monkey brain. J Cereb Blood Flow Metab. 2007;27:588–596. doi: 10.1038/sj.jcbfm.9600353. [DOI] [PubMed] [Google Scholar]
- 49.Chakraborty G, Mekala P, Yahya D, Wu G, Ledeen RW. Intraneuronal N-acetylaspartate supplies acetyl groups for myelin lipid synthesis: evidence for myelin-associated aspartoacylase. J Neurochem. 2001;78:736–745. doi: 10.1046/j.1471-4159.2001.00456.x. [DOI] [PubMed] [Google Scholar]
- 50.Ben-Shachar D, Laifenfeld D. Mitochondria, synaptic plasticity, and schizophrenia. Int Rev Neurobiol. 2004;59:273–296. doi: 10.1016/S0074-7742(04)59011-6. [DOI] [PubMed] [Google Scholar]
- 51.Du F, Cooper A, Cohen BM, Renshaw PF, Ongur D. Water and metabolite transverse T2 relaxation time abnormalities in the white matter in schizophrenia. Schizophr Res. 2012 doi: 10.1016/j.schres.2012.01.026. [DOI] [PMC free article] [PubMed] [Google Scholar]
- 52.Maudsley AA, Domenig C, Govind V, Darkazanli A, Studholme C, Arheart K, et al. Mapping of brain metabolite distributions by volumetric proton MR spectroscopic imaging (MRSI) Magn Reson Med. 2009;61:548–559. doi: 10.1002/mrm.21875. [DOI] [PMC free article] [PubMed] [Google Scholar]
- 53.Posse S, Otazo R, Caprihan A, Bustillo J, Chen H, Henry PG, et al. Proton echo-planar spectroscopic imaging of J-coupled resonances in human brain at 3 and 4 Tesla. Magn Reson Med. 2007;58:236–244. doi: 10.1002/mrm.21287. [DOI] [PubMed] [Google Scholar]
- 54.Coyle JT. The nagging question of the function of N-acetylaspartylglutamate. Neurobiol Dis. 1997;4:231–238. doi: 10.1006/nbdi.1997.0153. [DOI] [PubMed] [Google Scholar]
- 55.Pouwels PJ, Frahm J. Differential distribution of NAA and NAAG in human brain as determined by quantitative localized proton MRS. NMR Biomed. 1997;10:73–78. doi: 10.1002/(sici)1099-1492(199704)10:2<73::aid-nbm448>3.0.co;2-4. [DOI] [PubMed] [Google Scholar]
- 56.Govindaraju V, Young K, Maudsley AA. Proton NMR chemical shifts and coupling constants for brain metabolites. NMR in Biomedicine. 2000;13:129–153. doi: 10.1002/1099-1492(200005)13:3<129::aid-nbm619>3.0.co;2-v. [DOI] [PubMed] [Google Scholar]
- 57.Laule C, Vavasour IM, Kolind SH, Li DK, Traboulsee TL, Moore GR, et al. Magnetic resonance imaging of myelin. Neurotherapeutics. 2007;4:460–484. doi: 10.1016/j.nurt.2007.05.004. [DOI] [PMC free article] [PubMed] [Google Scholar]
- 58.MacKay A, Laule C, Vavasour I, Bjarnason T, Kolind S, Madler B. Insights into brain microstructure from the T2 distribution. Magn Reson Imaging. 2006;24:515–525. doi: 10.1016/j.mri.2005.12.037. [DOI] [PubMed] [Google Scholar]
- 59.Friedman JI, Tang C, Carpenter D, Buchsbaum M, Schmeidler J, Flanagan L, et al. Diffusion tensor imaging findings in first-episode and chronic schizophrenia patients. Am J Psychiatry. 2008;165:1024–1032. doi: 10.1176/appi.ajp.2008.07101640. [DOI] [PubMed] [Google Scholar]
- 60.Heng S, Song AW, Sim K. White matter abnormalities in bipolar disorder: insights from diffusion tensor imaging studies. J Neural Transm. 117:639–654. doi: 10.1007/s00702-010-0368-9. [DOI] [PubMed] [Google Scholar]
- 61.White T, Nelson M, Lim KO. Diffusion tensor imaging in psychiatric disorders. Top Magn Reson Imaging. 2008;19:97–109. doi: 10.1097/RMR.0b013e3181809f1e. [DOI] [PubMed] [Google Scholar]
Associated Data
This section collects any data citations, data availability statements, or supplementary materials included in this article.