

Abstract
Although autism is usually characterized with respect to sociocommunicative impairments, visual search is known as a domain of relative performance strength in this disorder. This study used functional MRI during visual search in children with autism spectrum disorder (n = 19; mean age = 13;10) and matched typically developing children (n = 19; mean age = 14;0). We selected regions of interest within two attentional networks known to play a crucial role in visual search processes, such as goal‐directed selective attention, filtering of irrelevant distractors, and detection of behaviorally‐relevant information, and examined activation and connectivity within and between these attentional networks. Additionally, based on prior research suggesting links between visual search abilities and autism symptomatology, we tested for correlations between sociocommunicative impairments and behavioral and neural indices of search. Contrary to many previous functional connectivity magnetic resonance imaging studies of autism that reported functional underconnectivity for task domains of weakness, we found atypically increased connectivity within and between attentional networks in autism. Additionally, we found increased functional connectivity for occipital regions, both locally and for long‐distance connections with frontal regions. Both behavioral and neural indices of search were correlated with sociocommunicative impairment in children with autism. This association suggests that strengths in nonsocial visuospatial processing may be related to the development of core autistic sociocommunicative impairments. Hum Brain Mapp 34:2524–2537, 2013. © 2012 Wiley Periodicals, Inc.
Keywords: autism, attention, functional MRI, functional connectivity MRI, symptom severity
INTRODUCTION
Autism spectrum disorder (ASD) has been characterized as a disorder of abnormal neural connectivity, rather than of region‐specific neural dysfunction [Belmonte et al., 2004; Rippon et al., 2007]. This theoretical shift is in line with the underconnectivity theory of ASD put forth by Just et al. 2004. This theory was partially based on evidence from functional connectivity MRI (fcMRI), which is a complementary approach to traditional fMRI activation analyses and detects interregional correlations of the blood oxygenation level dependent (BOLD) signal.
In the fcMRI literature on ASD, two methodological approaches can be grossly distinguished: activation fcMRI, which primarily detects task‐related BOLD signal fluctuations, and intrinsic fcMRI, which isolates spontaneous signal fluctuations below 0.1 Hz [Van Dijk et al., 2009]. Intrinsic low‐frequency fluctuations may be more closely linked to anatomical connectivity [Greicius et al., 2009; van den Heuvel et al., 1994], whereas activation fcMRI may reveal more task‐dependent network connectivity [e.g., Hampson et al., 2004; Jones et al., 2010] and is related to variations in behavioral performance and attentional focus [Prado and Weissman, 2011; Prado et al., 2011]. While both approaches provide important information about interregional signal correlations, evidence of underconnectivity in ASD may depend on which methodological approach is chosen [Müller et al., 2011].
One potential limitation of previous activation fcMRI studies in ASD (including the majority of studies that reported underconnectivity findings) has been the use of tasks associated with deficits in ASD [Thai et al., 2009]. These studies have employed experimental paradigms examining domains of impairment in ASD, including theory of mind [Kana et al., 2009; Mason et al., 2008], executive function [Agam et al., 2010; Just et al., 2007; Kana et al., 2007; Koshino et al., 2005; Lee et al., 2009; Solomon et al., 2007], language comprehension and production [Jones et al., 2010; Just et al., 2004; Kana et al., 2006], and face processing [Kleinhans et al., 2008; Koshino et al., 2008; Welchew et al., 2009]. Reduced BOLD signal correlations that were interpreted as underconnectivity in these studies may therefore reflect differences in perceived task difficulty, attentional focus, or engagement, rather than reduced integrity of underlying neurocognitive networks.
Although many behavioral and clinical reports about islands of sparing and superior functioning in ASD are available [Lincoln et al., 1988; Mottron et al., 2006], only one study to date has examined functional connectivity for a task in which individuals with ASD tend to excel. Damarla et al. 2010 observed reduced functional connectivity between frontal and posterior regions in ASD for an embedded figures test (EFT), commonly associated with superior performance in ASD [Dakin and Frith, 2005]. However, the small number of trials in this study warrants cautious interpretation.
We examined functional connectivity for visual search—a type of task for which superior performance has been reported in ASD [Joseph et al., 2009; Kaldy et al., 2011; O'Riordan and Plaisted, 2001; O'Riordan et al., 2001]. Visual search paradigms require participants to determine the presence or absence of a target located within an array of distractors. Two distributed attentional networks are considered crucial for visual search [Corbetta and Shulman, 2002; Corbetta et al., 2008]: a bilateral dorsal frontal‐parietal network responsible for top‐down, voluntary control of visual attention; and a right‐lateralized ventral frontal‐parietal network associated with bottom‐up modulation of attention and filtering of irrelevant information. We examined activation and connectivity within and between these two attentional networks. Given prior research showing visual search abilities being linked with ASD symptomatology in children with ASD [Joseph et al., 2009] and with autistic traits in typically developing (TD) adults [Brock et al., 2011], we also examined whether sociocommunicative impairments were related to behavioral and neural indices of search.
METHODS
Participants
Twenty‐seven children with ASD and 24 TD children participated. After exclusion of participants with excessive head motion (see below), the final sample included 19 children and adolescents with ASD (all males; two left‐handed) and 19 age‐, IQ‐, gender‐, handedness‐, and motion‐matched TD children and adolescents (Table 1). This sample included some of the participants from a previous publication [Keehn et al., 2008]. Clinical diagnoses were confirmed using the Autism Diagnostic Interview—Revised [ADI‐R; Rutter et al., 2003], the Autism Diagnostic Observation Schedule [ADOS; Lord et al., 1999], and expert clinical judgment according to DSM‐IV criteria. Information on psychotropic medication use was available for 14 of 19 children with ASD; of these 14 individuals, five reported use of selective serotonin re‐uptake inhibitors and one reported use of stimulant medication. Children with autism‐related medical conditions (e.g., Fragile‐X syndrome, tuberous sclerosis) were excluded. Participants in the TD group had no reported personal or family history of autism and were confirmed via parent report to be free of autism‐related symptoms or any other neurological or psychiatric conditions and were not taking any psychotropic medications. Informed assent and consent was obtained from all participants and their caregivers in accordance with the University of California, San Diego and San Diego State University Institutional Review Boards.
Table 1.
Participant characteristics
| ASD (n = 19) M (SD) range | TD (n = 19) M (SD) range | t‐value | P | ||
|---|---|---|---|---|---|
| Age (years; months) | 13;10 (2;9) | 14;0 (2;5) | −0.17 | 0.86 | |
| 8;10–18;4 | 9;3–18;6 | ||||
| Verbal IQ | 110.3 (14.0) | 110.0 (14.0) | 0.08 | 0.94 | |
| 88–147 | 74–133 | ||||
| Nonverbal IQ | 113.0 (10.2) | 112.2 (12.3) | 0.20 | 0.84 | |
| 93–131 | 85–129 | ||||
| Full‐scale IQ | 112.9 (11.8) | 113.0 (14.0) | –0.01 | 0.99 | |
| 96–141 | 77–140 | ||||
| Total motion | 0.24 (0.20) | 0.19 (0.14) | 0.88 | 0.38 | |
| 0.02–0.73 | 0.03–0.63 | ||||
| Percentage censored | 0.05 (.07) | 0.04 (0.06) | 0.49 | 0.63 | |
| 0–0.22 | 0–0.22 | ||||
| ADOS algorithm scores | |||||
| Communication | 3.1 (1.8) | n/a | |||
| 0–6 | |||||
| Social interaction | 7.8 (2.4) | n/a | |||
| 4–13 | |||||
| Repetitive behavior | 2.0 (1.4) | n/a | |||
| 0–5 | |||||
IQ determined using the Wechsler abbreviated scale of intelligence (WASI; Wechsler, 1999).
Task Procedure
The experiment was presented with a Pentium III 1.7 GHz/512 MB laptop PC using Presentation software (http://www.neurobs.com). Stimuli were projected onto a screen placed at participants' feet and were viewed using a mirror attached to the head coil. The experimental paradigm was identical to the one described in Keehn et al. 2008. The target was an upright “T” and distractors were Ts rotated 90, 180, and 270°. In the homogeneous condition, all distractors in a trial were presented in one identical orientation, while in the heterogeneous condition distractors in all three orientations were mixed. The target appeared within the search array for 50% of the trials (target present); in the remaining trials, only distractors were presented (target absent). Additional baseline trials consisted of a solitary target (target present baseline) or distractor (target absent baseline), displayed in the center of the screen. Twenty trials of each condition (12 searches, 2 baseline) were presented for a total of 280 trials.
The task was to indicate via an MRI compatible button box whether the target was present or absent. A trial began with a fixation cross (“+”) presented alone for 300 ms. Next, with the fixation cross removed, the search array appeared and remained on the screen for 2,200 ms. Null trials used for temporal jittering consisted of a fixation cross presented alone for 2,500 ms.
The experiment consisted of four runs, each with 70 search/baseline trials and 58 null trials. Within each run, trial types were presented in an optimized pseudorandom sequence created using RSFgen (http://afni.nimh.nih.gov). Before the scanning session, a demonstration was given and practice trials were administered with corrective feedback to individuals in both groups. Participants were instructed to respond as quickly as possible without making errors.
MRI Data Acquisition
Imaging data were acquired using a GE 3Tesla HD Signa Excite scanner with an eight‐channel head coil. High‐resolution anatomical images were acquired using a standard FSPGR T1‐weighted sequence (TR: 11.08 ms; TE: 4.3 ms; flip angle: 45°; 256 × 256 matrix; 180 slices; 1 mm3 resolution). Each of the four functional runs consisted of 128 whole‐brain volumes acquired in 39/40 interleaved slices using a single‐shot, gradient‐recalled, echo‐planar pulse sequence (TR: 2,500 ms; TE: 30ms; flip angle: 90°; 64 × 64 matrix; 3.2 mm slice thickness; in‐plane resolution 3.4 mm2). Participants' heads were stabilized with foam padding to reduce motion.
FMRI Preprocessing
Data were analyzed using the Analysis of Functional Neuroimages suite [AFNI; Cox, 1996]. For each participant, the first four volumes of each run were discarded to remove signal equilibration effects. Visual inspection and quality control (3dToutcount, 3dTqual) of each run were completed. The data were then slice‐time corrected and realigned to the middle time point of the first run and coregistered to the anatomical volume using a single transformation matrix (epi_align_anat.py). Data were smoothed with a Gaussian filter to an effective full‐width at half maximum of 6 mm (3dBlurFWHM), scaled to a mean of 100 (3dcalc), and concatenated (3dTcat) to create a single time‐series with 496 volumes.
In order to control for head motion, the first temporal derivative for the six motion parameters (three rotations, three translations) was calculated and the magnitude of displacement (D t) was computed as the root sum of square for each of the 496 time points [see Jones et al., 2010, for detailed discussion of method and translation/rotational significance of D t]. Time points with excessive head motion (D t > 1; roughly equivalent to 1 mm when rotational displacement is small) as well as the immediately preceding and following time points were censored from further activation and connectivity analyses. Additionally, sections of less than 10 consecutive uncensored time points were excluded. Finally, the root mean square of displacement magnitudes across the entire time series was calculated as an estimate of total motion in each participant. Any participant with greater than 25% of their data removed on the basis of the criteria described above was excluded from this study (ASD = 8; TD = 5).
FMRI Activation Analysis
The hemodynamic impulse response function (IRF) for each stimulus type (collapsing across three set sizes) was estimated using a general linear model. Variable‐shape IRFs for each stimulus type were estimated using piecewise linear B‐spline (tent) basis functions [Saad et al., 2003]. Seven tent functions were used to model the response from the onset of each stimulus type and at each of the next six time points (0–15 s post stimulus onset). The six motion parameters corresponding to translation and rotation and a separate regressor that indicated error trials were used as orthogonal regressors. Statistical maps for each stimulus type were computed as the sum of the fit coefficients for three time points occurring within 2.5–7.5 s, corresponding to the peak hemodynamic response. Statistical maps were interpolated to 3 mm3 isotropic voxels and spatially normalized to the structural volume, which had been standardized to the N27 Talairach‐Tournoux template using AFNI auto‐talairach procedures (@auto_tlrc).
One‐ and two‐sample t‐tests (3dttest) were used to assess activation for homogeneous and heterogeneous trials within and between groups. All statistic maps were corrected for multiple comparisons to a cluster corrected threshold of P < 0.05, using Monte Carlo alpha simulation [Forman, 1995].
Functional Connectivity Analysis
We focused on an approach characterized as activation fcMRI above (although intrinsic fcMRI results are also presented in the Supporting Information). Following high‐pass filtering (125 s; 3dFourier), sources of noise (linear trend, six motion parameters) were modeled and removed, using a general linear model, and residuals were used in subsequent functional connectivity analysis. Data were interpolated to 3 mm3 isotropic voxels and spatially normalized to the N27 Talairach‐Tournoux template, as described above. For each participant, the mean time course for each region of interest (ROI) was extracted. The correlation between the average time courses for each ROI pair was calculated and then transformed using Fisher's r to z′ transformation. Additionally, a whole brain analyses was conducted where the mean time series for each ROI was correlated with all other voxels in the brain. Each participant's connectivity map was entered into one‐ and two‐sample t‐tests to examine within‐ and between‐group effects. All statistic maps were corrected for multiple comparisons to a cluster corrected threshold of P < 0.05, using Monte Carlo simulation (AlphaSim).
Twelve spherical ROIs with a 6 mm radius around local maxima and minima of significant activation clusters were derived from an analysis for all search trials and both groups combined. Locations were chosen based on their correspondence to nodes within dorsal and ventral attention networks [Corbetta and Shulman, 2002; Corbetta et al., 2008]. ROIs for the dorsal network included bilateral frontal eye fields (rFEF, lFEF) and intraparietal sulci (rIPS, lIPS). For the ventral network, ROIs included right hemisphere inferior frontal gyrus (rIFG), anterior insula (rINS), temporal‐parietal junction (rTPJ), and middle frontal gyrus (rMFG). Additionally, bilateral extrastriate (rMOG, lMOG) and primary visual cortex (rV1, lV1) were selected in order to examine functional connectivity between attentional networks and visual regions in the occipital lobe (see Fig. 3A; Supporting Information Table SI for ROI coordinates).
Figure 3.
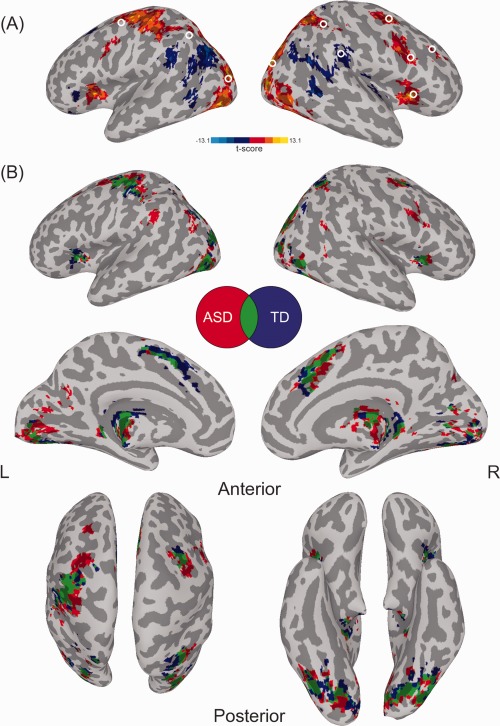
(A) Significant activation clusters for combined group analysis for all search versus null trials. White circles represent ROIs corresponding to dorsal and ventral networks and visual‐occipital regions. Note: ROIs placed in primary visual cortex are not displayed. (B) Significant activation clusters for within‐group comparisons for all search versus fixation trials. Significant activation in red for ASD group, blue for TD group, and green for areas of overlapping activation for both groups.
RESULTS
Behavioral Results
Behavioral data were successfully collected from of 17 of 19 participants with ASD and 18 of 19 TD participants. Mean error rates and median response times (RT) for correct trials were entered into a 2 (group: ASD, TD) × 2 (distractor type: homogenous, heterogeneous) × 2 (target presence: absent, present) × 3 (set size: 6, 12, 24) mixed‐model repeated measures ANOVA. Slopes and y‐intercepts for target absent and present trials of homogenous and heterogeneous conditions were determined from the regression line associated with median RT at each set size. These values were entered into a 2 (group: ASD, TD) × 2 (distractor type: homogenous, heterogeneous) × 2 (target presence: absent, present) mixed‐model repeated measures ANOVA. In a separate set of analyses, age was entered as a covariate (after determining that age met homogeneity of regression assumption); results for main effects of group and interactions between group and other factors remained unchanged unless explicitly stated below.
Error rate
Mean error rates did not significantly differ between groups, F(1, 33) = 1.9, P = 0.2, nor were there any significant interactions between group and any other factor (all P > 0.1). Error rates were greater in heterogeneous compared to homogeneous trials, F(1, 33) = 50.4, P < 0.01, greater in present compared to absent trials, F(1, 33) = 11.2, P < 0.01, and increased with set size, F(2, 66) = 103.5, P < 0.01. Interactions between distractor type and set size and target presence and set size were significant (P < 0.01). Mean error rate for the baseline conditions did not differ significantly between ASD (M = 4%) and TD (M = 4%) groups, F(1, 33) = 0.01, P = 0.8 (Fig. 1).
Figure 1.
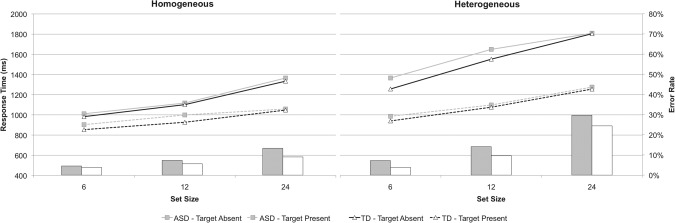
Line graphs correspond to median RT (y‐axis on the left) for homogeneous (left graph) and heterogeneous (right graph) conditions. Bar graphs show error rates (collapsed across absent and present conditions; y‐axis on the right) for ASD (gray bars) and TD (white bars) groups.
Response time
There was no difference in RT between groups, F(1, 33) = 0.6, P = 0.4, nor were there any significant interactions between group and any other factors (all P > 0.1). As expected, RT was longer for heterogeneous compared to homogenous conditions, F(1, 33) = 308.6, P < 0.01, longer for absent compared to present trials, F(1, 33) = 193.5, P < 0.01, and increased with set size, F(2, 66) = 197.6, P < 0.01. Additionally, there were significant interactions between distractor type and target presence and distractor type and set size, and between target presence and set size (all P < 0.01). Baseline RT did not significantly differ between ASD (M = 788 ms) and TD (M = 759 ms) groups, F(1, 33) = 0.6, P = 0.5.
Slopes and intercepts
RT × set size slopes did not differ between groups, F(1, 33) = 1.0, P = 0.3, nor were there any significant interactions between group and any other factor (all P > 0.2). Slopes were larger in heterogeneous compared to homogenous, F(1, 33) = 20.4, P < 0.01, and larger in absent compared to present trials, F(1, 33) = 32.4, P < 0.01 (Fig. 2).
Figure 2.
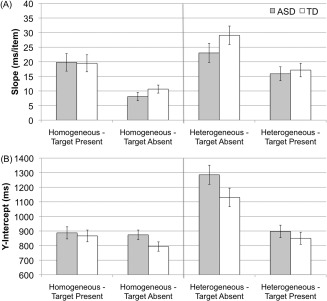
RT by set size slopes (A) and y‐intercepts (B) for homogeneous and heterogeneous target absent and target present conditions. Error bars represent one standard error of the mean.
Y‐intercepts of RT × set size functions did not differ between groups, F(1, 33) = 1.9, P = 0.2. There was a significant group by distractor type by target presence interaction, F(1, 33) = 4.9, P < 0.05; however, this effect was no longer significant after controlling for age. Simple effects revealed that the interaction was due to marginally increased y‐intercepts for the ASD group in homogeneous present and heterogeneous absent conditions (P < 0.1).
ADOS correlations
Correlational analyses between slopes and y‐intercepts of RT × set size functions for homogeneous and heterogeneous target absent and present conditions revealed a significant association between homogeneous target absent slope and ADOS Communication scores, r(16) = −0.57, P < 0.05, and Total, r(16) = −0.62, P < 0.05, in the ASD group (ADOS correlations presented here and below not corrected for multiple comparisons).
FMRI Results
Participant motion
Based on the criteria described above, the mean percentage of data censored from all included participants (ASD = 19; TD = 19) was less than 5%. Percentage of data censored and amount of total motion did not differ between groups (Table 1). The percentage of censored time points and the amount of total motion were not significantly correlated with age or IQ for TD participants or with age, IQ, or ADOS algorithm scores for ASD participants included in the current sample (all P > 0.1).
Activation results
Both groups exhibited activation in regions previously implicated in voluntary control of attention and visual search, including dorsal frontoparietal regions such as bilateral frontal eye fields and intraparietal sulci (Table 2). Both groups also showed activation of bilateral insula and right inferior and middle frontal gyri associated with the ventral attentional network. In addition, deactivation of bilateral TPJ, associated with filtering of irrelevant distractors [Shulman et al., 2011; Wei et al., 1999], was also present in each group. Lastly, both groups also exhibited activation of occipital cortex.
Table 2.
fMRI BOLD activation and deactivation for all search trials for ASD and TD groups
| Group | Peak location | Hemisphere | Talairach coordinates | Volume (voxels) | T‐score | ||
|---|---|---|---|---|---|---|---|
| x | y | z | |||||
| Activation | |||||||
| ASD | Middle occipital gyrus | L | −29 | −80 | 6 | 1372 | 9.7 |
| Postcentral gyrus | L | −44 | −29 | 48 | 359 | 7.2 | |
| Thalamus | L | −23 | −26 | −1 | 185 | 8.9 | |
| Middle cingulate cortex | R | 8 | 8 | 45 | 169 | 8.9 | |
| Thalamus | R | 8 | −26 | −4 | 159 | 8.6 | |
| Precentral gyrus | R | 38 | −11 | 39 | 66 | 6.1 | |
| Thalamus | R | 23 | −29 | 3 | 61 | 8.7 | |
| Insula | R | 32 | 20 | 9 | 61 | 7.0 | |
| Inferior frontal gyrus | R | 47 | 8 | 30 | 55 | 5.1 | |
| Superior parietal lobe | L | −20 | −62 | 42 | 40 | 5.7 | |
| Insula | L | −32 | 17 | 9 | 38 | 6.0 | |
| Putamen | R | 20 | 11 | 12 | 35 | 5.5 | |
| Putamen | L | −23 | −2 | 9 | 22 | 4.8 | |
| Caudate | R | 5 | 2 | 12 | 16 | 5.6 | |
| TD | Middle occipital gyrus | L | −29 | −80 | 9 | 1274 | 9.8 |
| Thalamus | L | −23 | −32 | 12 | 346 | 8.8 | |
| Frontal eye fields | L | −38 | −17 | 51 | 279 | 6.9 | |
| Supplementary motor area | L | −2 | 8 | 48 | 253 | 8.9 | |
| Thalamus | R | 23 | −29 | 3 | 66 | 8.4 | |
| Superior parietal lobe | L | −23 | −56 | 45 | 60 | 6.0 | |
| Insula | L | −29 | 20 | 9 | 59 | 6.5 | |
| Thalamus | R | 14 | −17 | 18 | 59 | 6.7 | |
| Insula | R | 29 | 17 | 9 | 51 | 6.9 | |
| Putamen | L | −29 | −8 | 3 | 29 | 5.2 | |
| Frontal eye fields | R | 26 | −5 | 45 | 25 | 5.1 | |
| Cerebellum | L | −32 | −53 | −22 | 13 | 6.4 | |
| TD > ASD | Putamena | L | −23 | −5 | 15 | 45 | 3.6 |
| Deactivation | |||||||
| ASD | Supramarginal gyrus | L | −59 | −41 | 30 | 65 | −6.8 |
| Inferior parietal lobe | L | −35 | −77 | 36 | 52 | −5.3 | |
| Rolandic operculum | R | 38 | −23 | 21 | 30 | −5.8 | |
| Middle temporal gyrus | R | 47 | −53 | 12 | 29 | −5.6 | |
| Lingual gyrus | L | −11 | −59 | 12 | 29 | −6.1 | |
| Middle frontal gyrus | L | −20 | 11 | 45 | 12 | −4.6 | |
| TD | Angular gyrus | L | −38 | −74 | 33 | 39 | −6.1 |
| Angular gyrus | R | 38 | −74 | 39 | 19 | −5.3 | |
Homogeneous target present condition.
Between‐group comparisons revealed significantly greater activation in the left putamen for homogeneous present trials in the TD group. No significant between‐group effects were seen for any other condition or all search trials combined. Similar results were obtained when age was entered as a covariate in between‐group analyses.
ROIs for fcMRI analysis were selected from local maxima and minima within significant clusters of activation for all search trials for ASD and TD groups combined that corresponded to regions of dorsal and ventral attention networks as well as regions within the occipital lobe (Fig. 3A; Supporting Information Table SI). Separate mixed‐model ANOVAs using within‐subject factors distractor type (homogeneous, heterogeneous) and target presence (present, absent) and between‐subjects factor group (ASD, TD) were conducted on each ROI (Table 3; Supporting Information Fig. S1). Regions showing significantly greater activation to heterogeneous compared to homogeneous distractors included rFEF, lIPS, rINS, lMOG, rV1, and lV1. A significant main effect of target presence was found for rFEF, rIFG, and rMOG, reflecting increased activation to target absent as compared to target present trials. There was no significant main effect of group for any ROI. A significant interaction between distractor type and target presence was found for rFEF, rIPS, lIPS, rINS, rIFG, and lMOG. For all regions except the rIPS, follow‐up t‐tests revealed significantly greater activation for heterogeneous absent compared to heterogeneous present trials and significantly increased activation for heterogeneous absent compared to homogeneous present trials. For the rIPS, interaction was due to significantly increased activation for heterogeneous absent compared to heterogenous present and for heterogeneous present compared to homogeneous present trials. Additionally, there was no interaction between group and distractor type or target presence for any ROI, with the exception of the rIFG. Here, individuals with ASD exhibited significantly increased activation to heterogeneous compared to homogeneous trials, while TD individuals showed a (nonsignificant) opposite trend. Lastly, all but three regions (rMOG, rV1, lV1) showed a significant three‐way interaction between group, distractor type, and target presence. Simple effects revealed no significant group differences for any condition. Repeated measures ANOVAs conducted separately for each group showed that for all but one ROI (rTPJ) TD individuals showed an interaction between distractor type and target presence, while individuals with ASD did not (Supporting Information Table SII). As can be seen in Supporting Information Figure S1, this was due, in part, to greater activation in the heterogeneous absent condition relative to the heterogeneous present condition for the TD group, but more equivalent activation between the two conditions for the ASD group. Results for main effects of group and interactions between group and other factors for ROI analysis remained the same when age was entered as a covariate.
Table 3.
Statistical analysis of activation for regions of interest
| Brain region | Analysis of variance results | |||||||
|---|---|---|---|---|---|---|---|---|
| Group F(1, 36) | Distractor type F(1, 36) | Group × distractor type F(1, 36) | Target presence F(1, 36) | Group × target presence F(1, 36) | Distractor type × target presence F(1, 36) | Group × distractor type × target presence F(1, 36) | ||
| Dorsal network | rFEF | 0.02 | 10.97a | 0.42 | 4.94b | 2.21 | 9.18a | 14.82a |
| lFEF | 0.70 | 0.56 | 1.54 | 1.2 | 0.19 | 3.71 | 5.04b | |
| rIPS | 1.15 | 0.55 | 1.44 | 2.49 | 1.13 | 5.08b | 9.04a | |
| lIPS | 0.66 | 10.64a | 0.02 | 0.70 | 0.86 | 6.90b | 5.55b | |
| Ventral network | rINS | 0.45 | 5.82b | 0.69 | 2.68 | 0.07 | 10.24a | 5.56b |
| rIFG | 0.40 | 0.87 | 4.18b | 16.32a | 0.01 | 5.46b | 4.45b | |
| rTPJ | 0.86 | 2.93 | 2.11 | 0.82 | 0.09 | 0.50 | 5.86b | |
| rMFG | 0.02 | 1.03 | 0.10 | 0.00 | 0.00 | 0.96 | 7.50a | |
| Visual regions | rMOG | 0.29 | 1.51 | 0.08 | 6.47b | 0.41 | 0.69 | 1.19 |
| lMOG | 1.05 | 12.95a | 0.14 | 2.73 | 0.00 | 14.11a | 6.74b | |
| rV1 | 1.46 | 16.73a | 1.60 | 1.88 | 0.11 | 1.20 | 0.32 | |
| lV1 | 0.36 | 10.34a | 0.41 | 1.13 | 0.20 | 0.01 | 3.84 | |
P < 0.01.
P < 0.05.
ADOS correlations
Correlational analyses for ROI activation to homogenous and heterogeneous trials and ADOS algorithm scores revealed significant associations of rMFG activation with ADOS Communication scores for the homogeneous condition, r(18) = 0.49, P < 0.05, and with Communication and Total scores for the heterogeneous condition, r(18) = 0.64, P < 0.01 and r(18) = 0.49, P < 0.05, respectively. Additionally, there were significant correlations of lIPS activation with Social and Total scores for the homogeneous condition, r(18) = −0.49, P < 0.05 and r(18) = −0.56, P < 0.05, respectively, and with Social and Total scores for the heterogeneous condition, r(18) = −0.49, P < 0.05 and r(18) = −0.52, P < 0.05, respectively.
Connectivity Results
ROI analysis
A goal of the current study was to examine functional connectivity within and between attention networks involved in visual search and between these networks and visual‐occipital regions. Within‐network connectivity was examined by averaging z′ scores for within‐network ROI pairs. Between‐network connectivity was examined by averaging z′ scores for between‐network ROI pairs. In addition, for between‐network connectivity, mixed‐model ANOVAs were used to examine inter‐network connectivity of each region with dorsal and ventral networks. For both within‐ and between‐network ROI analyses, age was entered as a covariate (after determining that age met homogeneity of regression assumption); results for main effects of group and interactions between group and other factors remain unchanged.
Within‐network connectivity
A mixed‐model ANOVA was used to examine within‐network connectivity using within‐subject factor network (dorsal, ventral, visual) and between‐subject factor group (ASD, TD). There was a significant main effect of network, F(2, 72) = 5.3, P < 0.05. Simple effects revealed that dorsal network connectivity was greater than ventral, t(37) = 5.6, P < 0.05, but not visual, P = 0.3, networks. There was a marginally significant main effect of group, F(1, 36) = 3.7, P = 0.06, as individuals with ASD evidenced higher mean z′ scores for within‐network connections. The interaction between group and network was not significant, F(3, 108) = 0.46, P = 0.6.
Between‐network connectivity
A mixed‐model ANOVA was performed to examine between‐network connectivity using within‐subject factor inter‐network connection (dorsal‐ventral, dorsal‐visual, ventral‐visual) and between‐subjects factor group (ASD, TD). There was a significant main effect of inter‐network connection, F(2, 72) = 88.2, P < 0.01, with increased dorsal‐ventral connectivity relative to both dorsal‐visual, t(37) = 9.1, P < 0.01, and ventral‐visual connectivity, t(37) = 11.9, P < 0.01. Additionally, there was a marginally significant main effect of group, F(1, 36) = 3.1, P = 0.08, with greater inter‐network connectivity in ASD as compared to TD individuals (Fig. 4).
Figure 4.
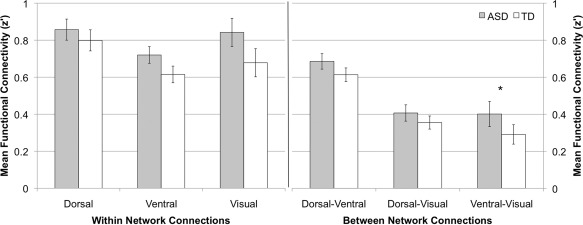
Mean z′ scores for within and between‐network connections. Error bars represent one standard error of the mean. *P < 0.05.
Between‐network connectivity was also assessed with a series of mixed‐model ANOVAs with between‐subjects factor group (ASD, TD) and within‐subjects factors consisting of two sets of network‐specific ROIs; for example, dorsal‐ventral connectivity was assessed using within‐subject factors dorsal (rFEF, lFEF, rIPS, lIPS) and ventral (rMFG, rINS, rIFG, rTPJ). For dorsal‐ventral connectivity, there were significant main effects of dorsal and ventral ROIs and significant interaction between‐network connectivity (all P < 0.01). There was no significant main effect of group, F(1, 36) = 1.7, P = 0.20, and no significant interaction between group and dorsal regions, F(3, 108) = 2.0, P = 0.12; however, there was a marginally significant interaction between group and ventral regions, F(3, 108) = 2.3, P = 0.08. Between‐group comparison of average dorsal connectivity for each ventral ROI showed significantly increased functional connectivity between rTPJ and dorsal network in ASD, t(37) = 2.3, P < 0.05. Dorsal connectivities for the other ventral ROIs were not significantly different between groups (all P > 0.3).
For dorsal‐visual connectivity, there were significant main effects of dorsal and visual ROIs and a significant interaction between‐network connectivity of ROIs (all P < 0.01). There was no significant main effect of group, F(1, 36) = 0.83, P = 0.37, and no significant interaction between group and visual regions, F(3, 108) = 0.56, P = 0.64. However, there was a marginally significant interaction between group and dorsal regions, F(3, 108) = 2.6, P = 0.06. Between‐group comparisons of average visual connectivity for each dorsal ROI showed marginally increased functional connectivity between rIPS and visual network in ASD, t(37) = 1.8, P = 0.08. Dorsal connectivity for the other visual ROIs was not significantly different between groups (all P > 0.1).
For ventral‐visual connectivity, there were significant main effects of ventral and visual ROIs and a significant interaction between‐network connectivity of ROIs (all P < 0.05). There were no significant interactions between group and either network (all P > 0.5). However, there was a significant main effect of group, F(1, 36) = 5.6, P < 0.05; individuals with ASD exhibited greater functional connectivity between ventral and visual ROIs as compared to TD individuals.
Whole brain analysis
Results from the whole brain analysis revealed areas of increased functional connectivity in ASD for ROIs of each network (Fig. 5; see Supporting Information Figure S2 for more detailed connectivity results). For the dorsal network, the ASD group showed increased connectivity between rIPS and a region associated with the ventral network, the right insula. For the ventral network, ASD participants demonstrated increased connectivity between rTPJ and bilateral middle frontal gyri and between rMFG and the right middle occipital gyrus. Finally, for the visual network the ASD group showed increased connectivity for long‐distance regions in the medial and lateral frontal cortex as well as increased connectivity for more local areas within the occipital lobe. Inclusion of age as a covariate resulted in additional regions of enhanced connectivity for the ASD group for lMOG, lV1, and rMFG seeds, and the absence of increased rTPJ‐rMFG connectivity in ASD group (Supporting Information Table SIII).
Figure 5.
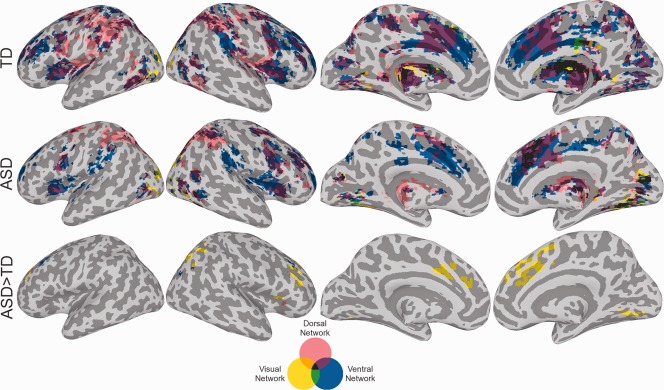
Conjunction maps for the whole brain functional connectivity analysis for dorsal, ventral, and visual networks. Connectivity maps adjusted to a cluster significance threshold of P < 0.05. [Color figure can be viewed in the online issue, which is available at http://wileyonlinelibrary.com.]
ADOS correlations
No correlation between ADOS algorithm scores and mean within‐ and between‐network connectivity reached significance (all P > 0.3).
DISCUSSION
We investigated brain activations and functional connectivity for visual search, considered a processing strength in ASD. Contrary to some previous behavioral and neuro‐imaging studies of visual search in ASD, we did not detect robust group differences in performance or activation. Furthermore, in contrast to many previous fcMRI studies of ASD that reported reduced connectivity for task domains of processing weakness, we found increased connectivity within and between attentional networks in ASD during visual search. Finally, we found both behavioral and neural indices of search to be related to sociocommunicative impairment in individuals with ASD.
Performance and fMRI Activation
Our results in part replicate findings from prior behavioral [Duncan and Humphreys, 1989] and neuroimaging [Donner et al., 2002; Wei et al., 1999; Wilkinson et al., 2005] studies of visual search. Both groups were faster to respond to homogeneous compared to heterogeneous and target present compared to absent trials. Further, both groups showed activation and deactivation in expected frontoparietal and occipital brain regions [Donner et al., 2002; Muller et al., 2003; Wei et al., 1999].
No group differences were found for any behavioral search measure, which is inconsistent with previous studies reporting superior visual search performance in ASD. Similarly, we did not detect differential patterns of activation, including greater activation in posterior brain regions in ASD [Keehn et al., 2008; Lee et al., 2007; Manjaly et al., 2007; Ring et al., 1999]. However, groups did display subtle differences in activation patterns for specific trial types in some regions. Activation levels between heterogeneous present and absent conditions were roughly equivalent for the ASD group, while TD individuals consistently showed increased activation to heterogeneous target absent compared to target present trials. This is consistent with previous behavioral findings of more robust differences (i.e., faster response time) in target absent compared to target present trials between ASD and TD groups [e.g., Joseph et al., 2009; O'Riordan et al., 2001].
Functional Connectivity
This study is among the first to examine activation functional connectivity for a domain considered to be a processing strength in ASD. In contrast to previous studies that have used tasks tapping into domains of impairment, we found increased functional connectivity in ASD. This finding is in agreement with an often overlooked prediction in the original proposal of the underconnectivity theory by Just et al. 2004, which was considered to apply only to task domains of processing weakness. However, the underconnectivity theory also predicts that individuals with ASD will show generally less dependence on frontal brain regions, irrespective of task domain. Our results do not support this prediction. In fact, our ASD group had equal or greater connectivity for ROI pairs that included frontal regions. Moreover, whole brain fcMRI analyses revealed significantly increased connectivity in ASD between seeds in occipital cortex and multiple frontal regions.
Our ROI‐based fcMRI findings revealed intact and even marginally increased within‐network connectivity in ASD. Likewise, between‐network connectivity showed intact or increased connectivity across all inter‐network connections in ASD. Further examination of between‐network connectivity revealed significantly increased functional connectivity between rTPJ and the dorsal network in ASD. Deactivation or suppression of rTPJ during search has been taken as evidence of filtering of task‐irrelevant information [Shulman et al., 2011; Wei et al., 1999]. One potential source of this top‐down signal that biases attention for task‐relevant information and results in rTPJ suppression is the dorsal attention network [Corbetta et al., 2008]. Additionally, our whole brain analysis revealed significantly increased connectivity between rTPJ and bilateral middle frontal gyri in ASD. MFG may play an important role in linking rTPJ to the dorsal network and function to transmit top‐down signals between the dorsal network and rTPJ [Corbetta et al., 2008].
Individuals, with ASD also showed increased connectivity between both attentional networks and occipital regions compared to TD individuals. Specifically, ROI‐based analyses revealed that individuals with ASD had significantly increased rIPS‐visual and ventral‐visual connectivity, while whole brain analyses showed increased connectivity within the occipital lobe and between occipital and frontal regions. Unusual activity in visual cortex has been previously observed in ASD studies, suggesting atypical reliance on visual‐perceptual processes [Samson et al., 2006]. Increased intraregional connectivity between occipital ROIs in our study suggests increased involvement and collaboration between visuo‐perceptual areas. However, our ASD group also showed increased connectivity between occipital and frontal regions. This finding is in agreement with previous studies reporting increased functional connectivity [Noonan et al., 2009] and EEG coherence [Leveille et al., 2010] between visual‐occipital and frontal regions, inconsistent with the common view of local overconnectivity being accompanied by long‐distance underconnectivity in ASD [Belmonte et al., 2004; Courchesne et al., 2007; Zikopoulos and Barbas, 2002]. Increased short‐ and long‐distance functional connectivity as measured by endogenous EEG coherence [Leveille et al., 2010] and intrinsic [Noonan et al., 2009] and activation (current study) fcMRI suggests that autistic functional brain organization may be associated with increased involvement of visual‐perceptual areas. This atypical network structure may result in increased occipital activation [Samson et al., 2006] and connectivity [Noonan et al., 2009] for nonperceptual tasks, possibly related to “islets of ability” for tasks that benefit from such increased visual‐occipital participation.
A recent survey of fcMRI studies in ASD indicated that activation fcMRI studies, which do not isolate intrinsic BOLD fluctuations through task regression and low‐pass filtering, may be more likely to report underconnectivity in ASD [Müller et al., 2011]. The results of this study, which was methodologically similar to previous activation fcMRI studies, suggest that the type of task may play an additional important role. Furthermore, analyses examining intrinsic within‐ and between‐network functional connectivity (both ROI and whole brain analysis) failed to show differences in connectivity between ASD and TD groups (see Supporting Information). Underconnectivity reports in the fcMRI literature on ASD may therefore relate to selection of tasks tapping into domains of impairment. For example, several activation fcMRI studies have reported reduced frontal‐parietal connectivity in ASD [e.g., Just et al., 2007; Kana et al., 2006]. Preserved dorsal network connectivity in the ASD group of this study suggests that underconnectivity between dorsal frontal‐parietal regions may have resulted from task selection and task‐related BOLD signal fluctuations [Jones et al., 2010] as results from a resting‐state fcMRI investigation have also demonstrated intact dorsal frontal‐parietal functional connectivity in ASD [Kennedy and Courchesne, 2008].
Lastly, eye‐tracking studies of visual search in ASD have demonstrated that enhanced performance in ASD is associated with both reduced frequency [Kemner et al., 2008] and duration [Joseph et al., 2009] of fixations [see Brenner et al., 2007, for review]. Abnormal eye movements observed during visual search may therefore relate to current activation and connectivity findings. For TD adults, prior functional imaging studies examining covert and overt visual search have shown similar level of activation, but differences in effective functional connectivity, for dorsal frontal‐parietal regions [Fairhall et al., 2009]. Although the current study did not collect concurrent eye movement data, these prior imaging results in TD individuals suggest that differences in connectivity could be related to atypical patterns of eye movements evidenced in previous studies of visual search in ASD. However, a definitive answer to this question can only be provided by fMRI studies with simultaneous eye‐tracking.
Correlations With Autism Symptomatology
We found a correlation between increased search efficiency and more severe symptomatology in our ASD group, consistent with a previous report by Joseph et al. 2009. Additionally, while no association was seen between sociocommunicative impairment and functional connectivity measures, we did detect correlations with levels of activation. We observed that increased activation in the right middle frontal gyrus was related to greater sociocommunicative impairment, consistent with findings reported by Gomot et al. 2008 for auditory target detection. These authors hypothesized that increased activation of the middle frontal gyrus in association with sociocommunicative impairment may be related to over‐focused attention in ASD, which could be beneficial during some nonsocial tasks such as visual search, but detrimental to the adaptive allocation of attention during dynamic social interactions.
In addition, we found that reduced activation of left intraparietal sulcus was related to greater ASD symptomatology. Prior research has suggested that the parietal lobe may be responsible for creating and maintaining a saliency map, which is used to direct visual attention [Corbetta and Shulman, 2002]. Therefore the inverse relationship between activation of the left intraparietal sulcus and sociocommunicative impairment may implicate a narrower attentional focus [Townsend and Courchesne, 2009]. The relationship between over‐focused attention and increased social impairment has been demonstrated elsewhere [Liss et al., 2006] and suggests that abnormalities in domain‐general attention function may be related to ASD symptomatology. While the functional and developmental significance of this brain‐behavior relationship has yet to be fully understood, the association between behavioral and neural indices of search efficiency and degree of social impairment suggests that processing strengths in nonsocial visuospatial processes may be related to the development of core autistic sociocommunicative impairments.
Limitations
Although correlations between imaging measures and ADOS scores identified in the current study are consistent with previous findings of associations between ASD symptomatology and visual search efficiency [Brock et al., 2011; Joseph et al., 2009] as well as neurofunctional activation [Gomot et al., 2008], our statistical analysis did not correct for multiple comparisons. Therefore these results should be interpreted with caution. Additionally, given the maturational changes in behavioral performance and functional activation and connectivity the wide range in age of our sample may confound the results of the current investigation; however, additional statistical analyses including age as covariate produced similar results suggesting that between group differences are not attributable to age‐related changes of these measures.
CONCLUSION
The results of this study demonstrate intact or increased activation functional connectivity in ASD for a task tapping into a processing strength. Prior intrinsic functional connectivity studies have found evidence of both increased and decreased functional connectivity in ASD [Müller et al., 2011]. Our findings suggest that brain organization in ASD may not be characterized by general underconnectivity, but by aberrant profiles of both decreased and increased connectivity. Results of previous visual search studies have linked superior visual search abilities in ASD to enhanced perceptual functioning [Caron et al., 2006; Joseph et al., 2009]. Increased intra‐occipital connectivity and long‐distance occipital‐frontal connectivity in previous reports [Leveille et al., 2010; Noonan et al., 2009] as well as the current study, could reflect a mechanism for such enhanced perceptual functioning that supports partially superior visual perceptual abilities in ASD.
We found that behavioral and brain measures of search efficiency were related to increased sociocommunicative impairment. Over‐focused attention, which may permit individuals with ASD to excel at visual search, may have costly repercussions when it comes to attending to relevant information necessary to perceive subtle social cues and successfully participate in rapid, dynamic social interactions.
Supporting information
Supporting Information
ACKNOWLEDGMENTS
Special thanks to the children and families who generously participated.
REFERENCES
- Agam Y, Joseph RM, Barton JJ, Manoach DS (2010): Reduced cognitive control of response inhibition by the anterior cingulate cortex in autism spectrum disorders. Neuroimage 52:336–347. [DOI] [PMC free article] [PubMed] [Google Scholar]
- Belmonte MK, Allen G, Beckel‐Mitchener A, Boulanger LM, Carper RA, Webb SJ (2004): Autism and abnormal development of brain connectivity. J Neurosci 24:9228–9231. [DOI] [PMC free article] [PubMed] [Google Scholar]
- Brenner LA, Turner KC, Müller RA (2007): Eye movement and visual search: Are there elementary abnormalities in autism? J Autism Dev Disord 37:1289–1309. [DOI] [PubMed] [Google Scholar]
- Brock J, Xu JY, Brooks KR (2011): Individual differences in visual search: Relationship to autistic traits, discrimination thresholds, and speed of processing. Perception 40:739–742. [DOI] [PubMed] [Google Scholar]
- Caron MJ, Mottron L, Berthiaume C, Dawson M (2006): Cognitive mechanisms, specificity and neural underpinnings of visuospatial peaks in autism. Brain 129 ( Pt 7):1789–1802. [DOI] [PubMed] [Google Scholar]
- Corbetta M, Shulman GL (2002): Control of goal‐directed and stimulus‐driven attention in the brain. Nat Rev Neurosci 3:201–215. [DOI] [PubMed] [Google Scholar]
- Corbetta M, Patel G, Shulman GL (2008): The reorienting system of the human brain: From environment to theory of mind. Neuron 58:306–324. [DOI] [PMC free article] [PubMed] [Google Scholar]
- Courchesne E, Pierce K, Schumann CM, Redcay E, Buckwalter JA, Kennedy DP, Morgan J (2007): Mapping early brain development in autism. Neuron 56:399–413. [DOI] [PubMed] [Google Scholar]
- Cox RW (1996): AFNI: Software for analysis and visualization of functional magnetic resonance neuroimages. Comput Biomed Res 29:162–173. [DOI] [PubMed] [Google Scholar]
- Dakin S, Frith U (2005): Vagaries of visual perception in autism. Neuron 48:497–507. [DOI] [PubMed] [Google Scholar]
- Damarla SR, Keller TA, Kana RK, Cherkassky VL, Williams DL, Minshew NJ, Just MA (2010): Cortical underconnectivity coupled with preserved visuospatial cognition in autism: Evidence from an fMRI study of an embedded figures task. Autism Res 3:273–279. [DOI] [PMC free article] [PubMed] [Google Scholar]
- Donner TH, Kettermann A, Diesch E, Ostendorf F, Villringer A, Brandt SA (2002): Visual feature and conjunction searches of equal difficulty engage only partially overlapping frontoparietal networks. Neuroimage 15:16–25. [DOI] [PubMed] [Google Scholar]
- Duncan J, Humphreys GW (1989): Visual search and stimulus similarity. Psychol Rev 96:433–458. [DOI] [PubMed] [Google Scholar]
- Fairhall SL, Indovina I, Driver J, Macaluso E (2009): The brain network underlying serial visual search: Comparing overt and covert spatial orienting, for activations and for effective connectivity. Cereb Cortex 19:2946–2958. [DOI] [PubMed] [Google Scholar]
- Forman SD, Cohen JD, Fitzgerald M, Eddy WF, Mintun MA, Noll DC (1995): Improved assessment of significant activation in functional magnetic resonance imaging (fMRI): Use of a cluster‐size threshold. Magn Reson Med 33:636–647. [DOI] [PubMed] [Google Scholar]
- Gomot M, Belmonte MK, Bullmore ET, Bernard FA, Baron‐Cohen S (2008): Brain hyper‐reactivity to auditory novel targets in children with high‐functioning autism. Brain 131 ( Pt 9):2479–2488. [DOI] [PubMed] [Google Scholar]
- Greicius MD, Supekar K, Menon V, Dougherty RF (2009): Resting‐state functional connectivity reflects structural connectivity in the default mode network. Cereb Cortex 19:72–78. [DOI] [PMC free article] [PubMed] [Google Scholar]
- Hampson M, Olson IR, Leung HC, Skudlarski P, Gore JC (2004): Changes in functional connectivity of human MT/V5 with visual motion input. Neuroreport 15:1315–1319. [DOI] [PubMed] [Google Scholar]
- Jones TB, Bandettini PA, Kenworthy L, Case LK, Milleville SC, Martin A, Birn RM (2010): Sources of group differences in functional connectivity: An investigation applied to autism spectrum disorder. Neuroimage 49:401–414. [DOI] [PMC free article] [PubMed] [Google Scholar]
- Joseph RM, Keehn B, Connolly C, Wolfe JM, Horowitz TS (2009): Why is visual search superior in autism spectrum disorder? Dev Sci 12:1083–1096. [DOI] [PubMed] [Google Scholar]
- Just MA, Cherkassky VL, Keller TA, Kana RK, Minshew NJ (2007): Functional and anatomical cortical underconnectivity in autism: Evidence from an FMRI study of an executive function task and corpus callosum morphometry. Cereb Cortex 17:951–961. [DOI] [PMC free article] [PubMed] [Google Scholar]
- Just MA, Cherkassky VL, Keller TA, Minshew NJ (2004): Cortical activation and synchronization during sentence comprehension in high‐functioning autism: Evidence of underconnectivity. Brain 127 ( Pt 8):1811–1821. [DOI] [PubMed] [Google Scholar]
- Kaldy Z, Kraper C, Carter AS, Blaser E (2011): Toddlers with autism spectrum disorder are more successful at visual search than typically developing toddlers. Dev Sci 14:980–988. [DOI] [PMC free article] [PubMed] [Google Scholar]
- Kana RK, Keller TA, Cherkassky VL, Minshew NJ, Just MA (2006): Sentence comprehension in autism: Thinking in pictures with decreased functional connectivity. Brain 129 ( Pt 9):2484–2493. [DOI] [PMC free article] [PubMed] [Google Scholar]
- Kana RK, Keller TA, Minshew NJ, Just MA (2007): Inhibitory control in high‐functioning autism: Decreased activation and underconnectivity in inhibition networks. Biol Psychiatry 62:198–206. [DOI] [PMC free article] [PubMed] [Google Scholar]
- Kana RK, Keller TA, Cherkassky VL, Minshew NJ, Just MA (2009): Atypical frontal‐posterior synchronization of theory of mind regions in autism during mental state attribution. Soc Neurosci 4:135–152. [DOI] [PMC free article] [PubMed] [Google Scholar]
- Keehn B, Brenner L, Palmer E, Lincoln AJ, Müller RA (2008): Functional brain organization for visual search in ASD. J Int Neuropsychol Soc 14:990–1003. [DOI] [PubMed] [Google Scholar]
- Kemner C, van Ewijk L, van Engeland H, Hooge I (2008): Brief report: Eye movements during visual search tasks indicate enhanced stimulus discriminability in subjects with PDD. J Autism Dev Disord 38:553–557. [DOI] [PMC free article] [PubMed] [Google Scholar]
- Kennedy DP, Courchesne E (2008): The intrinsic functional organization of the brain is altered in autism. Neuroimage 39:1877–1885. [DOI] [PubMed] [Google Scholar]
- Kleinhans NM, Richards T, Sterling L, Stegbauer KC, Mahurin R, Johnson LC, Greenson J, Dawson G, Aylward E (2008): Abnormal functional connectivity in autism spectrum disorders during face processing. Brain 131 ( Pt 4):1000–1012. [DOI] [PubMed] [Google Scholar]
- Koshino H, Carpenter PA, Minshew NJ, Cherkassky VL, Keller TA, Just MA (2005): Functional connectivity in an fMRI working memory task in high‐functioning autism. Neuroimage 24:810–821. [DOI] [PubMed] [Google Scholar]
- Koshino H, Kana RK, Keller TA, Cherkassky VL, Minshew NJ, Just MA (2008): fMRI investigation of working memory for faces in autism: Visual coding and underconnectivity with frontal areas. Cereb Cortex 18:289–300. [DOI] [PMC free article] [PubMed] [Google Scholar]
- Lee PS, Foss‐Feig J, Henderson JG, Kenworthy LE, Gilotty L, Gaillard WD, Vaidya CJ (2007): Atypical neural substrates of embedded figures task performance in children with autism spectrum disorder. Neuroimage 38:184–193. [DOI] [PMC free article] [PubMed] [Google Scholar]
- Lee PS, Yerys BE, Della Rosa A, Foss‐Feig J, Barnes KA, James JD, VanMeter J, Vaidya CJ, Gaillard WD, Kenworthy LE (2009): Functional connectivity of the inferior frontal cortex changes with age in children with autism spectrum disorders: A fcMRI study of response inhibition. Cereb Cortex 19:1787–1794. [DOI] [PMC free article] [PubMed] [Google Scholar]
- Leveille C, Barbeau EB, Bolduc C, Limoges E, Berthiaume C, Chevrier E, Mottron L, Godbout R (2010): Enhanced connectivity between visual cortex and other regions of the brain in autism: A REM sleep EEG coherence study. Autism Res 3:280–285. [DOI] [PubMed] [Google Scholar]
- Lincoln AJ, Courchesne E, Kilman BA, Elmasian R, Allen M (1988): A study of intellectual abilities in high‐functioning people with autism. J Autism Dev Disord 18:505–524. [DOI] [PubMed] [Google Scholar]
- Liss M, Saulnier C, Fein D, Kinsbourne M (2006): Sensory and attention abnormalities in autistic spectrum disorders. Autism 10:155–172. [DOI] [PubMed] [Google Scholar]
- Lord C, Rutter M, DiLavore PC, Risi S.1999Autism Diagnostic Obervation Schedule—WPS (ADOS‐WPS).Los Angeles, CA:Western Psychological Services. [Google Scholar]
- Manjaly ZM, Bruning N, Neufang S, Stephan KE, Brieber S, Marshall JC, Kamp‐Becker I, Remschmidt H, Herpertz‐Dahlmann B, Konrad K, Fing GR (2007): Neurophysiological correlates of relatively enhanced local visual search in autistic adolescents. Neuroimage 35:283–291. [DOI] [PMC free article] [PubMed] [Google Scholar]
- Mason RA, Williams DL, Kana RK, Minshew N, Just MA (2008): Theory of mind disruption and recruitment of the right hemisphere during narrative comprehension in autism. Neuropsychologia 46:269–280. [DOI] [PMC free article] [PubMed] [Google Scholar]
- Mottron L, Dawson M, Soulieres I, Hubert B, Burack J (2006): Enhanced perceptual functioning in autism: An update, and eight principles of autistic perception. J Autism Dev Disord 36:27–43. [DOI] [PubMed] [Google Scholar]
- Muller NG, Donner TH, Bartelt OA, Brandt SA, Villringer A, Kleinschmidt A (2003): The functional neuroanatomy of visual conjunction search: A parametric fMRI study. Neuroimage 20:1578–1290. [DOI] [PubMed] [Google Scholar]
- Müller RA, Shih P, Keehn B, Deyoe JR, Leyden KM, Shukla DK (2011): Underconnected, but how? A survey of functional connectivity MRI studies in autism spectrum disorders. Cereb Cortex 21:2233–2243. [DOI] [PMC free article] [PubMed] [Google Scholar]
- Noonan SK, Haist F, Müller RA (2009): Aberrant functional connectivity in autism: Evidence from low‐frequency BOLD signal fluctuations. Brain Res 1262:48–63. [DOI] [PMC free article] [PubMed] [Google Scholar]
- O'Riordan M, Plaisted K (2001): Enhanced discrimination in autism. Q J Exp Psychol A 54:961–979. [DOI] [PubMed] [Google Scholar]
- O'Riordan MA, Plaisted KC, Driver J, Baron‐Cohen S (2001): Superior visual search in autism. J Exp Psychol Hum Percept Perform 27:719–730. [DOI] [PubMed] [Google Scholar]
- Prado J, Weissman DH (2011): Spatial attention influences trial‐by‐trial relationships between response time and functional connectivity in the visual cortex. Neuroimage 54:465–473. [DOI] [PubMed] [Google Scholar]
- Prado J, Carp J, Weissman DH (2011): Variations of response time in a selective attention task are linked to variations of functional connectivity in the attentional network. Neuroimage 54:541–549. [DOI] [PMC free article] [PubMed] [Google Scholar]
- Ring HA, Baron‐Cohen S, Wheelwright S, Williams SC, Brammer M, Andrew C, Bullmore ET (1999): Cerebral correlates of preserved cognitive skills in autism: A functional MRI study of embedded figures task performance. Brain 122 ( Pt 7):1305–1315. [DOI] [PubMed] [Google Scholar]
- Rippon G, Brock J, Brown C, Boucher J (2007): Disordered connectivity in the autistic brain: Challenges for the “new psychophysiology.” Int J Psychophysiol 63:164–172. [DOI] [PubMed] [Google Scholar]
- Rutter M, Le Couteur A, Lord C (2003). Autism Diagnostic Interview – Revised. Los Angeles, CA: Western Psychological Services. [Google Scholar]
- Saad ZS, Chen G, Reynolds RC, Christidis PP, Hammett KR, Bellgowan PS, Cox RW (2006): Functional imaging analysis contest (FIAC) analysis according to AFNI and SUMA. Hum Brain Mapp 27:417–424. [DOI] [PMC free article] [PubMed] [Google Scholar]
- Samson F, Mottron L, Soulieres I, Zeffiro TA (2011): Enhanced visual functioning in autism: An ALE meta‐analysis. Hum Brain Mapp. doi: 10.1002/hbm.2130. [DOI] [PMC free article] [PubMed] [Google Scholar]
- Shulman GL, Astafiev SV, McAvoy MP, d'Avossa G, Corbetta M (2007): Right TPJ deactivation during visual search: Functional significance and support for a filter hypothesis. Cereb Cortex 17:2625–2633. [DOI] [PubMed] [Google Scholar]
- Solomon M, Ozonoff SJ, Ursu S, Ravizza S, Cummings N, Ly S, Carter CS (2009): The neural substrates of cognitive control deficits in autism spectrum disorders. Neuropsychologia 47:2515–2526. [DOI] [PMC free article] [PubMed] [Google Scholar]
- Thai NJ, Longe O, Rippon G (2009): Disconnected brains: What is the role of fMRI in connectivity research? Int J Psychophysiol 73:27–32. [DOI] [PubMed] [Google Scholar]
- Townsend J, Courchesne E (1994): Parietal damage and narrow “spotlight” spatial attention. J Cogn Neurosci 6:220–232. [DOI] [PubMed] [Google Scholar]
- van den Heuvel MP, Mandl RC, Kahn RS, Hulshoff Pol HE (2009): Functionally linked resting‐state networks reflect the underlying structural connectivity architecture of the human brain. Hum Brain Mapp 30:3127–3141. [DOI] [PMC free article] [PubMed] [Google Scholar]
- Van Dijk KR, Hedden T, Venkataraman A, Evans KC, Lazar SW, Buckner RL (2010): Intrinsic functional connectivity as a tool for human connectomics: Theory, properties, and optimization. J Neurophysiol 103:297–321. [DOI] [PMC free article] [PubMed] [Google Scholar]
- Wechsler D.1999Wechsler's Abbreviated Scale of Intelligence.San Antonio, TX:The Psychological Corporation. [Google Scholar]
- Wei P, Muller HJ, Pollmann S, Zhou X (2009): Neural basis of interaction between target presence and display homogeneity in visual search: An fMRI study. Neuroimage 45:993–1001. [DOI] [PubMed] [Google Scholar]
- Welchew DE, Ashwin C, Berkouk K, Salvador R, Suckling J, Baron‐Cohen S, Bullmore E (2005): Functional disconnectivity of the medial temporal lobe in Asperger's syndrome. Biol Psychiatry 57:991–998. [DOI] [PubMed] [Google Scholar]
- Wilkinson DT, Halligan PW, Henson RN, Dolan RJ (2002): The effects of interdistracter similarity on search processes in superior parietal cortex. Neuroimage 15:611–619. [DOI] [PubMed] [Google Scholar]
- Zikopoulos B, Barbas H (2010): Changes in prefrontal axons may disrupt the network in autism. J Neurosci 30:14595–14609. [DOI] [PMC free article] [PubMed] [Google Scholar]
Associated Data
This section collects any data citations, data availability statements, or supplementary materials included in this article.
Supplementary Materials
Supporting Information