

Abstract
Genetically encoded catalysts for non-natural chemical reactions will open new routes to sustainable production of chemicals. We designed a unique serine-heme ligated cytochrome “P411” that catalyzes efficient and selective carbene transfers from diazoesters to olefins in intact Escherichia coli cells. The mutation C400S in cytochrome P450BM3 gives a signature ferrous-CO Soret peak at 411 nm, abolishes monooxygenation activity, raises the resting state FeIII/II reduction potential, and significantly improves NAD(P)H-driven cyclopropanation activity.
Genetically programmed whole-cell biocatalysts are readily produced in simple growth media, do not require further purification or isolation and can be engineered with biosynthetic pathways for the elaboration of complex molecules1–3. The range of accessible transformations, however, is currently limited to the chemical repertoire of natural enzymes. Designing enzymes for non-natural reactions in vivo has been challenging due to the requirements for assembly of the functional catalyst, the compatibility of synthetic reagents in the cellular milieu, and cell permeability to allow substrate influx and product release. The catalysis of non-natural transformations inside cells will enable alternative biosynthetic routes to natural and artificial products, biocatalytic production of chemicals currently made using synthetic reactions, and will expand the chemical toolbox available for in vivo studies of cellular function4.
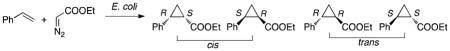
We recently showed that a few amino acid mutations in a bacterial cytochrome P450 monooxygenase can unlock significant cyclopropanation activity in vitro. Variants of P450BM3 from Bacillus megaterium catalyze hundreds of turnovers of formal carbene transfers from diazoesters (e.g. ethyl diazoacetate, EDA) to olefins (e.g. styrene) in the presence of a reductant, forming cyclopropane products with high levels of diastereo- and enantioselectivity5. Olefin cyclopropanation is widely used in the synthesis of fine chemicals6, and state-of-the-art asymmetric organometallic catalysts are able to catalyze thousands to tens of thousands of turnovers7–9. Because P450BM3 variants are readily expressed in functional form and can catalyze non-natural carbene transfers without requiring artificial cofactors or posttranslational modifications, we hypothesized that this system may be suitable for in vivo catalysis. To initiate the catalytic cycle inside a cell, it is necessary to reduce the enzyme to the catalytically active ferrous-P450 with an endogenous reducing agent such as NAD(P)H. Based on consideration of heme ligation control of the P450 FeIII/FeII reduction potential, we have designed genetically encoded cytochrome P411 enzymes which catalyze efficient and selective olefin cyclopropanation in intact cells.
Cytochrome P450BM3-catalyzed cyclopropanations require substoichiometric (with respect to diazoester and olefin) reductant and proceed optimally under anaerobic conditions5. This suggests that diazoester activation and carbene transfer involve a reduced P450-bound FeII-heme prosthetic group as opposed to the resting state FeIII-heme (Fig. 1A). Active cyclopropanation catalysts derived from either full-length P450BM3, which contains a catalytic heme domain fused to a NADPH-driven P450-reductase domain, or the isolated heme domain (P450BM3-heme) show marked preference for strong reducing agents such as dithionite (E°′ = −660 mV, all potentials vs SHE) over native NAD(P)H (E°′ = −320 mV)5. Reduced activity in the presence of NAD(P)H suggests a limited substrate-induced low-spin (E°′ FeIII/II = −430 mV) to high-spin (E°′ FeIII/II = −290 mV) transition of the P450 heme-iron10, which, while essential for monooxygenation, may not be achievable in this engineered system due to the poor affinity for the non-natural substrates (where weak substrate binding is suggested by a KM value of ~5 mM)5. We hypothesized that raising the reduction potential of the resting state enzyme to facilitate NAD(P)H-driven reduction would enhance FeII catalysis in vivo. Aware that the reduction potential of heme proteins can be tuned by axial ligand mutations11,12, we reasoned that substituting the axial cysteine thiolate in P450BM3 with the weakly donating serine alcohol should raise the FeIII/II potential [Fig. 1A]. Furthermore, axial cysteinate ligation is essential for dioxygen activation and stabilization of the active ferryl-porphyrin cation radical oxidant (compound I) during monooxygenation13, and axial cysteine to serine substitutions have been reported to abolish monooxygenation activity in mammalian P450s14. Because free hemin is also a (poor) cyclopropanation catalyst5, we anticipated that an axial cysteine to serine mutation (C400S in P450BM3) would maintain carbene transfer activity while eliminating monooxygenation activity.
Figure 1.

Contrasting P450- and P411-mediated cyclopropanation. (A) Cytochrome P450s inefficiently catalyze cyclopropanation using NAD(P)H as a reductant because the FeIII/FeII redox potential for the low-spin resting state (E°′Fe-cys = −430 mV) is lower than that of NAD(P)+/NAD(P)H (E°′1 = −320 mV, right). Mutation of the heme-ligating Cys to Ser allows NAD(P)H-driven cyclopropanation while removing native monooxygenation (left). (B) Close-up of the P411BM3-heme-CIS active site (PDB: 4H24) superimposed with an Fo - Fc simulated annealing omit map contoured at 3 σ showing electron density (green mesh) corresponding to the bound heme and C400S mutation. Heme, C400S and additional active site amino acid side chains are shown as sticks. (C) In vitro cyclopropanation vs. epoxidation of styrene catalyzed by P450BM3-CIS and P411BM3-CIS under anaerobic and aerobic conditions. Reaction conditions were as follows: 30 mM styrene, 10 mM EDA, 0.5 mM NADPH, 25 mM glucose, 2 U ml−1 glucose dehydrogenase and 20 μM enzyme in aqueous potassium phosphate buffer and 5% MeOH cosolvent for six hours at 25 °C. Error bars represent the standard deviation of three independent measurements.
We chose to introduce the C400S mutation into a cis-selective cyclopropanation catalyst from our previous work, P450BM3-CIS [13 mutations from P450BM3, Online Methods], to contrast with the trans-selectivity observed with iron-porphyrins15. P450BM3-CIS catalyzes hundreds of turnovers in the presence of dithionite in vitro and forms the ethyl 2-phenylcyclopropane-1-carboxylate product with 71% cis-selectivity and 94% enantiomeric excess (eecis)5. UV-vis spectra for the green-brown P450BM3-CIS-C400S (P411BM3-CIS, Supplementary Results, Supplementary Figs. 1–3), marked by a ferrous carbon monoxide-bound complex at 411 nm, were consistent with those reported for a Ser-ligated mammalian P45014,16 (Supplementary Table 1). Because of this signature FeII–CO band at 411 nm, we call these new P450-derived Ser-ligated enzymes cytochrome “P411s”, and will refer to the C400S P450BM3 variants as “P411BM3” enzymes. Heme-serine ligation in P411BM3-CIS was further confirmed by determining the crystal structures of the P450BM3-CIS and P411BM3-CIS heme domains at 2.5 and 3.3 Å, respectively (Supplementary Fig. 4 and Supplementary Table 2, PDB: 4H23 and 4H24); the structures were superimposable (RMSD = 0.52 Å, Supplementary Fig. 4). Despite the limited resolution of the P411BM3-CIS structure, simulated annealing omit maps generated in the absence of modeled heme and C400S showed density consistent with heme coordination by a proximal amino acid side chain (Fig. 1B and Supplementary Fig. 5).
Potentiometric redox titrations were performed using the truncated heme domains of wild-type P450BM3, its C400S variant (P411BM3), P450BM3-CIS and P411BM3-CIS (Supplementary Figs. 6 to 9). The C400S mutation raised the reduction potential of the resting state wild-type P450BM3-heme by +127 mV (E°′ FeIII/IISer = −293 mV for P411BM3-heme), a shift similar in magnitude to that which occurs in P450BM3 upon substrate binding10. The 13 amino acid mutations in P450BM3-heme -CIS increased the reduction potential by +60 mV with respect to wild-type P450BM3-heme (E°′ FeIII/IICys = −360 mV for P450BM3-heme-CIS), but still left P450BM3-heme-CIS with a lower reduction potential than NAD(P)+/NAD(P)H. Introducing the C400S mutation in P450BM3-heme-CIS raised its reduction potential by another +95 mV (E°′ FeIII/IISer = −265 mV for P411BM3-heme-CIS). That the two C400S enzymes have resting state reduction potentials more positive than that of NAD(P)+/NAD(P)H should allow full-length P411s to be reduced by NAD(P)H even in the absence of substrate.
The truncated P411BM3-heme-CIS was an active dithionite-driven cyclopropanation catalyst in vitro, with Michaelis-Menten parameters (kcat = 82 min−1, KM-styrene = 4.6 mM, KM-EDA = 5.7 mM, Supplementary Fig. 10), comparable to those of P450BM3-heme-CIS (Supplementary Table 3). P411BM3-heme-CIS displayed considerably improved diastereo- (cis:trans 93:7) and enantioselectivity (99% eecis) compared to its cysteine homologue (Supplementary Table 4 and Supplementary Fig. 11), an unexpected result given the similar active site geometries of the two catalysts (Supplementary Fig. 4). For a variety of styrenyl substrates, P411BM3-heme-CIS showed superior cis-selectivity relative to P450BM3-heme-CIS (Supplementary Table 5). The full-length, reductase-fused P411BM3-CIS showed increased activity compared to holo P450BM3-CIS when NADPH was used as the reductant under anaerobic conditions (Fig. 1C and Supplementary Table 6). P450BM3-CIS only formed small amounts of cyclopropanes when NADPH was used, and formed styrene oxide, via monooxygenation, as the major product under aerobic conditions. In contrast, P411BM3-CIS produced negligible amounts of styrene oxide, confirming removal of monooxygenase activity, and was still able to form cyclopropanes under aerobic conditions, albeit with lower yields (43 TTN) due to oxygen inhibition (Fig. 1C). Dioxygen inhibition could be due to a two-electron oxidase activity as reported for CYP2B4-C436S14. NADH drove P411BM3-CIS-mediated cyclopropanation as efficiently as NADPH (Supplementary Table 7), suggesting that P411BM3-CIS should be well suited for in vivo catalysis under anaerobic conditions where NADPH biosynthesis in E. coli does not take place. The apparent lack of the substoichiometric cofactor preference for cyclopropanation TTN contrasts with P450BM3’s reported specificity for NADPH17.
We next investigated the efficiency of cyclopropanation using resting Escherichia coli [BL21(DE3)] cells grown in M9Y media [M9, 1.5% yeast extract, Online Methods] expressing full-length P450BM3-CIS and P411BM3-CIS. Addition of glucose under anaerobic conditions significantly increased product yield (Supplementary Table 8), presumably due to enhanced intracellular production of NADH, although other cellular reductants could also be involved in reducing the enzyme in vivo. P411BM3-CIS catalyzed thousands of turnovers in vivo, was about four times more active than P450BM3-CIS in the whole-cell system, and provided cyclopropane products with enhanced cis- enantioselectivity (Table 1, entries 1 and 2). The C400S mutation compromises protein expression such that P411BM3-CIS accounts for 2% of dry cell mass compared to 6% for P450BM3-CIS (entries 1 and 2). The reduced expression was not due to decreased protein stability, as C400S contributed to increased thermostability in the purified P411BM3-CIS heme domain (P411BM3-heme-CIS, Supplementary Fig. 12). Full-length P411BM3-CIS (entry 2), which contains both heme and diflavin reductase domains, was over two times more active on a molar basis than the truncated heme domain (P411BM3-heme-CIS, entry 3), confirming that reduction to the ferrous state in vivo was important, but also showing that the reducing intracellular environment achieved heme reduction even in the absence of the reductase domain. The single C400S mutation in P411BM3 (entry 4) improved the in vivo cyclopropanation activity of wild-type P450BM3 (entry 5) by over two orders of magnitude. Purified full-length P411BM3 was also an efficient NADH-driven cyclopropanation catalyst in vitro, whereas P450BM3 was barely active (Supplementary Table 9).
Table 1.
Cyclopropanation activities for intact E. coli cells expressing engineered enzymes.
| |||||||||
|---|---|---|---|---|---|---|---|---|---|
| Entry | Catalyst | [EDA] (mM) | Cell Density (gcdw/L) | [P450] (3M) | Yield (%) | TTN | cis:trans | eecis (%)* | eetrans (%)† |
| 1 | P450BM3-CIS | 8.5 | 7.7 | 3.7 | 42 | 950 | 22:78 | 60 | 22 |
| 2 | P411BM3-CIS | 8.5 | 7.7 | 1.3 | 55 | 3,700 | 76:24 | 96 | 25 |
| 3 | P411BM3-heme-CIS | 8.5 | 7.7 | 3.6 | 67 | 1,600 | 71:29 | 95 | 17 |
| 4 | P450BM3 | 8.5 | 13.4 | 4.8 | 0.9 | 15 | 25:75 | 24 | 21 |
| 5 | P411BM3 | 8.5 | 8.1 | 1.5 | 50 | 2,900 | 13:87 | 12 | 8 |
| 6 | P411BM3-CIS + CO | 8.5 | 8.4 | 1.8 | 0.6 | 30 | 20:80 | 35 | 20 |
| 7 | P411BM3-CIS‡ | 170 | 8.4 | 1.8 | 72 | 67,800 | 90:10 | 99 | 43 |
| 8 | P411BM3-CIS‡ | 200 | 20 | 3.2 | 78§ | 48,800 | 88:12 | 99 | 35 |
P411BM3 = P450BM3-C400S
TTN = total turnover number. Major products:
cis = (1R,2S);
trans = (1S,2S)
Neat reagents were used without addition of MeOH; reactions were left for 24 h.
Isolated yield (1.63 g cyclopropanes). The data represent the averages of triplicate experiments. Standard errors are within 20% of the reported average.
Both P411BM3-CIS and P450BM3-CIS whole cells were significantly inhibited by dioxygen (Supplementary Fig. 13). Whole cells containing the P411BM3-CIS gene but with no induction and whole cells devoid of the P411BM3-CIS gene were able to form small amounts of cyclopropanes, but did so with stereoselectivity similar to that of free hemin (Supplementary Table 10 and Fig. 14). This is not surprising since free hemin and other heme proteins present in cells are also able to catalyze styrene cyclopropanation at low levels5. Whole-cell P411BM3-CIS catalysts were as stereoselective as purified P411BM3-CIS in vitro at equivalent catalyst loading (vide infra), demonstrating that the overexpressed P411 enzyme outcompeted background catalysis. In vivo cyclopropanation was strongly inhibited by carbon monoxide (Table 1, entry 6), which irreversibly binds ferrous heme in vitro; as the bacteria are tested in stationary phase and CO is thus unlikely to cause overall cell death via poisoning of the respiratory chain, this result provides support for catalysis occurring in the enzyme active site. Yield could be increased to 80% by increasing the cell density up to OD600 = 50 (Supplementary Fig. 15). Using excess styrene only slightly improved reaction yield (Supplementary Fig. 16). Lysate of cells expressing full-length P411BM3-CIS that were supplemented with NADH retained only about 30% of the activity of the intact whole cells and were not active in the absence of exogenous reductant (Supplementary Table 11). Addition of dithionite inhibited P411BM3-CIS whole-cell reactions and was less efficient than NADH in driving the reaction in cell lysate (Supplementary Tables 10 and 11).
In order to provide a direct comparison of full-length P411BM3-CIS activity in vivo versus in vitro, we monitored both reactions at the same enzyme concentration over 8 hours (Supplementary Fig. 17). On a molar basis, the in vivo catalyst showed almost 6 times higher TTN than the purified enzyme after 6 hours and retained the same stereoselectivity (75:25 cis:trans, 95% eecis). Both catalysts remained active over this period, suggesting that the observed differences in yield and TTN are due to improved activity rather than enhanced catalyst stability in vivo. Gradual addition of EDA did not improve the reaction yield.
At high substrate loading (170 mM EDA, 400 mM styrene, added as neat reagents), more than 60,000 catalytic turnovers were observed in the in vivo reaction with P411BM3-CIS (Table 1, entry 7). P411BM3-CIS whole-cell reactions were readily scalable to make gram quantities of cyclopropanes with high stereoselectivity, product titer (27 g L−1) and yield (78%, entry 8). No organic cosolvent was necessary, and the cyclopropane products were readily obtained by extraction with organic solvent at the end of the reaction (Online Methods). Furthermore, the cells could be lyophilized with a cryoprotectant such as sucrose and stored as a powder for weeks at 4 °C without degradation of catalytic activity or diastereo- and enantioselectivity (Supplementary Table 12). Lyophilized cells can be readily packaged and distributed. These features render whole-cell P411 catalysts attractive for facile benchtop synthesis.
Cytochrome P411s are spectroscopically, electrochemically, and catalytically distinct from cytochrome P450s, providing a scaffold for engineering orthogonal heme-enzyme catalysis. Whole-cell catalysts based on serine-heme ligated P411s are easy to use and deliver enzymatic cyclopropanation with high conversion, optical purity and yield for substrate input in the tens of grams per liter. The ability to catalyze this non-natural C-C bond forming reaction in vivo will expand the scope of transformations accessible to microbial organic synthesis and should provide artificial metabolic pathways to complement nature’s existing strategies for making cyclopropanes18.
Online Methods
Materials and methods
All reagents were obtained from commercial suppliers (Sigma-Aldrich) and used without further purification. 1H and 13C NMR spectra were recorded on either a Varian Mercury 300 spectrometer (300 MHz and 75 MHz, respectively), or a Varian Inova 500 MHz (500 MHz and 125 MHz, respectively), and are internally referenced to residual solvent peak. High-resolution mass spectra were obtained with a JEOL JMS-600H High Resolution Mass Spectrometer. Gas chromatography (GC) analyses were carried out using a GC-17A gas chromatograph (Shimadzu), a FID detector, and a J&W cyclosil-B column (30 m × 0.25 mm, 0.25 μm film, Agilent) and 2-phenylethanol as an internal standard. Injector temperature = 300 °C, oven temperature = 130 °C for 30 min, pressure = 175 kPa. Elution time: cis-cyclopropanes [19.7 min (2R,1S) and 21.0 min (2S,1R)], trans-cyclopropanes [25.8 min (2R,1R) and 26.4 min (2S,1S)]. Cyclopropane product standards for the reaction of ethyl diazoacetate (EDA) with styrene (ethyl 2-phenylcyclopropane-1-carboxylate) and α-methylstyrene (ethyl 2-methyl-2-phenylcyclopropane-1-carboxylate) were prepared as reported19. These standards and enzyme-prepared cyclopropanes demonstrated identical retention times in gas chromatograms when co-injected, confirming product identity. Absolute stereoconfiguration of cyclopropane enantiomers was determined by measuring optical rotation of purified cyclopropane products from preparative bioconversion reactions using enantioselective P450BM3 variants and referenced to values taken from reference20. Authentic P450-catalyzed cyclopropane samples were also prepared and were characterized by NMR (1H and 13C) and mass spectrometry, which matched literature values.
Plasmids pCWori[P450BM3] and pET22 were used as cloning vectors. The C400S mutation was introduced by standard overlap mutagenesis using primers bearing the desired mutation (IDT, San Diego, CA).
Forward Primers:
HF1: CAGGAAACAGGATCAGCTTACTCCCC
BM3_C400S_F_nheI: GAAACGGTCAGCGTGCTAGCATCGGTCAGCAGTTCG
Respective Reverse Primers:
BM3_C400S_R_nheI: CGAACTGCTGACCGATGCTAGCACGCTGACCGTTTC
pCWori-Rev: GCGTATCACGAGGCCCTTTCGTCTTCAAGC
Electrocompetent Escherichia coli cells were prepared following the protocol of Sambrook et al.21. Restriction enzymes BamHI, EcoRI, XhoI, Phusion polymerase, and T4 ligase were purchased from New England Biolabs (NEB, Ipswich, MA). Alkaline phosphatase was obtained from Roche (Nutley, NJ). The 1,000x trace metal mix used in expression cultures contained 50 mM FeCl3, 20 mM CaCl2, 10 mM MnSO4, 10 mM ZnSO4, 2 mM CoSO4, 2 mM CuCl2, 2 mM NiCl2, 2 mM Na2MoO4, and 2 mM H3BO3.
CO binding assay
P450 concentration was determined from ferrous CO binding difference spectra using extinction coefficients of ε450–490 = 91 mM−1 cm−1 for cysteine-ligated P450BM322 and ε411–490 = 103 mM−1 cm−1 for serine ligated P411BM314. The in vivo P450 (or P411) concentration was determined by conducting the CO assay in the lysate of an aliquot of cells in the same cell density as used for the whole-cell reactions.
P450 expression and purification
For in vitro cyclopropanation reactions, P450BM3 variants were used in purified form. Enzyme batches were prepared as follows. One liter TBamp was inoculated with an overnight culture (100 mL, LBamp) of recombinant E. coli BL21(DE3) cells harboring a pCWori plasmid encoding the P450 variant under the control of the tac promoter. After 3.5 h of incubation at 37 °C and 250 rpm shaking (OD600 ca. 1.8), the incubation temperature was reduced to 25 °C (30 min), and the cultures were induced by adding IPTG to a final concentration of 0.5 mM. The cultures were allowed to continue for another 24 hours at this temperature. After harvesting the cells by centrifugation (4 °C, 15 min, 3,000 × g), the cell pellet was stored at −20 °C until further use but at least for 2 h. The cell pellet was resuspended in 25 mM Tris.HCl buffer (pH 7.5 at 25 °C) and cells were lysed by sonication (2×1 min, output control 5, 50% duty cycle; Sonicator, Heat Systems—Ultrasonic, Inc.). Cell debris was removed by centrifugation for 20 min at 4 °C and 27,000 × g and the supernatant was subjected to anion exchange chromatography on a Q Sepharose column (HiTrapTM Q HP, GE Healthcare, Piscataway, NJ) using an AKTAxpress purifier FPLC system (GE healthcare). The P450 (or P411) was eluted from the Q column by running a gradient from 0 to 0.5 M NaCl over 10 column volumes. The P450 (or P411) fractions were collected and concentrated using a 30 kDa molecular weight cutoff centrifugal filter and buffer-exchanged with 0.1 M phosphate buffer (pH = 8.0). The purified protein was flash-frozen on dry ice and stored at −20 °C.
For crystallization experiments, a two-step purification was performed using the AKTAxpress purifier FPLC system. Frozen cell pellets containing expressed, 6XHis tagged heme domains were resuspended in Ni-NTA buffer A (25 mM Tris.HCl, 200 mM NaCl, 25 mM imidazole, pH 8.0, 0.5 mL/gcw) and lysed by sonication (2×1 min, output control 5, 50% duty cycle). The lysate was centrifuged at 27,000 × g for 20 min at 4 °C to remove cell debris. The collected supernatant was first subjected to a Ni-NTA chromatography step using a Ni sepharose column (HisTrap-HP, GE healthcare, Piscataway, NJ). The P450 (or P411) was eluted from the Ni sepharose column using 25 mM Tris.HCl, 200 mM NaCl, 300 mM imidazole, pH 8.0. Ni-purified protein was buffer exchanged into 25 mM Tris.HCl pH 7.5 using a 30 kDa molecular weight cutoff centrifugal filter and subsequently loaded onto a Q sepharose column (HiTrapTM Q HP, GE healthcare, Piscataway, NJ) and purified to homogeneity by anion exchange. The P450 (or P411) was eluted from the Q column by running a gradient from 0 to 0.5 M NaCl over 10 column volumes. P450 (or P411) fractions were collected and buffer exchanged into 25 mM Tris.HCl pH 7.5, 25 mM NaCl. The purified protein was concentrated with a 30 kDa molecular weight cut-off centrifugal filter to approximately 10 mg mL−1. Aliquots (50 μL) were flash frozen on dry ice and stored at −80 °C until needed.
Mutations in cyclopropanation catalysts are reported with respect to wild-type P450BM3. The heme domain comprises the first 462 amino acids in the P450BM3 sequence. P411BM3 = P450BM3 + C400S. P450BM3-CIS = P450BM3 + V78A, F87V, P142S, T175I, A184V, S226R, H236Q, E252G, T268A A290V, L353V, I366V, E442K. P411BM3-CIS = P450BM3-CIS + C400S.
Protein crystallography
P450BM3-heme-CIS and P411BM3-heme-CIS were crystallized by vapor diffusion. A 1:1 mixture of protein stock (10 mg/mL in 25 mM Tris.HCl pH 7.5, 25 mM NaCl) and mother liquor was combined in 24 well sitting drop plates (Hampton Research). Optimal crystallization conditions for P450BM3-heme-CIS were found in 0.1 M sodium cacadolyte, pH 5.7, 0.14 MgCl2 and 17 % PEG 3350. P450BM3-heme-CIS crystals typically grew over a span of 7 – 14 days. P411BM3-heme-CIS crystals optimally formed in 0.1 M Bis-Tris, pH 5.3, 0.2 M sodium formate and 18% PEG 3350. Initial P411BM3-heme-CIS drops are marked with a dense layer of protein precipitate; however, after 36 – 48 hours, noticeable protein crystals were observed underneath the precipitate layer.
X-ray data collection and protein structure determination
X-ray diffraction data were collected at the General Medical Sciences and Cancer Institutes Structural Biology Facility (GM/CA) at the Advanced Photon Source (APS, Argonne National Laboratory) using beamline ID23-D and a MAR300 CCD detector. Data were collected at 100K and a wavelength of 1.033 Å. Data collections statistics are listed in Supplementary Table 2. Diffraction datasets were integrated with XDS23 and scaled using SCALA24. Initial phases were determined by molecular replacement against the closed form of wild type P450BM3-heme structure taken from PDB 1JPZ25, chain B using MOLREP software26, a component of the CCP4 crystallography software suite27. Refinement was accomplished by iterative cycles of manual model building within COOT28 and automated refinement using REFMAC29 within CCP4. Final cycles of REFMAC refinement included TLS parameters. Non-crystallographic symmetry constraints were not used during refinement. Model quality was assessed using the ‘complete validation’ tool inside of the PHENIX software suite30. Simulated annealing omit maps were also calculated using Phenix. Ramachandran outliers generally lie in poorly structured loops connecting P450BM3-heme F and G helices. These residues are often missing or marked by poor density in these and other P450BM3-heme structures within the protein database. All protein structure figures and alignments were generated using PyMol software (The PyMOL Molecular Graphics System, Version 1.3, Schrödinger, LLC.).
Potentiometric titrations
Enzyme samples were buffer-exchanged into 100 mM KPO4, 100 mM KCl, pH 7.4, and deoxygenated via 4 × 20 gentle pump-backfill cycles with argon, with care taken to avoid bubbling. Potentiometric redox titrations were performed in an anaerobic glove box, using a quartz spectroelectrochemical cell with path length of 1 mm, platinum mesh working electrode, platinum wire counter electrode, and a Ag/AgCl electrode (Bioanalytical Systems, Inc.) was used as the reference (Ag/AgCl vs NHE: +197 mV). Protein solutions consisted of approximately 600 μL of 50–100 μM protein with the following mediators added to ensure electrochemical communication between the protein and electrode: methyl viologen (5 μM), benzyl viologen (10 μM) and 2-hydroxy-1,4-napthaquinone (20 μM). Enzyme samples were titrated using sodium dithionite (reduction) and potassium ferricyanide (re-oxidation). The open circuit potential (OCP) of the cell was monitored (WaveNow potentiostat, Pine Research Instrumentation) over a 10 minute equilibration period, and spectra were recorded using a Ocean Optics spectrometer (USB2000+). The reduction potentials (E°′) were determined by fitting the data to the one-electron Nernst equation, E′(cell)=E0′−0.59*log([FeII]/[FeIII]), where the only adjustable parameter is E0′. Each point on a titration curve corresponds to the measurement from a single titration; coarse titrations were repeated for the enzymes: P450BM3, and P411BM3-CIS with nearly identical results. Estimated error for each OCP is less than 15 mV, based on the average drift in OCP measured at 600 points over 10 minutes. For measurements where the drift over 10 minutes exceeded 15 mV, the OCP was monitored for an additional 5 min or until the potential stabilized. Estimated error for each %FeII is approximately 3% based on the average variation between %FeII determined at 2–4 different wavelengths. All titration points were fit to a single one-electron Nernst curve.
Typical procedure for in vitro small-scale cyclopropanation bioconversions under anaerobic conditions
Small-scale reactions (400 μL) were conducted in 2 mL crimp vials (Agilent Technologies, San Diego, CA). P450 solution (80 μL, 100 μM) was added to the vial with a small stir bar before crimp sealing with a silicone septum. Phosphate buffer (260 μL, 0.1 M, pH = 8.0) and 40 μL of a solution of the reductant (100 mM Na2S2O4, or 20 mM NADPH) were combined in a larger crimp-sealed vial and degassed by bubbling argon through the solution for at least 5 min. In the meantime, the headspace of the 2 mL reaction vial with the P450 (or P411) solution was made anaerobic by flushing argon over the protein solution (with no bubbling). When multiple reactions were conducted in parallel, up to 8 reaction vials were degassed in series via cannulae. The buffer/reductant solution (300 μL) was syringed into the reaction vial, while under argon. The gas lines were disconnected from the reaction vial before placing the vials on a plate stirrer. A 40× styrene solution in MeOH (10 μL, typically 1.2 M) was added to the reaction vial via a glass syringe, and left to stir for about 30 s. A 40× EDA solution in MeOH was then added (10 μL, typically 400 mM) and the reaction was left stirring for the appropriate time. The final concentrations of the reagents were typically: 30 mM styrene, 10 mM EDA, 10 mM Na2S2O4, 20 μM P450. The reaction was quenched by adding 30 μL HCl (3M) via syringe to the sealed reaction vial. The vials were opened and 20 μL internal standard (20 mM 2-phenylethanol in MeOH) was added followed by 1 mL ethyl acetate. This mixture was transferred to a 1.8 mL Eppendorf tube which was vortexed and centrifuged (16,000×g, 1 min). The top organic layer was dried over an anhydrous sodium sulfate plug and analyzed by chiral phase GC.
Determination of initial rates
A slightly modified work-up was implemented for kinetic experiments. The reactions were quenched after the set time by syringing 1 mL EtOAc to the closed vials and immediately vortexing the mixture. The vials were then opened and 20 μL internal standard was added. The mixture was transferred to a 1.8 mL Eppendorf tube, vortexed and centrifuged (16,000×g, 1 min). The top organic layer was dried over an anhydrous sodium sulfate plug and analyzed by GC. Both styrene and EDA concentrations were varied in the presence of the enzymes expressed as the heme-domain (0.5 or 1.0 μM P450BM3-CISheme). Reactions were set up in phosphate buffer (pH = 8.0) with Na2S2O4 as the reductant at 25 °C, and were worked-up as described above. Three time points were taken and used to determine the rate of product formation by GC (cyclosil-B 30 m × 0.32 mm × 0.25 μm): oven temperature = 100 °C 5 min, 5 °C/min to 200 °C, 20 °C/min to 250 °C, 250 °C for 5 min. Elution time: cis-cyclopropanes (19.20 min and 19.33 min), trans-cyclopropanes (20.44 min). Apparent kinetic constants were determined by fitting the data to the standard Michaelis-Menten model.
Media and cell cultures for in vivo cyclopropanation
E. coli [BL21(DE3)] cells were grown from glycerol stock overnight (37 °C, 250 rpm) in 5 ml M9Y medium [1 L of 5× M9 medium contains 31 g Na2HPO4, 15 g KH2PO4, 2.5 g NaCl, 5.0 g NH4Cl, 0.24 g MgSO4, and 0.01 g CaCl2. 1 L M9Y contains 200 mL 5× M9, 800 mL deionized water, 15 g yeast extract, 1 mL micronutrients, and 0.1 mg mL−1 ampicillin). The pre-culture was used to inoculate 45 mL of M9Y medium in a 125 mL Erlenmeyer flask and this culture was incubated at 37 °C, 250 rpm for 2 h and 30 min. At OD600 = 1.2, the cultures were cooled to 25 °C and the shaking was reduced to 160 rpm before inducing with IPTG (0.25 mM) and δ-aminolevulinic acid (0.25 mM). Cultures were harvested after 20 h and resuspended (OD600 = 30) in nitrogen-free M9 medium (1 L: 31 g Na2HPO4, 15 g KH2PO4, 2.5 g NaCl, 0.24 g MgSO4, 0.01 g CaCl2, 1 mL micronutrients). The micronutrient solution contains 0.15 mM (NH4)6Mo7O24, 20.0 mM H3BO3, 1.5 mM CoCl2, 0.5 mM CuSO4, 4.0 mM MnCl2, and 0.5 mM ZnSO4. Aliquots of the cell suspension were used for determination of the cell dry weight (cdw, 2 mL) and P450 (or P411) expression level (3 mL).
Small-scale whole-cell bioconversions
Reaction conditions were as follows: 2 eq styrene, 1 eq EDA, 0.2 eq glucose, E. coli whole-cells in aqueous nitrogen-free M9 minimal medium and 5% MeOH cosolvent under anaerobic conditions for twelve hours at 25 °C. E. coli cells (OD600 = 30, 425 μL) were made anaerobic by bubbling argon through the cell suspension in a crimped 2 mL vial. A degassed solution of glucose (50 μL, 20 mM) was added to the cells before adding EDA (12.5 μL of a 400 mM solution in MeOH) and olefin (12.5 μL of a 800 mM solution in MeOH). The reactions were stirred at room temperature for the appropriate and were worked up by adding 20 μL of the internal standard (20 mM 2-phenylethanol) and extracting with 1 mL ethyl acetate. The organic layer was dried over Na2SO4 before analyzing the product mixture by chiral phase GC. Yields, diastereomeric ratios, and enantiomeric excess were determined by GC analysis. Yields based on EDA.
Preparative-scale whole-cell bioconversions
E. coli [BL21(DE3)] cells were grown from glycerol stock overnight (37 °C, 250 rpm) in 50 ml M9Y medium. The pre-culture was used to inoculate two 475 mL of M9Y medium in two 1 L Erlenmeyer flask (using 25 mL each) and this culture was incubated at 37 °C, 250 rpm for 2 h and 30 min. At OD600 = 1.8, the cultures were cooled to 25 °C and the shaking was reduced to 150 rpm before inducing with IPTG (0.25 mM) and δ-aminolevulinic acid (0.25 mM). Cultures were harvested after 24 h and resuspended (OD600 = 75) in nitrogen-free M9 medium. E. coli cells (OD600 = 70, 53.6 mL) were made anaerobic by bubbling argon through the cell suspension in a 500 mL sealed round bottom flask. A degassed solution of glucose (1.4 mL, 500 mM) was added to the cells before adding EDA (1.36 mL, 85% EDA in DCM as packaged by Sigma Aldrich) and styrene (2.5 mL, neat). The reaction was stirred at room temperature under positive argon pressure for 24 h. The crude mixture was poured into three 50 mL conical tubes and the reaction was quenched by the addition of HCl (1 mL, 3 M) to each tube. The aqueous mixtures were extracted with 1:1 EtOAc: hexanes (20 mL each) and centrifuged (5000 rpm, 5 min). The organics were collected and this extraction sequence was performed two more times. The organics were combined, dried over Na2SO4 then concentrated. Excess styrene was removed via azeotrope with H2O/benzene and 1.85 g of crude product was isolated. Cis/trans selectivity of the reaction was determined via gas chromatography of this crude mixture. Column chromatography of the crude product with 8% Et2O/hexanes afforded the desired products as a mixture of cis and trans isomers (1.63 g combined, 78% yield). Based on comparison of crude and purified yields, the crude product was approximately 88% pure. NMR of the isolated products were identical to those reported in the literature5.
Time course of in vivo and in vitro reactions
Following the procedure for small scale bioconversions, a series of in vivo and in vitro reactions were set up and EDA was added to each sample at time 0 hours. Time points were taken at 0.5, 1, 1.5, 2, 3, 4, 5, 6, 7, and 8 hours. Each reported yield reflects an average of two independent reactions that were allowed to stir for the indicated amount of time. The error bars shown reflect the two unaveraged data points. Yields of each reaction were determined by GC.
Thermostability measurements
Duplicate measurements were taken for all values reported in Supplementary Figure 12. Purified P450 (or P411) solutions (4 μM, 200 μL) were heated in a thermocycler (Eppendorf) over a range of temperatures (40–70 °C) for 10 min followed by rapid cooling to 4 °C for 1 min. The precipitate was removed by centrifugation. The concentration of folded P450 (or P411) remaining in the supernatant was measured by CO-difference spectroscopy. The temperature at which half of the protein was denatured (T50) was determined by fitting the data to the equation: .
Supplementary Material
Acknowledgments
This research is supported by the Gordon and Betty Moore Foundation through the Caltech Programmable Molecular Technology Initiative. EMB was supported by a Ruth M. Kirschstein National Institutes of Health (NIH) postdoctoral fellowship Award Number F32GM087102 from the National Institute of General Medical Sciences and a generous startup fund from UNC Chapel Hill. ZJW was supported by NIH 1F32EB015846-01. MEE was supported by NIH Grant RO1-DK019038. We thank Nikki Peck for help with preparative-scale experiments. We thank members of the Redinbo laboratory at UNC Chapel Hill for assistance with X-ray diffraction data collection. MEE thanks Dr. James D. Blakemore for electrodes and helpful discussions.
Footnotes
Competing financial interests: PSC, EMB, ZJW and FHA have filed through Caltech a provisional patent application that is based on results presented here.
Author Contributions
PSC, FHA and EMB conceived the project; PSC, EMB and ZJW designed the experiments; EMB and SB performed the crystallization experiments and solved the X-ray structures; MEE performed the redox titrations; PSC, ZJW and AAK performed the catalysis experiments; all authors discussed the results; PSC, EMB and FHA wrote the paper.
Accession codes: Atomic coordinates and structure factors have been deposited with the PDB (accession codes: 4H23 and 4H24)
References
- 1.Ajikumar PK, et al. Science. 2010;330:70–74. doi: 10.1126/science.1191652. [DOI] [PMC free article] [PubMed] [Google Scholar]
- 2.Westfall PJ, et al. Proc Natl Acad Sci USA. 2012;109:E111–E118. doi: 10.1073/pnas.1110740109. [DOI] [PMC free article] [PubMed] [Google Scholar]
- 3.Kataoka M, et al. Appl Microbiol Biotechnol. 2003;62:437–445. doi: 10.1007/s00253-003-1347-y. [DOI] [PubMed] [Google Scholar]
- 4.Boyce M, Bertozzi CR. Nature Methods. 2011;8:638–642. doi: 10.1038/nmeth.1657. [DOI] [PMC free article] [PubMed] [Google Scholar]
- 5.Coelho PS, Brustad EM, Kannan A, Arnold FH. Science. 2013;339:307–310. doi: 10.1126/science.1231434. [DOI] [PubMed] [Google Scholar]
- 6.Lebel H, Marcoux JF, Molinaro C, Charette AB. Chem Rev. 2003;103:977–1050. doi: 10.1021/cr010007e. [DOI] [PubMed] [Google Scholar]
- 7.Evans DA, Woerpel KA, Hinman MM, Faul MM. J Am Chem Soc. 1991;113:726–728. [Google Scholar]
- 8.Davies HML, Venkataramani C. Org Lett. 2003;5:1403–1406. doi: 10.1021/ol034002a. [DOI] [PubMed] [Google Scholar]
- 9.Maas G. Chem Soc Rev. 2004;33:183–190. doi: 10.1039/b309046a. [DOI] [PubMed] [Google Scholar]
- 10.Ost TWB, et al. Biochemistry. 2001;40:13421–13429. doi: 10.1021/bi010716m. [DOI] [PubMed] [Google Scholar]
- 11.Wuttke DS, Gray HB. Curr Opin Struct Biol. 1993;3:555–563. [Google Scholar]
- 12.Reedy CJ, Elvekrog MM, Gibney BR. Nucleic Acids Research. 2008;36:D307–D313. doi: 10.1093/nar/gkm814. [DOI] [PMC free article] [PubMed] [Google Scholar]
- 13.Dawson JH. Science. 1988;240:433–439. doi: 10.1126/science.3358128. [DOI] [PubMed] [Google Scholar]
- 14.Vatsis KP, Peng HM, Coon MJ. J Inorg Biochem. 2002;91:542–553. doi: 10.1016/s0162-0134(02)00438-5. [DOI] [PubMed] [Google Scholar]
- 15.Wolf JR, Hamaker CG, Djukic JP, Kodadek T, Woo LK. J Am Chem Soc. 1995;117:9194–9199. [Google Scholar]
- 16.Perera R, Sono M, Voegtle HL, Dawson JH. Arch Bioch Bioph. 2011;507:119–125. doi: 10.1016/j.abb.2010.12.010. [DOI] [PMC free article] [PubMed] [Google Scholar]
- 17.Dunford AJ, Girvan HM, Scrutton NS, Munro AW. Biochim Bioph Acta, Proteins and Proteomics. 2009;1794:1181–1189. doi: 10.1016/j.bbapap.2009.03.014. [DOI] [PubMed] [Google Scholar]
- 18.Wessjohann LA, Brandt W, Thiemann T. Chem Rev. 2003;103:1625–1647. doi: 10.1021/cr0100188. [DOI] [PubMed] [Google Scholar]
- 19.Penoni A, et al. Eur J Inorg Chem. 2003:1452–1460. [Google Scholar]
- 20.Watanabe N, Matsuda H, Kuribayashi H, Hashimoto S-i. Heterocycles. 1996;42:537–542. [Google Scholar]
- 21.Sambrook J, Frisch E, Maniatis T. Molecular cloning: a laboratory manual. Vol. 2. Cold Spring Harbor Laboratory Press; New York: 1989. [Google Scholar]
- 22.Omura T, Sato R. J Biol Chem. 1964;239:2370–2378. [PubMed] [Google Scholar]
- 23.Kabsch W. Acta Crystallogr, Sect D: Biol Crystallogr D. 2010;66:133–144. doi: 10.1107/S0907444909047374. [DOI] [PMC free article] [PubMed] [Google Scholar]
- 24.Evans P. Acta Crystallogr, Sect D: Biol Crystallogr D. 2006;62:72–82. doi: 10.1107/S0907444905036693. [DOI] [PubMed] [Google Scholar]
- 25.Haines DC, Tomchick DR, Machius M, Peterson JA. Biochemistry. 2001;40:13456–13465. doi: 10.1021/bi011197q. [DOI] [PubMed] [Google Scholar]
- 26.Vagin A, Teplyakov A. Journal of Applied Crystallography. 1997;30:1022–1025. [Google Scholar]
- 27.Bailey S. Acta Crystallogr, Sect D: Biol Crystallogr D. 1994;50:760–763. doi: 10.1107/S0907444994003112. [DOI] [PubMed] [Google Scholar]
- 28.Emsley P, Cowtan K. Acta Crystallogr, Sect D: Biol Crystallogr D. 2004;60:2126–2132. doi: 10.1107/S0907444904019158. [DOI] [PubMed] [Google Scholar]
- 29.Murshudov GN, Vagin AA, Dodson EJ. Acta Crystallogr, Sect D: Biol Crystallogr D. 1997;53:240–255. doi: 10.1107/S0907444996012255. [DOI] [PubMed] [Google Scholar]
- 30.Adams PD, et al. Acta Crystallogr, Sect D: Biol Crystallogr D. 2010;66:213–221. doi: 10.1107/S0907444909052925. [DOI] [PMC free article] [PubMed] [Google Scholar]
Associated Data
This section collects any data citations, data availability statements, or supplementary materials included in this article.