Abstract
The Human Connectome Project (HCP) is a collaborative 5-year effort to map human brain connections and their variability in healthy adults. A consortium of HCP investigators will study a population of 1200 healthy adults using multiple imaging modalities, along with extensive behavioral and genetic data. In this overview, we focus on diffusion MRI (dMRI) and the structural connectivity aspect of the project. We present recent advances in acquisition and processing that allow us to obtain very high-quality in-vivo MRI data, while enabling scanning of a very large number of subjects. These advances result from 2 years of intensive efforts in optimising many aspects of data acquisition and processing during the piloting phase of the project. The data quality and methods described here are representative of the datasets and processing pipelines that will be made freely available to the community at quarterly intervals, beginning in 2013.
Introduction
Mapping brain connections at the systems-level scale is the principal goal of macro-connectomics (Behrens and Sporns, 2012). Advances in Magnetic Resonance Imaging (MRI) have revolutionised the field as both structural and functional large-scale connections can be probed and inferred from the data. For structural connectivity analysis, in particular, diffusion MRI (dMRI) and tractography algorithms (see (Behrens and Jbabdi, 2009) for a review) have allowed novel explorations of inter-regional pathways in the living brain.
It has been more than a decade since the development of the first tracking algorithms (Conturo et al., 1999; Mori et al., 1999; Basser et al., 2000). These approaches have demonstrated the power of tractography as an in-vivo, virtual “dissection” tool (Catani and Thiebaut de Schotten, 2008). Tractography can successfully localise fibre bundles within white matter and therefore allows the study of specific brain pathways. However, there are many limitations of current tractography approaches that may cause problems in using the technique for whole-brain connectomics. For example, it is not clear that tractography can provide quantitative measures of connections between grey matter brain regions (Jbabdi and Johansen-Berg, 2011). Ambiguities in mapping axonal patterns from the diffusion signal (Seunarine and Alexander, 2009) or biases from the spatial reconstruction of connections (Jbabdi and Johansen-Berg, 2011) may lead to false positive and/or false negative results.
Given that these errors are difficult to quantify, attempts to reduce them are crucial for the field and will benefit from higher-quality data to start with as well as better approaches to analyse the data. The Human Connectome Project (HCP) (Marcus et al., 2011; Van Essen et al., 2012; Van Essen et al., 2013b) represents an ambitious attempt towards these two aims. A large consortium of HCP investigators, led by Washington University and the University of Minnesota (the “WU-Minn” consortium), with a major contribution from the University of Oxford, is midway through a 5-year effort to provide data and analysis pipelines of very high quality for a large population of 1200 subjects, aiming to map the macroscopic connections of human brain and their variability in healthy adults.
The 1200 subjects (age range 22 to 35 years old, from ~400 families and including twins and their non-twin siblings) are being scanned using multiple imaging modalities, all acquired in the same MRI scanner (a modified Siemens Skyra 3T), along with extensive behavioral and genetic data (Van Essen et al., 2012; Van Essen et al., 2013b). The MR scans make use of advanced pulse sequences to acquire diffusion, resting-state functional and task-based functional MRI, along with T1 and T2-weighted anatomical scans. MEG and EEG will be acquired on a subset of 100 subjects and 200 subjects will be scanned at 7T.
A growing number of projects are carrying out large-scale brain MRI on different populations. Some examples include the Thousand Functional Connectomes project (http://fcon_1000.projects.nitrc.org); the Alzheimer's Disease Neuroimaging Initiative (http://www.adni-info.org/); the AGES Reykjavik Study of Healthy Aging (http://www.hjarta.is/english/ages); and the Rotterdam study of aging (http://www.epib.nl/research/ergo.htm). In comparison, the HCP is unique in terms of the diversity of imaging modalities and the richness of the behavioral and genetic information to be collected. It is also unique because it has undertaken major improvements in methodology and instrumentation in order to significantly advance the quality of data acquisition techniques (Smith et al., 2013; Ugurbil et al., 2013) and processing protocols (Glasser et al., 2013) for brain connectivity studies. In this overview, we focus on dMRI and the structural connectivity aspects of the HCP. We present recent advances that allow us to obtain very high-quality in-vivo MRI data, while achieving the aim of scanning a very large number of subjects. These advances result from 2 years of intensive efforts in dynamically optimising many aspects of data acquisition and processing during the pilot phase of the project. The data quality described here is representative of the datasets that will be released to the community at quarterly intervals, beginning in 2013.
Aspects of the Acquisition Protocol
A Siemens 3T Skyra system is being used to scan all 1200 subjects (started in August 2012). The scanner was highly modified to improve diffusion imaging, by including a Siemens SC72 gradient coil and stronger gradient power supply with maximum gradient amplitude Gmax of 100 mT/m (initially 70 mT/m and 84 mT/m in the pilot phase) for diffusion encoding. The minimum rise time is 11 ms for the gradient to reach its maximum 100 mT/m (i.e., maximum slew rate is ~ 91 mT/m/ms for diffusion encoding, empirically reduced due to cardiac stimulation limits from the maximum slew rate of 200 mT/m/ms for EPI imaging). The increased gradient strength is achieved using gradient amplifiers with higher current output adapted from a Siemens 1.5T Aera scanner (Van Essen et al., 2012; Ugurbil et al., 2013). High gradient amplitudes are beneficial for dMRI, as they allow shortening of the diffusion encoding period and the image echo time (TE), and thus increases in the signal-to-noise ratio (SNR) and decreases in the repetition time (TR). Furthermore, parallel receive is employed using a commercially available 32-channel coil (Siemens).
The final acquisition protocol was determined on the basis of extensive pilot scans. Characteristics that were systematically varied include radio frequency (RF) pulse shapes, RF timings, flip angles, partial Fourier factors, fat saturation options, T1 relaxation effects, phase encoding (PE) directions, monopolar and bipolar diffusion encodings, spatial resolution, multiband (MB) acceleration factors, in-plane accelerations, gradient nonlinearities, slice excitation orders, image reconstruction options, and q-space sampling schemes. In the following sections, we give an overview of some of these aspects and justifications for key decisions. Other articles in this special issue (Smith et al., 2013; Ugurbil et al., 2013) discuss other aspects of pulse sequence and acquisition related issues for the WU-Minn HCP, not only for diffusion, but also for functional MRI.
Accelerated Imaging
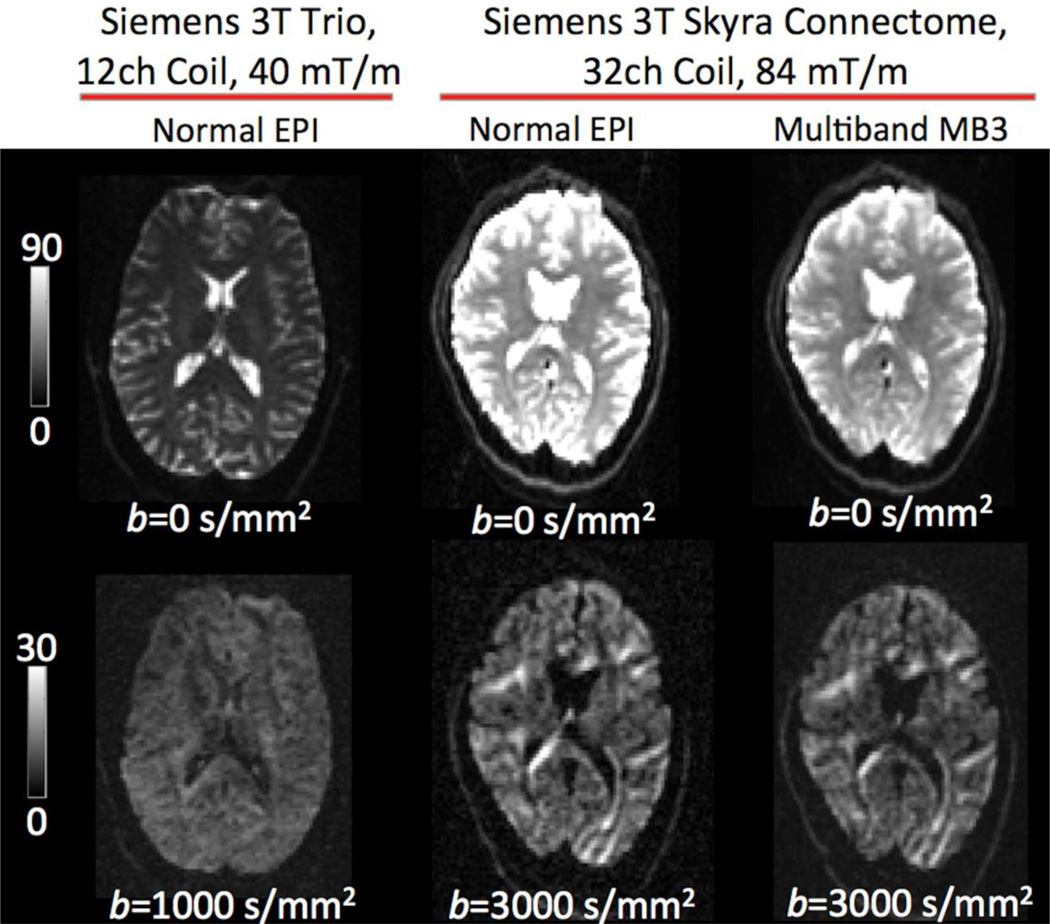
A major feature of the acquisition protocol involves acceleration using simultaneous multi-slice echo planar imaging (EPI) with multiband (MB) excitation and multiple receivers (Larkman et al., 2001; Feinberg et al., 2010; Moeller et al., 2010; Setsompop et al., 2012). For diffusion imaging, different brain slices are not just excited simultaneously, but also share diffusion preparation. The signal recorded from the different receivers is then a linear combination of the signals from the different slices. Using an initial measurement of the coil sensitivity profile of each receiver the signal from each slice can be separated. Simultaneous excitation of N slices therefore leads to an N-fold reduction in the TR and subsequent scanning time. More importantly, while slices are simultaneously excited, the k-space sampling is identical to a standard EPI readout, and, as such, there is no SNR loss due to reduced data collection (as for instance in parallel imaging with undersampling along the PE direction). There is, however, a small SNR penalty associated with slice aliasing (Moeller et al., 2010; Ugurbil et al., 2013), as well as T1 relaxation effects from the shorter achievable TRs, as illustrated in Figure 1. For the HCP, this SNR penalty is minimal due to performed pulse sequence modifications for controlled aliasing (Setsompop et al., 2012).
Figure 1.
Representative examples of dMRI with a Siemens Trio and the Connectome Skyra (not maximum gradient strength). Image intensities are in SNR units. Notice the increased SNR provided by the Connectome scanner (middle column), particularly for the diffusion-weighted volumes. In this example, the slightly reduced SNR in the multiband sequence is a consequence of T1 saturation effects due to the shortened TR, and not due to inherent SNR losses associated with multiband imaging (From left to right, echo and repetition times were: TE=94, 78, 78 ms and TR=9.3s, 7.8s, 2.6s, respectively). Data from the different scanners are from different subjects. Spatial resolution is 2 mm isotropic. No distortion correction has been performed.
Figure 1 illustrates the increased SNR the Connectome scanner provides compared to a more conventional 3T clinical imaging system (Trio, Siemens). Images have been reconstructed in SNR units (Kellman and McVeigh, 2005). The SNR of an HCP b=3000 s/mm2 dataset is comparable to the SNR of a b=1000 s/mm2 Trio acquisition. The mean SNR for an ROI in the midbody of the corpus callosum is 16.2 and 9 for the b=0 and b=1000 s/mm2 of the Trio scanner, 45 and 11.2 for the b=0 and b=3000 s/mm2 of the Connectome scanner (no MB) and 37 and 9.8 for the b=0 and b=3000 s/mm2 of the Connectome scanner (MB=3). These numbers are not representative of the final dMRI HCP protocol (which employs a different spatial resolution than the one used in this example), but illustrate the benefits of the Connectome scanner relative to a conventional system. Furthermore, the SNR drop for the MB3 case is mainly due to the low TR that has been employed here for illustrative purposes. In general, the SNR penalty is very small for a multiband acceleration factor of 3, which has very good noise amplification characteristics (g-factor slightly higher than 1) and induce minimal signal leakage amongst simultaneously acquired slices (L factor ~0.03) (Moeller et al., 2012). For a detailed discussion on the SNR benefits from the Connectome scanner and the SNR behavior of multiband imaging the reader is referred to (Ugurbil et al., 2013).
For diffusion imaging, we evaluated the benefits of collecting more diffusion data points (of slightly lower SNR), by acquiring data at different MB factors (1–3) and matching acquisitions for scanning time. MB3 scans (MB factor=3) were found to be superior when estimating fibre orientations, in terms of both estimation precision (uncertainty in the major fibre orientation in white matter was decreased by 34% compared to MB1, 100 diffusion gradient directions) and crossing fibre sensitivity (21% more three-way crossings detected in the centrum semiovale compared to MB1, when using multi-shell spherical deconvolution and automatic relevance determination for estimating fibre complexity (Jbabdi et al., 2012)).
One important decision of the HCP diffusion acquisition was to not use phase encoding accelerations. The decision was based on observations of degradation of the MB unaliasing algorithm, evidenced by large temporal signal fluctuations (especially around ventricles and basal slices) in dMRI images repeated over time, when slice accelerations were combined with in-plane phase-encode undersampling. These temporal instabilities are attributed to the effects of physiological processes on the unaliasing algorithm and were found to be amplified by diffusion encoding. A remedy to this problem is being investigated as part of the 7T HCP efforts (Ugurbil et al., 2013).
Gradient Nonlinearities
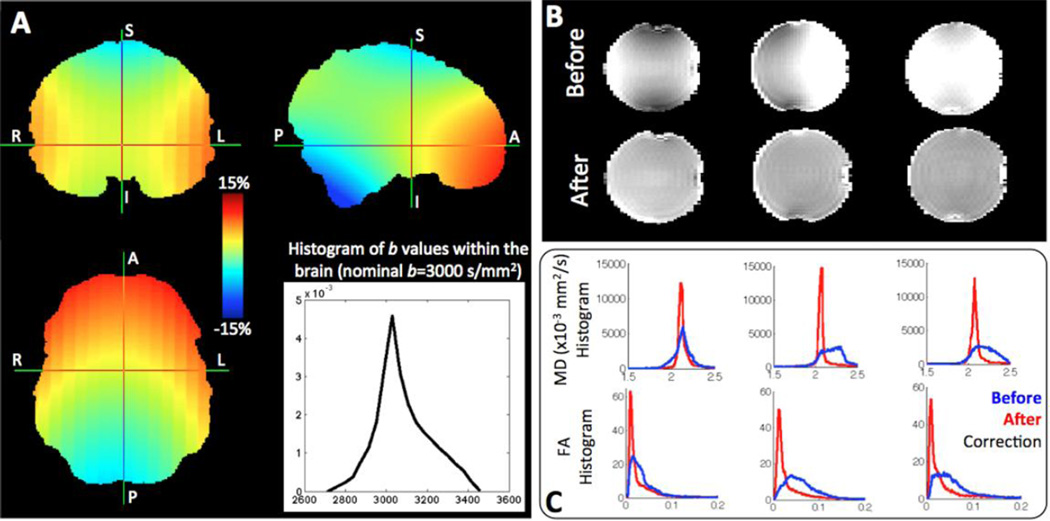
Spatial gradient nonlinearities are inevitable in modern gradient systems, especially for high performing gradients (Bammer et al., 2003). Due to the smaller clear bore size (56 cm) available within the customized SC72 gradient and associated subject positioning constraints (~ 5 cm above isocentre as a result of an elevated table for insertion into the smaller diameter clear bore), these nonlinearities are higher than in a standard 3T scanner. The gradient coil that is supposed to produce a linear gradient in one direction actually produces a nonlinear gradient from the isocentre. As a result, geometric distortions are generally induced in images. For dMRI, the nonlinearities also alter the strength and direction of diffusion-sensitising gradients from their intended values. As shown in Figure 2, the b values within the brain can deviate up to 15% from their nominal value (even more within the extended field of view). To compensate for these perturbations we utilise the procedure outlined in (Bammer et al., 2003) to obtain individual b values and gradient orientations for every voxel. We also correct for geometric distortions caused by the imaging gradients (Glasser et al., 2013). The mean diffusivity (MD) map of a pure water phantom becomes spatially uniform (Figure 2B) and the distributions of fractional anisotropies (FA) and MD values become narrower (Figure 2C), after performing these corrections.
Figure 2.
A) Spatial variations in the b value of a [1 0 0] gradient (intended b=3000 s/mm2), caused by the gradient nonlinearities. The color code represents variations in the order of ±15%. The histogram shows the distribution of the b values within the brain volume. B) Representative examples of mean diffusivity (MD) maps of a spherical water phantom (phantom diameter ~18 cm), before and after considering the gradient nonlinearities in the diffusion tensor estimation. The phantom is positioned at three different locations within the scanner (from left to right: at the isocentre, 6cm above and 6cm right to the isocentre) and scanned at b=400 s/mm2. C) For each of the phantom locations, histograms of the MD and Fractional Anisotropy (FA) values of the water phantom are shown, before (blue) and after correction (red) for gradient nonlinearities.
Q-space Sampling
There are various options for sampling the three-dimensional q-space for a given amount of scanning time. Measurements on a single sphere with high angular resolution (HARDI) (Tuch et al., 2002) have been the most common approach. Other options include sampling of multiple spheres (shells) (Assaf and Basser, 2005; Wu and Alexander, 2007) or of Cartesian grids (Wedeen et al., 2005). Given that Cartesian sampling can be closely approximated by a multiple-sphere scheme (Wu and Alexander, 2007), we focused our pilot scans on spherical sampling schemes for the WU-Minn HCP. Furthermore, we focused on schemes optimised for angular coverage, which is important for fibre orientation estimation and the connectome reconstruction; rather than considering more specialised schemes that are used, for instance, in microstructure imaging (Alexander et al., 2010).
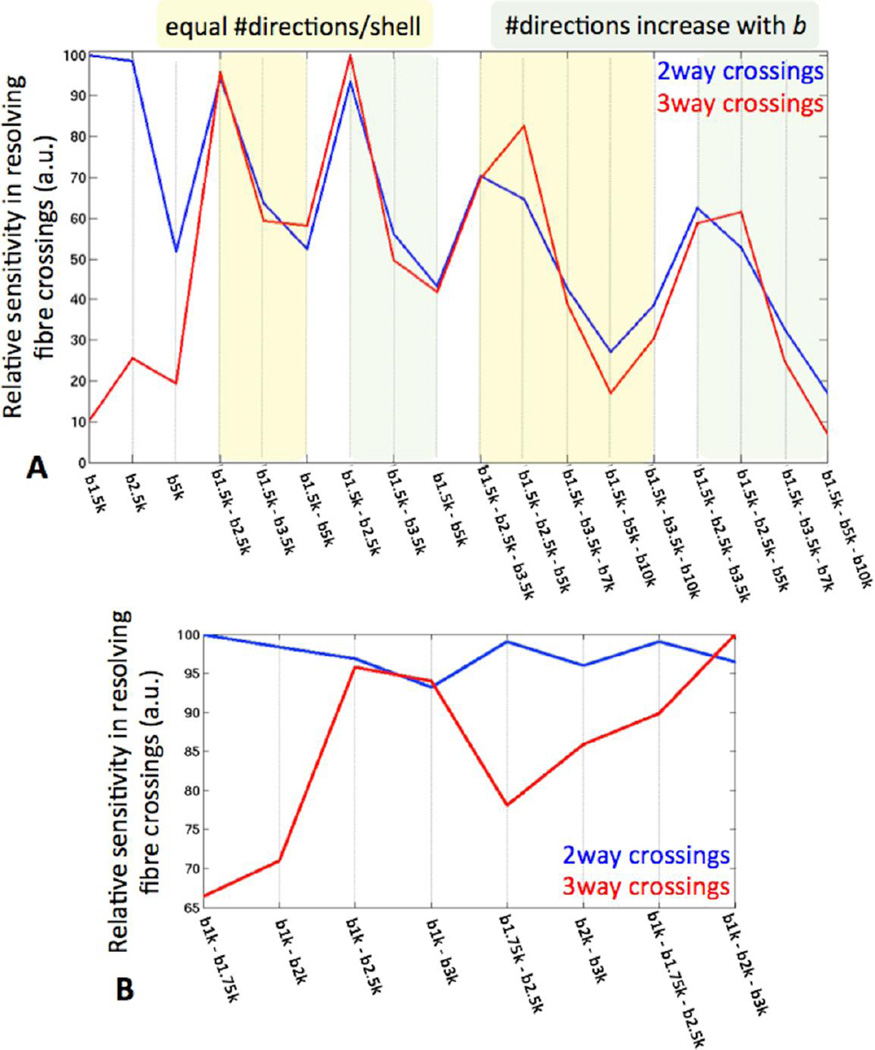
We compared different sampling protocols that were all matched for the number of acquired data points in q-space (i.e. roughly matched for acquisition time of 1 hour). Each protocol included 282 q-space points, distributed optimally in spherical shells (Caruyer et al., 2011) and acquired twice with reversed phase encoding direction in order to correct for image distortions (Andersson et al., 2003; Andersson et al., 2012). Comparisons were performed on the basis of sensitivity for detecting fibre crossings, the uncertainty in the estimated fibre orientations and subsequent tractography results (see next section). The piloting process included evaluation of many interim results, and the final decisions were made after multiple stages and in conjunction with decisions regarding spatial resolution (see next section). Figure 3A illustrates an initial comparison between various single-shell and multi-shell schemes. The comparison metric used in this example was the number of two and three-way fibre crossings resolved in the bilateral centrum semiovale, a region that is occupied mostly by near orthogonal crossings (Jakob, 1906; Fernandez-Miranda et al., 2008; Theodoridou and Triarhou, 2012). Parametric spherical deconvolution approaches (Behrens et al., 2007; Jbabdi et al., 2012) were used for fibre orientation estimation. Several conclusions can be drawn from this plot. First, multi-shell schemes and multi-shell spherical deconvolution have greater sensitivity in detecting fibre crossings (particularly three-way crossings) than single-shell schemes. Second, the best results for the trade-off between angular contrast and SNR occurred when all shells were below b=3500 s/mm2. Increasing the b value further (up to 10000 s/mm2) was detrimental rather than beneficial based on this analysis. This was also true for the orientation uncertainty in the corpus callosum that was minimum for all schemes that employed b values in the above regime. Obviously, the optimal b values and their optimal combination depend on the available SNR and the spatial resolution of the images (Kamath et al., 2012). The comparisons presented here are representative of the resolution chosen for the HCP datasets (1.25mm isotropic voxels). A final conclusion from this analysis is that increasing the number of data points with the b value in the multi-shell schemes (i.e. increasing points for the outer shells at the expense of reducing points for the inner shells) did not provide a clear benefit.
Figure 3.
Sensitivity of different q-space sampling schemes in resolving (two and three-way) crossing fibres within the centrum semiovale. The amount of crossings resolved by each scheme is normalised by the maximum. Fibre orientations are estimated using the ball & stick model (Behrens et al., 2007) for single-shell schemes and its extension (Jbabdi et al., 2012) for multi-shell protocols. A comparison between various single, two and three-shell combinations in the b=0–10,000 s/mm2 regime is shown in (A). Data for all compared schemes are from the same subject. Multi-shell protocols with the number of data points being constant across shells and protocols where the number of data points increases linearly with b value are included. A comparison between various multi-shell schemes in the more restricted b=0–3,000 s/mm2 regime is shown in (B). Data for all compared schemes are from the same subject. In both comparisons, protocols were matched for the total number of data points (282 points in q-space acquired twice) and spatial resolution (1.25 mm isotropic). Crossing detection is performed using a Bayesian automatic relevance determination (ARD) method (Behrens et al., 2007). To increase contrast in the differences between protocols a higher than normal ARD prior weight (w=10) has been employed.
Further comparisons were performed later in the piloting phase using data acquired with an upper limit of b=3000 s/mm2. Figure 3B shows an example of these comparisons, where, as before, all protocols were roughly matched for acquisition time. The number of directions per shell was kept the same within each multi-shell scheme. The main conclusion from this plot is that three shells perform better in resolving three-way fibre crossings than two shells, whilst having almost identical performance in detecting two-way crossings. By this criterion, the b=1000, 2000, 3000 s/mm2 scheme was the best and was therefore chosen for the final protocol. This was further verified through extensive numerical simulations using a different fiber orientation estimation technique (Kamath et al., 2012).
Another important decision is whether echo and repetition times should be kept constant across shells (at the values imposed by the outer shell) when a multi-shell scheme is employed. The advantages of optimising TE and TR individually for every shell are the increased SNR and the shorter scanning time for the inner shells. However, different TE and TR for each shell mean that relaxation effects need to be accounted for during analysis. Moreover, noise levels will be different for different shells. These factors would make fibre orientation estimation less straightforward and would lead to data that would not be directly usable by the majority of current processing techniques. Furthermore, for the b values of interest, the SNR benefit we observed for the innermost shell was in the order of 10%, which was not large enough to justify such a complication. We therefore matched all shells for TE and TR. Matching the TE and TR also allowed us to fully interleave shells during acquisition (Caruyer et al., 2011), which reduces gradient duty cycle and risks of gradient overheating.
The potential detrimental consequences of gradient heating were experimentally evaluated by running diffusion time series with repeated 1hr warming and cooling cycles at Gmax on each physical gradient axis (b=400 s/mm2 with minimum TE) with a water phantom positioned at isocenter or off-center locations. No undesired effects due to gradient heating were observed except for an expected small mean diffusivity (MD) value increase due to scanner bore temperature increases, which assured the hardware stability of the SC72 gradient under high duty cycle demand. However, even when realistic sequences of diffusion gradient orientations were used (even with interleaved shells), the gradient duty cycle, due to accumulated heating, could still limit the achievable minimal TR. The order of the diffusion gradient orientations in the final HCP dMRI protocol was therefore optimized by swapping adjacent orientations to reduce the auto-correlation (lag=1) of absolute gradient amplitude (~< 0.5) for each physical gradient axis.
Spatial Resolution
The choice of spatial resolution interacts strongly with the selection of q-space sampling schemes. In conjunction with the systematic comparisons of different q-space sampling approaches at a given spatial resolution, we used tractography results to evaluate datasets at different spatial resolutions. Compared datasets were all matched for acquisition time. The high spatial-resolution datasets were found to provide greater specificity and allowed reconstruction of certain tract features that were not observed when using the lower resolution ones; even if the latter had higher angular resolution.
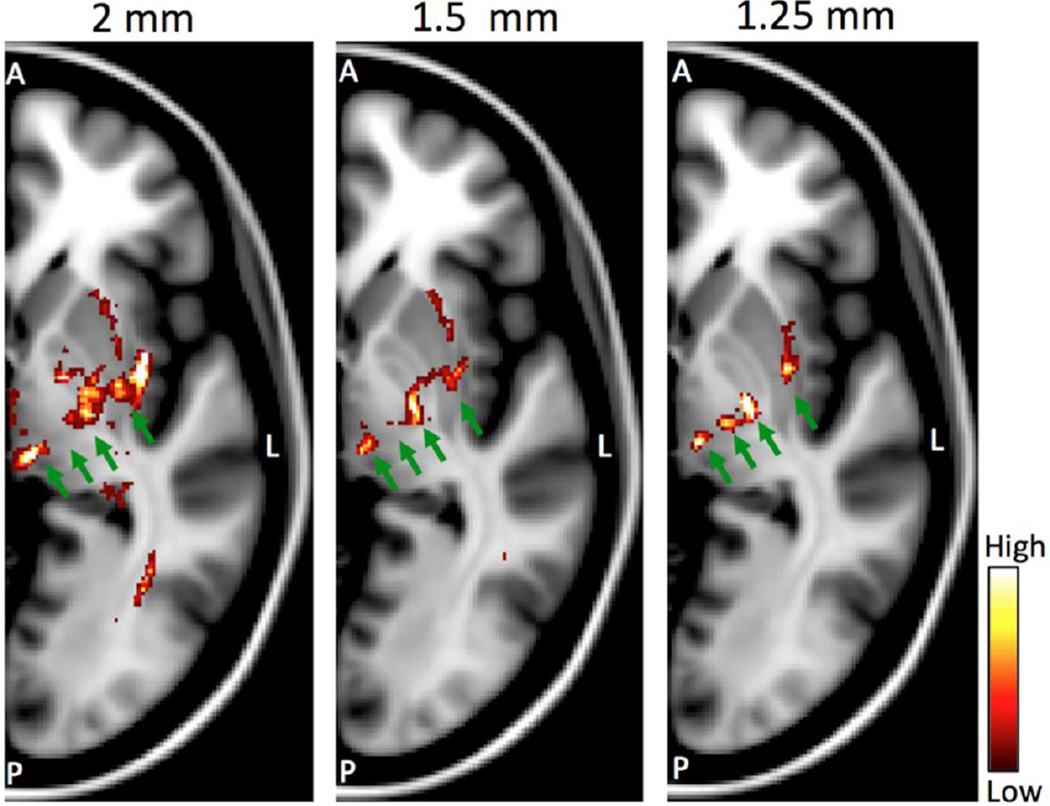
Figure 4 illustrates examples of the resolved tracts when seeding at the hand area of the left hemisphere, primary motor cortex and visualizing axial slices at the level of the thalamus. Probabilistic tractography was employed (Behrens et al., 2003; Parker and Alexander, 2003; Behrens et al., 2007) using the fibre orientation estimates obtained from multi-shell spherical deconvolution (Jbabdi et al., 2012). Histogram binning of each path’s spatial distribution was performed within the same reference space (MNI standard space) in all cases, so that the displayed probability values are comparable. We found that the specificity of pathways increased progressively with the spatial resolution of the scans. Four different paths are clearly evident in the highest resolution dataset (indicated by the green arrows), corresponding to cortical connections with the thalamus, brainstem, spinal cord and putamen. Some of these paths are evident with the other two datasets, however with less well-defined borders. The cortico-bulbar paths are clearly evident only with the 1.25mm dataset. Note that datasets are matched for acquisition time. Therefore, the 1.25mm data comprise of less dMRI volumes and they therefore result to higher uncertainty in the fibre orientation estimates.
Figure 4.
Probabilistic tractography results on axial slices at the level of the basal ganglia and the thalamus when seeding from the hand area of the primary motor cortex (left hemisphere). Each panel shows results for different spatial resolution (2mm, 1.5mm and 1.25mm isotropic). All datasets are matched for acquisition time. Color-coded path probability values are plotted on an axial slice in standard MNI space. The green arrows correspond from medial to lateral to: cortico-thalamic, cortico-bulbar, cortico-spinal and cortico-striatal projections. Images are shown in radiological view.
Similar comparisons were performed after reconstructing cortico-cortical, callosal connections and longitudinal association tracts. Due to the increased specificity offered by the high-resolution, we chose 1.25mm nominally “isotropic” spatial resolution for the HCP datasets.
In reality, the spatial resolution in an EPI acquisition is usually anisotropic with the slice thickness determined by the RF slice profile, the in-plane resolution determined by the finite sampling window, and in addition the resolution along the phase encoding direction deteriorates further due to the T2 and/or T2* decay during the EPI echo train; resulting in the most significant blurring along the phase encode direction. In-plane phase encode accelerations and/or partial Fourier could be used to reduce blurring and/or TE. As mentioned before, however, the combination of MB and in-plane acceleration leads to instabilities in the unaliasing algorithm due to physiological processes. We also evaluated aggressive partial Fourier factors (i.e. 5/8) with zero filling, which led to significant additional phase encoding blurring (Jesmanowicz et al., 1998), because of the imperfect high spatial frequency encoding during the T2* decay after the spin echo (Yablonskiy, 1998). The use of Margosian reconstruction instead of zero filling may reduce such blurring (McGibney et al., 1993), but has proven to be not robust against physiological variations during diffusion encoding (Robson and Porter, 2005).
Therefore, we chose a partial Fourier factor of 6/8 without in-plane acceleration, resulting in an EPI echo train length (ETL) of ~84ms for the final HCP dMRI protocol at 1.25mm resolution (as presented in detail in subsequent sections, a left-right phase encoding direction was employed). Additional blurring† (Rahmer et al., 2006) along the PE direction due to transverse relaxation in GM (T2/T2* ≈ 80/45ms) and WM (T2/T2* ≈ 110/45ms) is ~15% (Haacke et al., 1999; Wansapura et al., 1999), except in regions where the T2/T2*s are much shorter than average. Partial Fourier with zero filling was employed (zero filling is used instead of homodyne reconstruction or other partial Fourier reconstruction methods that use phase information due to its robustness against errors in phase estimation) and that also adds slightly more blurring in the PE direction. It was not beneficial to push the spatial resolution substantially higher (e.g. to 1.0mm voxels), mainly due to the forbidden echo spacing (0.82 – 1ms, as limited by the acoustic resonances of the SC72 gradients). Increasing the resolution to 1mm meant substantially longer readout durations (ETL ≈ 135ms at 1ms echo spacing) and subsequent additional blurring (~35% blurring for GM and WM).
Aspects of the Preprocessing Pipeline
Image Reconstruction
The method for combining information from different receivers to reconstruct magnitude images in multi-channel diffusion MRI can affect fibre orientation estimation and subsequently bias tractography results in two ways (Sotiropoulos et al., 2013c): (i) The signal can deviate from its Rician properties and parametric characterization of noise can become difficult. (ii) The noise floor can be highly elevated, therefore reducing the available dynamic range of the diffusion signal attenuation and restricting the highest (artifact-free) achievable b value and/or spatial resolution. For a root-sum-of-squares (RSoS) reconstruction, these effects increase with the number of receiver channels, and were significant in our case with 32 receiver channels. To minimise them, magnitude images in the HCP are reconstructed from the multiple channels using a sensitivity encoding (SENSE), R=1 approach (Lenglet et al., 2012; Sotiropoulos et al., 2013c). SENSE1 combines data from all channels into a single complex image, whose magnitude is subsequently computed. It therefore preserves the Rician properties and increases the dynamic range of the signal.
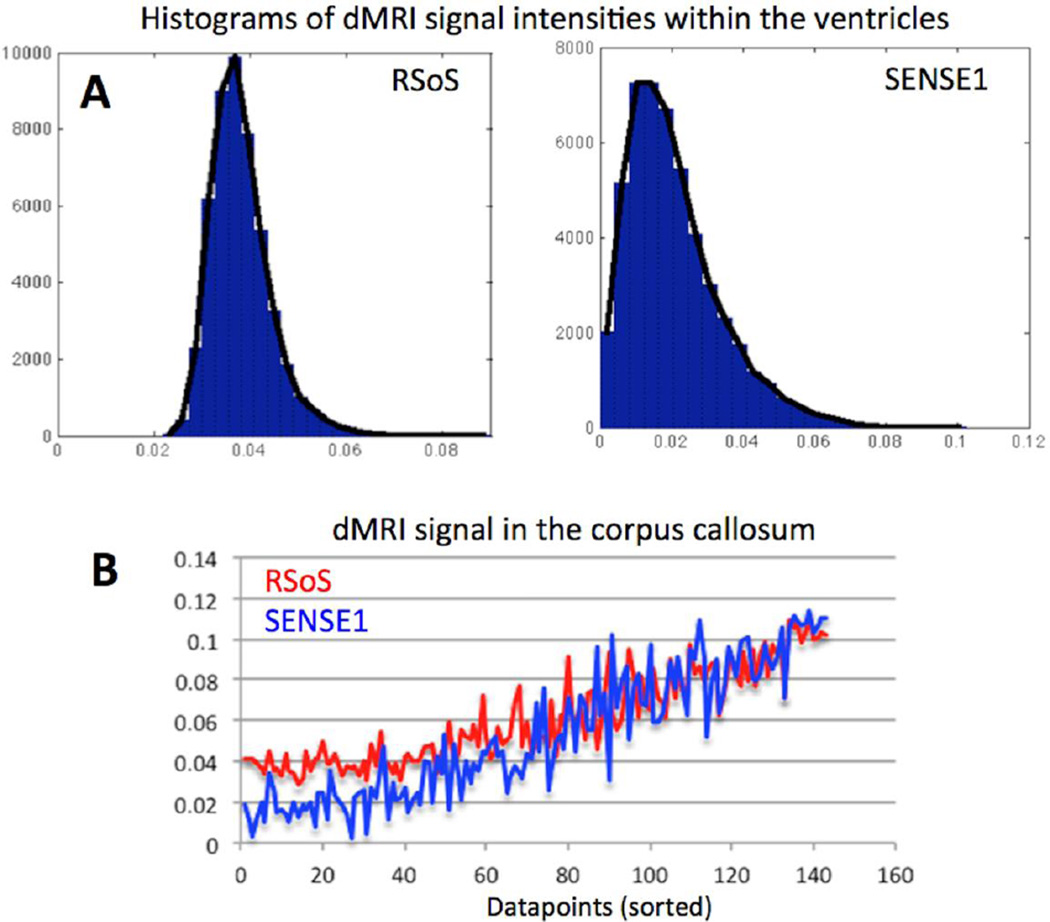
Figure 5 shows a comparison between the magnitude signal obtained using the commonly used RSoS vs the SENSE1 approach. The histograms in Figure 5A represent dMRI signal intensities (b=2000 s/mm2) from the CSF that are maximally attenuated and have reached the noise floor. The intensities for SENSE1 suggest a Rician distribution, while a different behavior (a non-central-χ distribution) is observed for RSoS (Constantinides et al., 1997; Sotiropoulos et al., 2013c). An effect of the non-central-χ distribution is the RSoS elevated noise floor that artificially increases the measured signal attenuation in many regions. Figure 5B shows dMRI intensities obtained from the same k-space data but different image reconstruction methods from a voxel at the midbody of the corpus callosum. The reduced dynamic range of the dMRI intensities with RSoS is evident compared to SENSE1. The RSoS intensities are artificially augmented, particular for measurements along the major fibre orientation, where maximum signal attenuation is expected. Such differences have been shown to affect fibre orientation estimation, using both model-free and model-based approaches (Sotiropoulos et al., 2013c).
Figure 5.
A) Histograms of dMRI signal intensities within the CSF (therefore maximally attenuated) for two different image reconstruction methods. The Root-Sum-of-Squares (RSoS) produces a signal that follows a non-central-chi distribution, whereas the SENSE1 approach results to a Rician distributed signal. B) Difference in the dynamic range of the signal produced by RSoS (red) and SENSE1 (blue). The signal from a voxel in the midbody of the corpus callosum is plotted. Data points are sorted according to the angular difference of the respective diffusion gradient direction with the major callosal fibre orientation (i.e. parallel to perpendicular to the main fibre orientation). The noise floor (the minimum measurable signal) is elevated with RSoS, which therefore rectifies measurements along the major fibre orientation in highly anisotropic regions.
Distortion Correction
EPI images are plagued by distortions caused by sensitivity to (even small) inhomogeneities of the magnetic field. Some inhomogeneities are caused by the object itself (susceptibility-induced distortions), and will hence (to a first approximation) remain constant for a particular subject. Another source of disturbance of the field involves lingering after-effects caused by the rapid switching of the diffusion gradients (eddy current-induced distortions), which cause unique distortions in each diffusion-weighted volume. The commonly-used registration-based methods for correcting eddy-current distortions (Haselgrove and Moore, 1996) can perform poorly, particularly for high b-values, because of the varying contrast in images acquired with different diffusion-sensitising gradients and the low SNR.
We have developed a model-based approach that simultaneously considers and corrects for all types of distortions, susceptibility and eddy-current induced, as well as for head motion. The distortion correction is based on the idea of manipulating the acquisitions so that a given field inhomogeneity manifests itself differently in different images (Andersson et al., 2003). One can then use a generative model to make predictions about what the 3D dMRI volumes should look like at every point in q-space given knowledge of the different distortions. Inversion of this model enables accurate estimation of the corrected data.
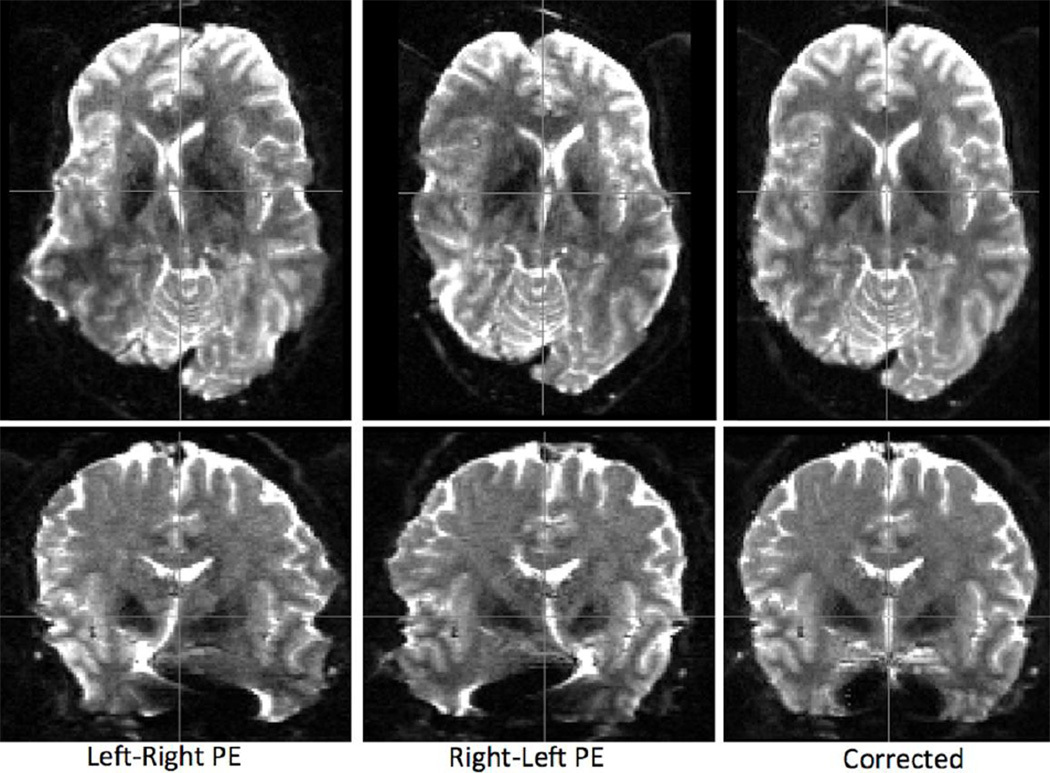
More specifically, the correction of susceptibility-induced distortion takes advantage of the complementary information included in pairs of diffusion images acquired with reversed phase-encoding (PE) directions. Reversing the PE direction flips the sign of susceptibility-induced distortions as well. Combining pairs of PE-reversed images, a susceptibility induced off-resonance field can be estimated. Applying this field a corrected image can be obtained (Andersson et al., 2003). Figure 6 shows an example of such a pair (axial and coronal views) and the corrected image for a typical HCP b=0 acquisition. However, in our distortion correction pipeline, application of the correction is postponed and the estimated off-resonance field is fed to the subsequent stage that estimates the eddy-current induced distortions.
Figure 6.
Correction of susceptibility-induced distortions using pairs of phase encoding (PE)-reversed b=0 images. Distortions flip sign when the PE direction is reversed. Using information from both images a distortion-free image can be obtained. Spatial resolution in this example is 1.25 mm isotropic. Axial (top) and coronal (bottom) views are presented.
For the correction of eddy-current distortions, we employ the complementary information in dMRI scans acquired with (nearly) opposing diffusion gradients (in fact we consider cones of opposing directions). These are expected to exhibit nearly opposite eddy current-induced distortions, however their susceptibility-induced distortions will be the same. We therefore utilise the susceptibility-induced off-resonance field, already calculated from b=0 pairs interspersed throughout the duration of the scan. This is then fed into a Gaussian Process (GP) predictor, which is used to additionally estimate the eddy-current induced field and the subject motion for each 3D dMRI volume.
The GP makes predictions of data for each volume in an “average” model space. The GP predictor captures how the signal co-varies as a function of distance in the spherical measurement space. We use the angle between the directions of the diffusion-sensitising gradients as the distance and model the signal covariance within a voxel using a function empirically derived from the data (Andersson et al., 2012). The covariance function is parameterised by two parameters, one describing the signal variance and another describing the noise variance (in the case of multi-shell data, there is one signal variance per shell and a common noise variance). These parameters are common to all voxels and are easily calculated for any dataset without the need for user intervention. The GP predicted signals for a dMRI volume are effectively weighted averages of all measurements. Due to the way data are acquired and as acquisitions with opposite distortion signs are performed, the GP averaging gives close to distortion-free (but blurred) predictions.
These predictions can be combined with the already obtained susceptibility-induced off-resonance field, a model of eddy-current-induced off-resonance field (quadratic spatial model used for the HCP), and a model of subject motion (rigid body transform). A prediction of the distorted data can be therefore made for each 3D volume and compared with the measurements, allowing inversion of the model and estimation of the eddy-current distortions and subject motion. In an iterative process, the estimates are refined; 4–5 iterations are normally enough to achieve convergence. Using these estimates, all types of distortion are eventually corrected in a single resampling step and spline interpolation.
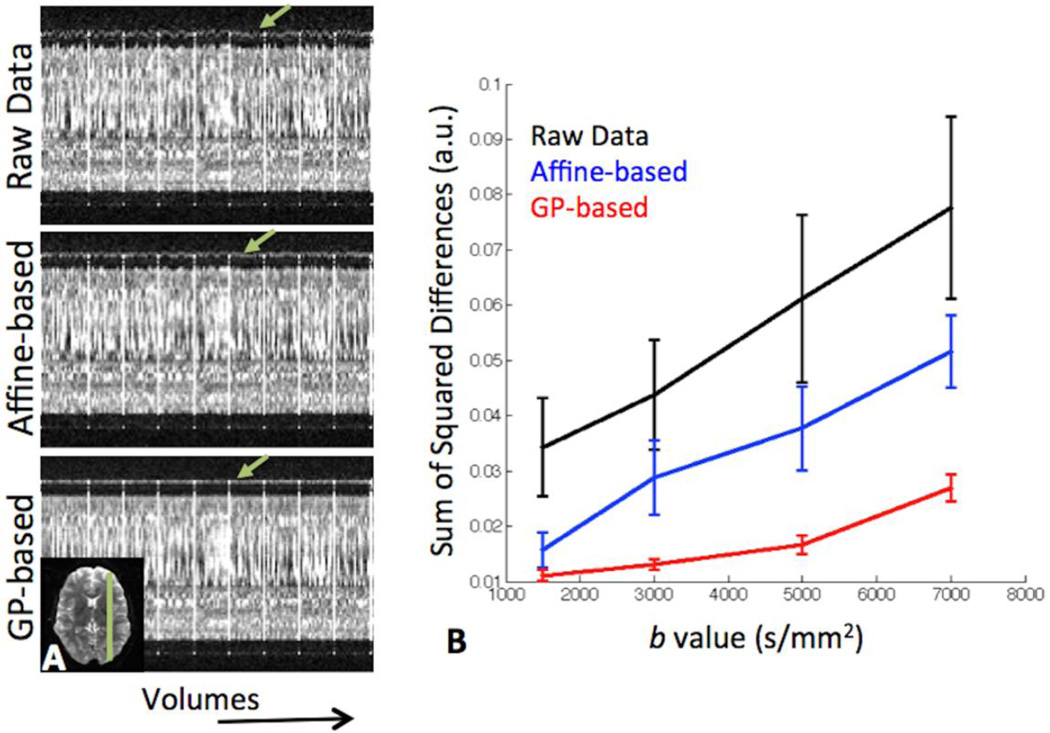
Figure 7 illustrates a comparison of the correction of eddy-currents achieved by a typical affine transformation-based correction method, as implemented in FMRIB’s software library (FSL) (Smith et al., 2004), and the GP approach (now available in FSL 5). A qualitative comparison is shown in 7A. An axial slice was selected (inset) and a 1D profile (green line in the inset) is shown as a function of diffusion volumes (i.e. acquisition time). Head motion and eddy current-induced distortions are evident in the raw data as noisy variations of the slice boundaries (green arrows). An affine-based correction improves the situation, but clearly performs much worse than the GP approach, which achieves a better registration between volumes. A more quantitative comparison is illustrated in Figure 7B. The raw data comprised of 150 dMRI volumes acquired with a left-right (LR) PE direction, followed by the same 150 diffusion-sensitising orientations acquired with a right-left (RL) PE direction. After correcting for susceptibility-induced distortions (Andersson et al., 2003), the sum of squared differences (SSD) of signal intensities for each LR/RL pair was calculated within the brain. The plot shows the mean and standard deviation of the SSDs across all 150 pairs and for different b values. As expected, increasing the b value poses a more difficult problem. However, it is clear that in all cases the GP-based approach substantially improves the similarity between volumes, which should be identical in an artifact and noise-free scenario.
Figure 7.
Comparison between correction methods for eddy current-induced distortions. A) One-dimensional profile (green line in the inset) across the different dMRI volumes (i.e. as a function of acquisition time). Artifacts are evident as variations of the slice boundaries (green arrows). The Gaussian Process (GP)-based approach achieves a better performance in registering all volumes compared to a commonly used affine transformation-based correction. The data are from a b=3000 s/mm2 acquisition. B) Mean and standard deviation of sum of squared differences (SSD) between image intensities across 150 pairs of dMRI volumes. DMRI volumes with LR phase encoding (PE) direction were followed by the same volumes acquired with RL PE direction. After correcting for susceptibility-induced distortions, the SSDs were obtained for all dMRI pairs. The data for each b value were normalised by the 95th percentile of all the raw dMRI signal intensities within the brain.
For the results presented in Figure 7B, the Gaussian process framework was applied individually in each of the above single-shell datasets. Given that the problem becomes more difficult as the b value increases, a better implementation would incorporate information from all shells (when this is available), to inform correction of the most challenging outer q-space shells with the more robust information obtained from the inner shells. This is indeed the approach that we utilise for the multi-shell HCP datasets; all shells are fed into a single distortion correction analysis and a different signal variance parameter is used for each shell in the GP predictor, as explained before.
The performance of the distortion correction pipeline was validated for different b-values (Figure 7B), but also both for different PE directions and distortion magnitudes (distortions changed using in-plane parallel imaging). The phase encoding direction was chosen to be left-right for the HCP datasets, rather than the commonly employed anterior-posterior direction. This allows an approximately 20% reduction in the echo time (TE) and thus a resultant SNR improvement.
Fibre Orientation Estimation
Several methods have been proposed for inferring the fibre orientation density function (fODF) from diffusion MRI, targeting either the fODF directly or approximations of it (Seunarine and Alexander, 2009). The underlying idea for the former group of methods is that the measured signal S can be considered as the spherical convolution of the fODF F and an impulse response function R, i.e. S(θ, φ)=F(θ, φ) ⊗ R(θ, φ), where θ and φ are the inclination and azimuth angles on the sphere. Estimating F is a deconvolution operation (Behrens et al., 2003; Tournier et al., 2004; Alexander, 2005; Anderson, 2005; Dell'Acqua et al., 2007; Kaden et al., 2007; Sotiropoulos et al., 2012; Zhang et al., 2012). Deconvolution methods differ in the way they represent F (parametrically or non-parametrically, e.g. using some basis functions) and treat R (measure or explicitly model it).
One simple, yet powerful, parametric deconvolution method is the ball & stick model (Behrens et al., 2003; Behrens et al., 2007). The function F is parameterised as a sum of delta functions on the sphere, and the response R is modeled as a “stick” kernel (i.e. diffusion occurs freely only along a certain fibre orientation (θ, φ)). Other diffusion effects and partial volume is captured though a “ball” (isotropic) compartment. Despite the success of the ball & stick model in resolving fibre crossings in HARDI datasets (Behrens et al., 2007), the employed kernel R can capture only mono-exponential decay of the signal in q-space. Therefore, it is not appropriate for multi-shell data, as shown in (Jbabdi et al., 2012).
We have developed a parametric deconvolution extension of the ball & stick model that is especially appropriate for multi-shell datasets (Jbabdi et al., 2012). We modified the single-fibre kernel R to represent the signal arising from a distribution of diffusivities within a voxel, rather than a single diffusivity. Using a Gamma distribution of diffusivities allows an analytic parametric expression to be obtained. The new kernel R now supports multi-exponential decay in q-space. It is also a phenomenological model that can capture effects from multiple diffusion compartments and/or partial volume in a more flexible way than the simpler stick kernel.
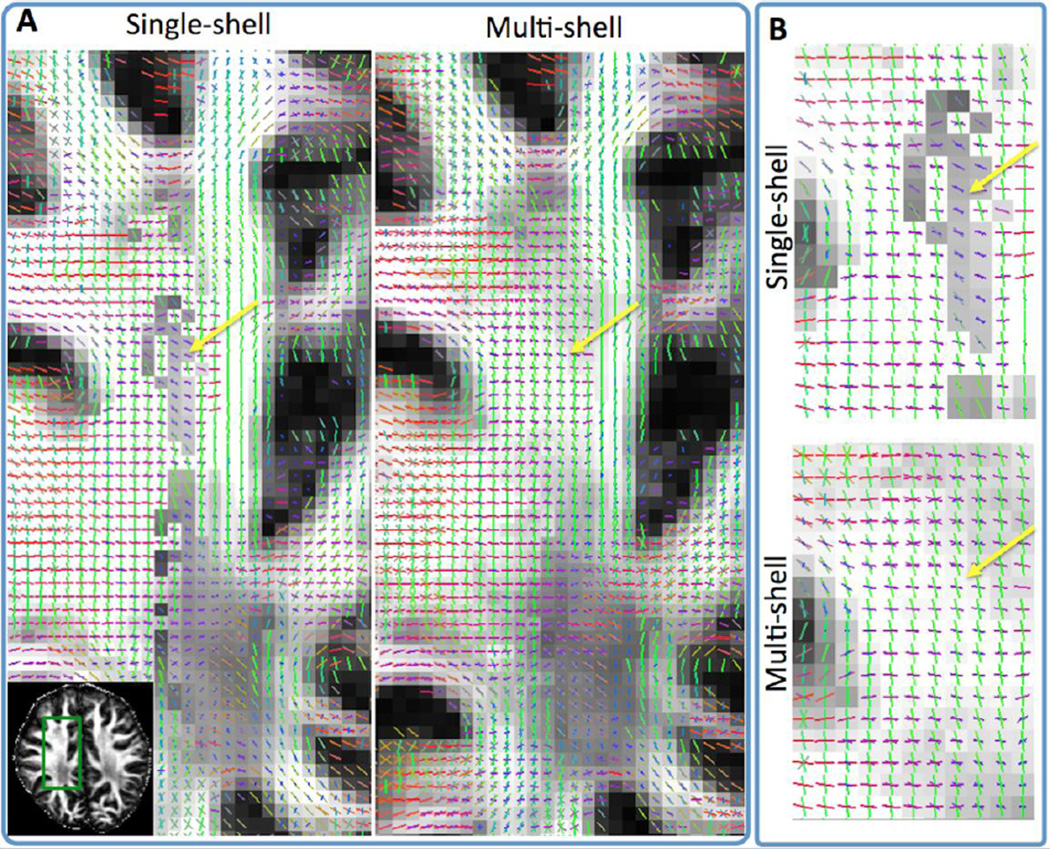
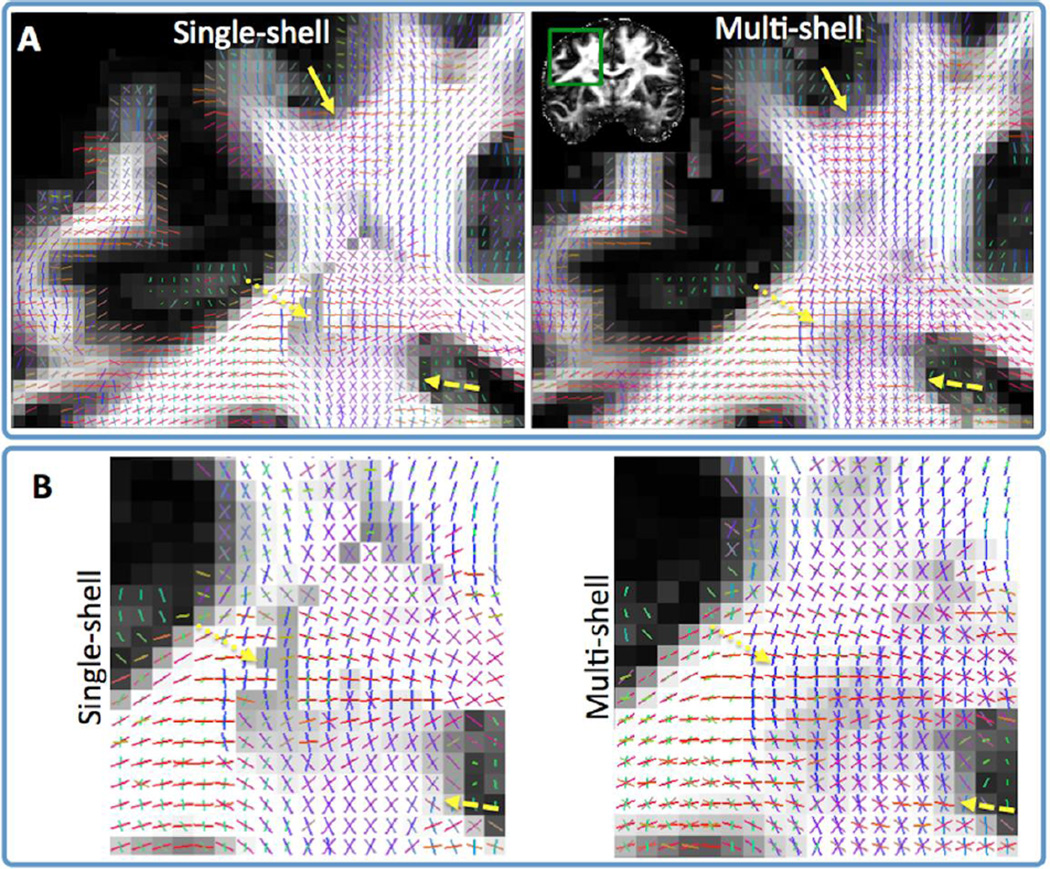
The difference in crossing-fibre sensitivity between single and multi-shell parametric spherical deconvolution has been illustrated in Figure 3A. Figures 8 and 9 further highlights this difference. Figure 8 shows the better sensitivity of the multi-shell approach in detecting crossings at the centrum semiovale. Note for instance the more continuous anterior-posterior orientations (green vectors, close to yellow arrows) that are resolved using the multi-shell approach. These orientations are representative of longitudinal fibres. Figure 9 shows a similar increase in sensitivity at this region with the multi-shell approach, but now focusing on the left-right callosal orientations (dotted arrows) that cross the pyramidal tract. More complexity is also resolved within other deep white matter regions (internal capsule – dashed arrows), as well as in regions closer to the cortex (solid arrows). These extra orientations from multi-shell deconvolution represent crossings, as well as within-voxel dispersed fibre patterns. It is noteworthy that all resolved patterns exhibit strong spatial coherence among neighbouring voxels. This increases the likelihood that the patterns reflect underlying anatomical reality and makes them genuinely useful for tracking algorithms.
Figure 8.
Fibre orientations (RGB-color coded Red:left-right, Green:Anterior-Posterior, Blue: Inferior-Superior) using single and multi-shell datasets, matched for acquisition time (spatial resolution 1.25 mm isotropic) (axial views). The single-shell ball & stick (Behrens et al., 2007) and its multi-shell extension (Jbabdi et al., 2012) have been employed for the respective datasets (each with up to three fibre compartments per voxel). Yellow arrows show areas of improvement using multi-shell as discussed in main text. Zoomed-in versions of these areas are shown in panel B. Orientation vectors are superimposed on gray-scale maps representing the total anisotropic volume fraction in each voxel (i.e. the sum of volume fractions of compartments that model anisotropic diffusion in the multi-compartment ball & stick model). Orientations are shown only when the respective volume fraction is larger than 5%.
Figure 9.
Fibre orientations (RGB-color coded Red:left-right, Green:Anterior-Posterior, Blue: Inferior-Superior) using single and multi-shell datasets, matched for acquisition time (spatial resolution 1.25 mm isotropic) (coronal views). The single-shell ball & stick (Behrens et al., 2007) and its multi-shell extension (Jbabdi et al., 2012) have been employed for the respective datasets (each with up to three fibre compartments per voxel). Yellow arrows show areas of improvement using multi-shell as discussed in main text. Zoomed-in versions of these areas are shown in panel B. Orientation vectors are superimposed on gray-scale maps representing the total anisotropic volume fraction in each voxel (i.e. the sum of volume fractions of compartments that model anisotropic diffusion in the multi-compartment ball & stick model). Orientations are shown only when the respective volume fraction is larger than 5%.
Similar sensitivity differences between single and multi-shell approaches have been reported before (Ozarslan et al., 2006; Aganj et al., 2010; Jbabdi et al., 2012). Therefore, we utilise the multi-shell approach for the HCP datasets. We estimate fibre orientations and their uncertainty using Bayesian inference on the multi-shell spherical deconvolution framework and a Rician noise model (Jbabdi et al., 2012). The number of fibre compartments in each voxel is determined using automatic relevance determination (ARD) priors, as in (Behrens et al., 2007).
We also considered other approaches for performing fibre orientation estimation (Sotiropoulos et al., 2011). Amongst them, various methods for resolving diffusion ODFs (Tuch, 2004; Descoteaux et al., 2007; Aganj et al., 2010; Kamath et al., 2012), as well as methods for non-parametric spherical deconvolution (Tournier et al., 2007). Even if the constant solid angle approach (Aganj et al., 2010; Kamath et al., 2012) provided the sharpest diffusion ODF profiles, spherical deconvolution approaches, such as the ball & stick or the spherical-harmonics deconvolution (Tournier et al., 2007) provided, in general, greater sensitivity in resolving fibre crossings. Neverthless, since the data are becoming available to the community, different orientation estimation methods and tractography strategies can be potentially explored.
Tractography
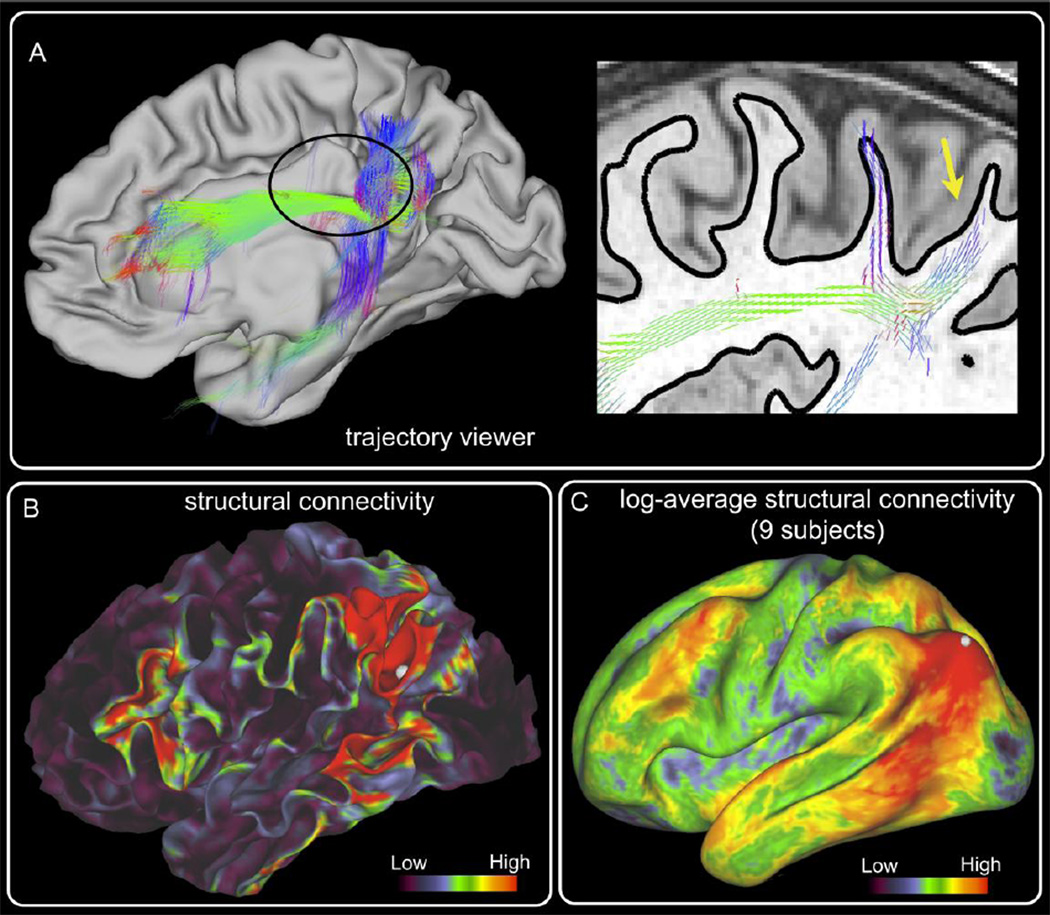
Probabilistic streamline tractography is employed to propagate spatially the local fibre orientation information (Behrens et al., 2003; Parker and Alexander, 2003). Our tractography algorithm has been modified to handle surfaces and volumes as regions of interest, rather than volumes only, which is the common practice. Therefore, extra functionality is supported and handling of surface vertices, such as seeding from the gray/white matter boundary surface or using the pial surface as a termination mask (Figure 10). The new tractography toolbox is part of FSL 5.
Figure 10.
Connectome Workbench allows visualization of probabilistic tractography in a number of ways. A) Left: Probabilistic trajectories arising from a seed in the inferior parietal cortex (yellow arrow on the right and dot in (B) and (C)). The contralateral pial surface is also shown. Only streamline samples that intersect the cortical surface at one or more locations are considered. A 3D trajectory is made up of the fiber orientations employed by the probabilistic samples during tractography. The orientation vectors are RGB color-coded and with opacity representative of the underlying number of streamlines that took the particular fiber orientation. Right: Part of the same distribution is shown for a single saggital slice, superimposed on a T1w image. The white/gray matter boundary surface is shown with the black solid line. The corresponding location on the left is shown encircled. B) Structural connectivity values for the same seed are displayed on the white/gray matter boundary surface. C) Average structural connectivity values for the same seed across 9 subjects. Results are presented in log-scale and on an inflated average surface.
Structural connectivity matrices can be obtained using a variety of seeding strategies. One strategy involves seeding from the cortical surface and recording the number of streamlines that reach other cortical vertices. This in general results in a very sparse connectivity matrix. Another strategy is to seed from all white matter voxels and count the streamlines that go through a particular pair of vertices. As shown in (Li et al., 2012), each of these two methods has different strengths and limitations. A third method records a NxM matrix C, whose cij element gives the number of streamlines that start from a cortical vertex i and intersect a brain location j (the latter including both GM and WM voxels). The akl element of the NxN matrix A=CCT will then contain the number of streamlines that have started from vertex k and vertex l and meet in all intermediate brain locations. Current efforts focus on determining the most appropriate structural connectivity matrix, but examples using matrix A are shown in Figure 10.
Another important aspect of HCP software development is an interactive visualization framework (Connectome Workbench) that supports on-the-fly data exploration (Marcus et al., 2013; Van Essen et al., 2013b) in a point-and-click fashion. Figure 10 shows visualisation examples of probabilistic tractography results, with a seed chosen at the inferior parietal cortex. Panel A shows 3D trajectories of paths arising from the seed. Given the plethora of information and the vast number of streamlines generated by probabilistic tractography, we chose to display probabilistic trajectories as groups of the fibre orientation distributions from which they are generated (modes of the distributions are shown in this example). This strategy allows greater flexibility for displaying information along the trajectory, such as highlighting the main fibre orientation that contributes in each voxel to generate a certain path. The same information of the trajectories can be displayed on volume slices (right of Panel A). Panel B shows a structural connectivity map for the same seed, with the values corresponding to connectivity matrix A (see previous paragraph) and displayed on the gray/white matter surface. Panel C shows a connectivity map averaged across 9 subjects and displayed in log scale on the average inflated surface. Probabilistic tractography for these examples was seeded at the white/gray matter boundary surface and the pial cortical surface was used as a stopping mask. A maximum curvature threshold of 75° was used and 10,000 streamlines were generated for each surface vertex.
Computing using GPUs
Due to the high spatial and angular resolution of the HCP datasets, the processing pipeline has large computational demands. Analysis of a single subject can take many hours, even on a large computing cluster. We therefore explored ways of speeding up computations using Graphics Processing Units (GPUs), which are massive parallel processors. We employed the Compute Unified Device Architecture (CUDA) programming model to develop GPU-based toolboxes for the fibre orientation estimation and distortion correction stages. The principles of these designs and implementations have been presented in (Hernandez et al., 2012; Hernandez et al., 2013), and speed-up factors of at least two orders of magnitude have been achieved for the Bayesian estimation of fibre orientations. More specifically, for a typical HCP dMRI dataset, the MCMC-based estimation of the multi-shell deconvolution model (Jbabdi et al., 2012), that returns the posterior distribution of the parameter given the data, takes 15–20 minutes on a GPU cluster, while requiring 25–30 hours on a CPU cluster with the same number of computing nodes.
Overview of the Final dMRI Protocol
The final dMRI protocol at 3 Tesla for the WU-Minn HCP was determined after extensive piloting on various aspects of the acquisition and processing, some of which have been described in the previous sections. The HCP dMRI scans utilise the Stejskal-Tanner pulsed gradient (i.e. monopolar) scheme (Stejskal and Tanner, 1965), within a single-shot 2D spin-echo multiband EPI acquisition. A multiband factor of 3 and a controlled aliasing PE shift by FOV/3 (Setsompop et al., 2012) is used. A partial Fourier factor of 6/8 with zero filling and without in-plane acceleration is used (Ugurbil et al., 2013). No special hardware is used to minimise eddy currents other than gradient pre-emphasis, implemented by the vendor. Nominal spatial resolution as measured by voxel dimension (with greater PSF on the image phase encoding axis) is 1.25mm isotropic (FOV PE×Readout=210×180, matrix size PE×Readout = 144×168), with 111 slices acquired in interleaved slice order without gap to cover the entire brain and phase encoding applied along the left-right (LR/RL) direction. A total of 108 echoes are collected, with echo spacing of 0.78ms and readout bandwidth 1490 Hz/Pixel, resulting in a total echo train length (ETL) of 84.24 ms. Gradient reversal is used for fat saturation (Gomori et al., 1988). A pair of apodized sinc RF pulses is used for excitation and refocusing. Flip angles are empirically set to 78 and 160 degrees, respectively, to avoid overflipping (i.e. greater than 180 degrees) in the center of the brain and reduce RF power deposition (Ugurbil et al., 2013). Pulse durations are empirically set to 3.2 ms and 7.04 ms with RF bandwidth time product (BWTP) of 3.2 and 5.2, respectively. The refocusing pulse selects slices 15% thicker than those excited by the excitation pulse to avoid spin echo slice thinning effect due to imperfect RF slice profiles. The interleaving slice order minimizes slice cross-talk. Finally, no filtering or interpolation is applied in k-space or image space.
Sampling in q-space includes 3 shells at b=1000, 2000 and 3000 s/mm2 (diffusion times are Δ=43.1 ms and 5=10.6 ms, and Gmax=97.4 mT/m after vendor supplied gradient duty cycle optimization). Small b value variations due to the cross-terms between diffusion and imaging gradients are calculated (vendor supplied algorithm) in units of 5 s/mm2 before the gradient nonlinearity correction. TE and TR are matched across shells (TE=89 ms, TR=5.5s). For each shell, 190 data points are obtained, corresponding to 90 diffusion gradient directions and 5 b=0’s acquired twice, with the phase encoding direction reversed for each pair (i.e. LR and RL pairs). Directions are optimised within and across shells (i.e. staggered) to maximize angular coverage using the approach of (Caruyer et al., 2011) (http://www-sop.inria.fr/members/Emmanuel.Caruyer/q-space-sampling.php), and form a total of 270 non-colinear directions for each PE direction. Cardiac monitoring is performed during the scan to allow for retrospective cardiac-gating (for instance (Mohammadi et al., 2012)). Total scanning time for whole-brain coverage is ~55 minutes. Note that a similar acquisition would take 3–4 hours with conventional methods and scanners, while also having much less SNR.
To minimise frequency drifts due to the long EPI scan, we split the dMRI acquisition into 6 segments of roughly 9 minutes duration each (Glasser et al., 2013). For each acquisition segment, the resonance frequency is recalibrated. In addition, frequency feedback has been implemented (based on phase information from the EPI navigator echoes) within each acquisition segment to update the resonance frequency for each volume. The average frequency drift is estimated to be ~ 0.5 Hz for every ~10 sec for the HCP dMRI protocol.
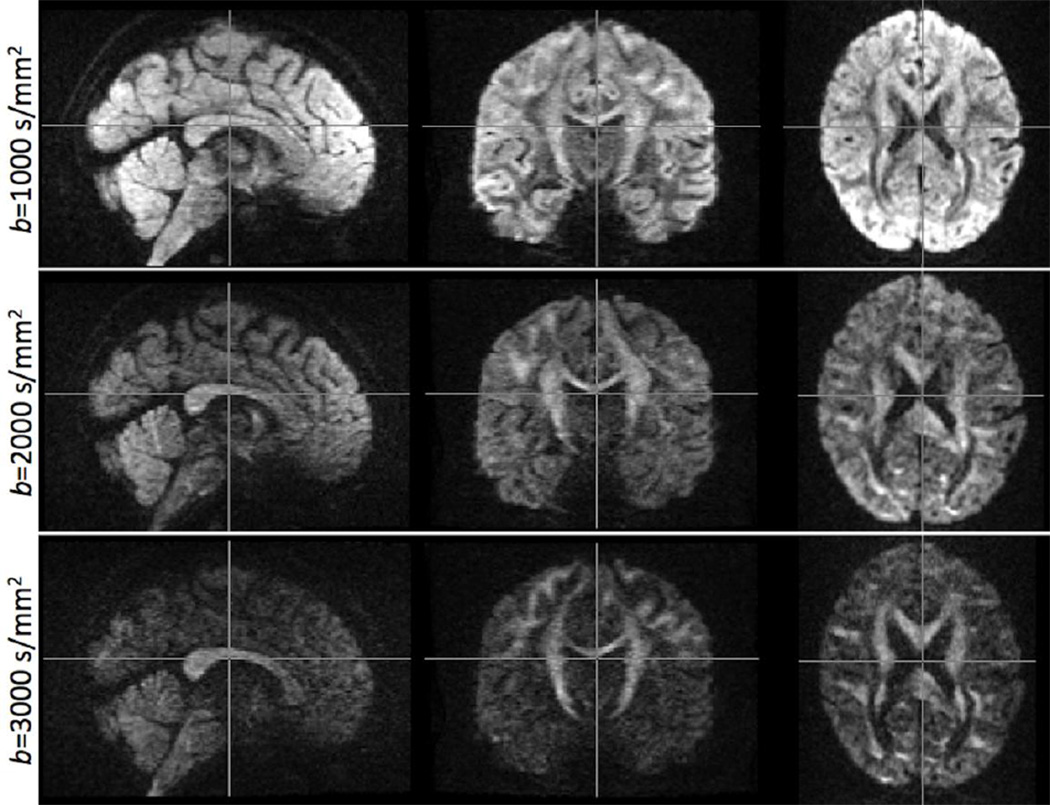
Figure 11 illustrates an example of the final preprocessed data, corrected for susceptibility-induced distortions and eddy currents, at all three b values acquired. Images for each b value correspond to a single gradient direction, after combining the respective LR and RL acquisitions. Notice the high SNR of these images, despite the very high spatial resolution.
Figure 11.
Exemplar data quality at different b values, representative of the final HCP diffusion MRI protocol and pre-processing pipeline. Spatial resolution is 1.25mm isotropic. Images for each b value correspond to a single gradient direction, with the respective LR and RL acquisitions combined after distortion correction.
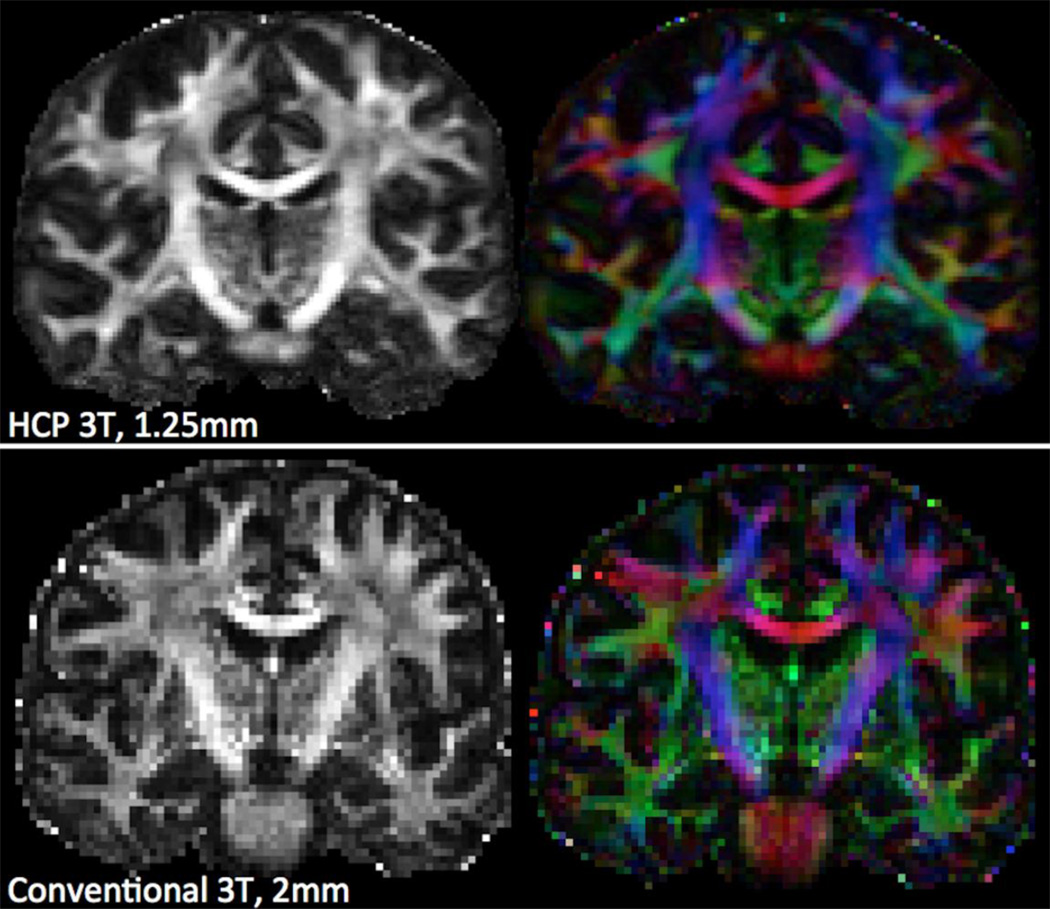
Figure 12 illustrates the difference the high spatial resolution and SNR of the HCP datasets can make on DTI-derived maps. Fractional anisotropy (FA) and RGB color-coded direction maps are estimated. These are compared with maps obtained from more typically-acquired data (2mm isotropic resolution) from a clinical 3T scanner (Verio, Siemens), matched for acquisition time.
Figure 12.
Coronal views of fractional anisotropy (FA) and RGB-color coded direction maps obtained using the DTI model on HCP data (top) and data from a different subject acquired using a Siemens Verio 3T system (bottom). Datasets are matched for acquisition time, but have slightly different positioning. The HCP dataset was a subset of the full multi-shell data, and comprised of 90 directions at b=1000 s/mm2 (acquired twice, at 1.25mm isotropic resolution, MB=3). The Verio dataset comprised of 60 directions at b=1000 s/mm2 (acquired twice, at 2mm isotropic resolution, no MB). For both cases, the same distortion correction pipeline was utilised.
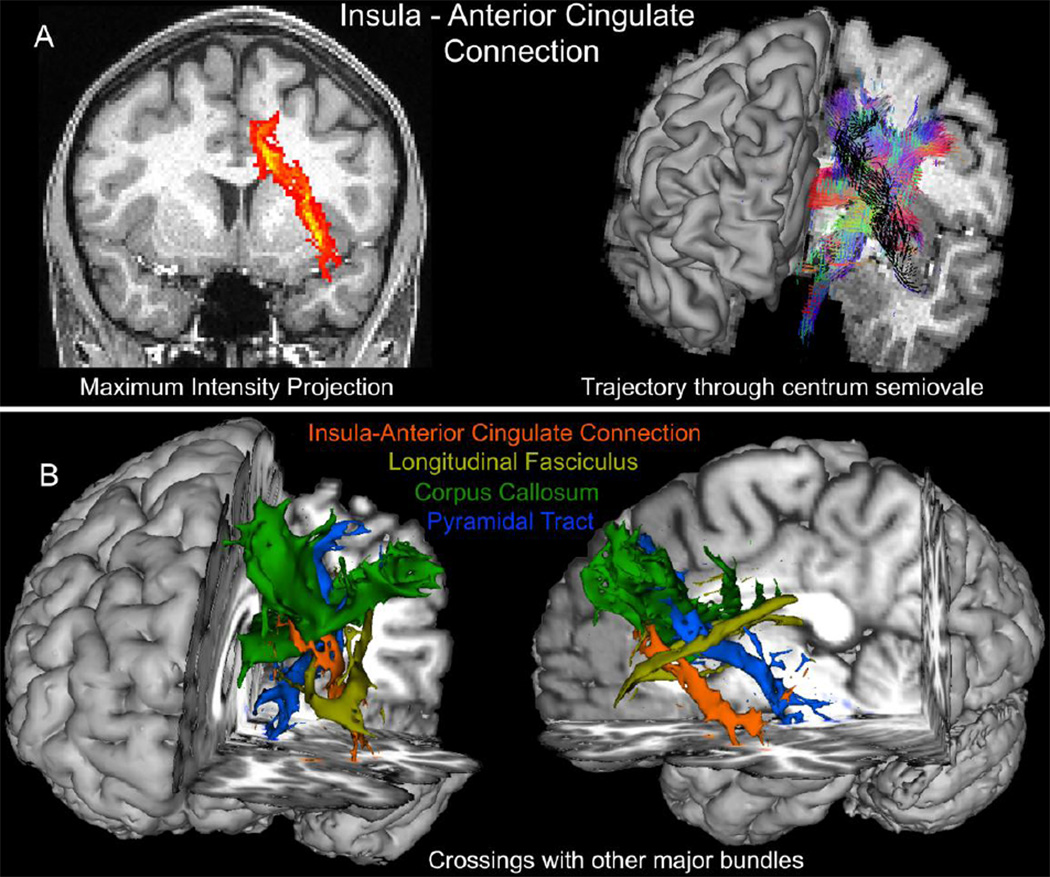
Figure 13 presents a tractography example of a connection that is difficult to reconstruct with conventional datasets. As known from tracer studies in the monkey brain, the insula connects directly to the anterior cingulate cortex (Mesulam and Mufson, 1982; Mufson and Mesulam, 1982), while connectivity studies in the human brain using resting-state fMRI also support the existence of this connection (Margulies et al., 2007). Tractography reconstruction of the insula-anterior cingulate connection is challenging, as this projection goes through a region of high complexity, crossing many major fibre bundles within the anterior centrum semiovale (Figure 13B). The quality of the HCP dMRI data allows the robust estimation of this connection. A seed mask in the anterior cingulate cortex along with a waypoint mask in the insula were utilised (only streamlines going through the waypoint were retained). A coronal maximum intensity projection of the path probabilities is shown in Figure 13A (left). The complexity of the region and the route taken by the connection (black) is illustrated in the right panel of Figure 13A. Binarised tractograms are shown for the connection of interest along with some major bundles it crosses (including callosal, pyramidal and longitudinal projections) in Figure 13B.
Figure 13.
Probabilistic tractography results using the HCP dMRI data for the connection between the insula and the anterior cingulate cortex. A) A coronal maximum intensity projection of the path probability map is shown on the left (color code: red for low, yellow for high). The orientations composing the main trajectory through the anterior centrum semiovale is shown in black on the right, while orientations employed by crossing tracts are shown RGB color-coded. B) Binarised tractograms of different bundles the insula-cingulate connection (orange) has to cross from a coronal and sagittal perspective (probability threshold 0.1%). Tractograms are rendered in 3D along with a T1w image and correspond to callosal projections (green), pyramidal tract projections (blue) and longitudinal fasciculi (yellow). Tractography has been performed with multi-shell parametric deconvolution (Jbabdi et al., 2012), modeling up to three fibres per voxel.
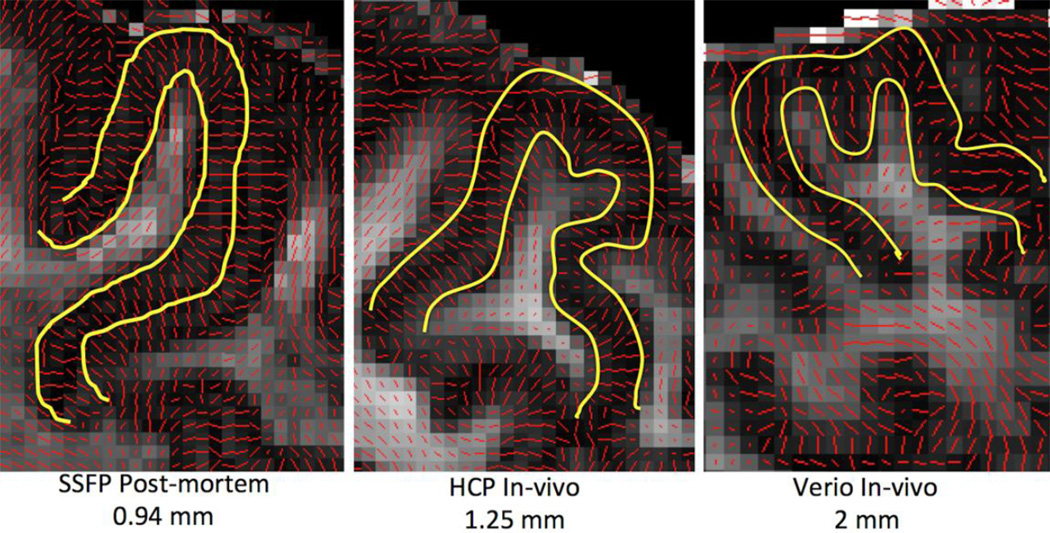
Another example of the new capabilities the HCP data will offer is the ability to capture cortical radial anisotropy, as shown in Figure 14. This feature has previously been reported only in very high quality and high-resolution post-mortem data (McNab et al., 2009; Dyrby et al., 2011; Miller et al., 2011; Miller et al., 2012), in-vivo data acquired at 7T with high in-plane spatial resolution and large slice thickness (Heidemann et al., 2010) or restricted field of view (Heidemann et al., 2012). This radial anisotropy may reflect the radial orientation of pyramidal cell apical dendrites and/or ascending and descending axons. Such a feature is barely evident in conventional diffusion MRI data, but is now much clearer in the HCP datasets.
Figure 14.
Cortical radial anisotropy evident in high-quality post-mortem data (isotropic spatial resolution of 0.94mm) using Steady-State Free Precession (SSFP) (Miller et al., 2012). Cortical anisotropy can be also observed for the HCP datasets (isotropic spatial resolution of 1.25mm), but not for more commonly acquired in-vivo datasets (Siemens Verio 3T, isotropic spatial resolution 2mm). For all cases, the DTI principal eigenvector is superimposed on the FA map.
Discussion
We have described many facets of an intensive refinement and optimization effort for diffusion MRI acquisition and processing undertaken by the WU-Minn HCP consortium. This effort resulted in convergence on a HCP diffusion acquisition and processing protocol that is already applied to HCP subjects (more than 70 subjects during the first quarter that ended in November, 2012). While many of the acquisition related considerations were discussed and put in context to the resulting diffusion data processing, some of the MR pulse sequence related optimizations and considerations were not presented, but are detailed in (Ugurbil et al., 2013).
Many groups will probably be interested in adapting, as closely as possible, the HCP dMRI protocol to their scanner. Given the extensive optimization that was conducted on the Connectome Skyra and its specialized hardware, recommendations are not easily generalizable to any 3T system and we highly suggest pilot studies on specific systems. Nevertheless, a few general observations can be made (see also ((Glasser et al., 2013)). Particularly for diffusion MRI, based on the data presented here: 1) Instead of averaging data, we strongly recommend acquisition of two reversed phase-encoding directions. Much of the SNR benefits associated with averaging are retained, and the benefit of being able to largely eliminate susceptibility distortions is a substantial one. Choosing LR/RL directions allows a reduction of the echo train length. 2) Multiband imaging allows much denser covering of q-space and permits substantial improvements in fibre orientation estimation. We do not yet have extensive experience with multiband dMRI on other scanners, but the application of multiband is not tied to gradient strength and/or available SNR. Therefore, Siemens scanners in particular (ideally with a 32-channel head coil) should directly benefit from our multiband dMRI implementation. 3) Multi-shell schemes (and multi-shell spherical deconvolution) offer greater sensitivity for resolving complex fibre geometries than single-shell schemes (and single-shell deconvolution); with the choice of the exact b values depending on the available SNR. 4) Root-sum-of-squares reconstruction should be avoided when reconstructing magnitude dMRI data. This is particularly true for higher b values or lower SNR data and the problem scales with the number of coil elements. 5) Spatial resolutions lower than the typically-used 2mm isotropic seem beneficial for tractography; of course, this clearly depends on the SNR available from a particular scanner and sequence.
HCP datasets (including resting-state fMRI, task fMRI, dMRI and structural) will be made freely available at quarterly intervals starting in March, 2013 (http://www.humanconnectome.org). A second piloting stage will explore dMRI acquisitions for the Siemens 7T scanner based at the University of Minnesota, which will involve different considerations and limitations. Two hundred subjects will be scanned using the 7T scanner, which also has SC72 gradients and eventually 64-channel receive capability (Van Essen et al., 2012).
As part of this second piloting stage, new acceleration approaches, such as compressed sensing, will be explored and combined with multiband excitation. Preliminary results (Duarte-Carvajalino et al., 2012) suggest a two- to four-fold acceleration in diffusion acquisitions achieved by compressed sensing alone, which can in principle be combined with the more traditional parallel imaging approaches. We will also explore more advanced sampling schemes and analysis following the RubiX framework (Sotiropoulos et al., 2013b) in which data acquired at multiple spatial resolutions are jointly analysed in a data-fusion approach. This tackles the trade-off between spatial specificity and signal to noise ratio and offers robust estimation of diffusion parameters on high spatial resolution grids.
We are also exploring new methods for fibre orientation estimation and tractography. These include new parametric deconvolution approaches that can directly quantify fibre dispersion (Sotiropoulos et al., 2012), as well as ways for inferring asymmetric fibre patterns through tractography (Jbabdi and Johansen-Berg, 2011). We have been further developing validation frameworks for diffusion MRI predictions, both at a local (i.e. voxelwise) scale through histology (Sotiropoulos et al., 2013a) and at a global scale by comparing fibre tracking with axonal tracing in the macaque brain (Jbabdi et al., 2013).
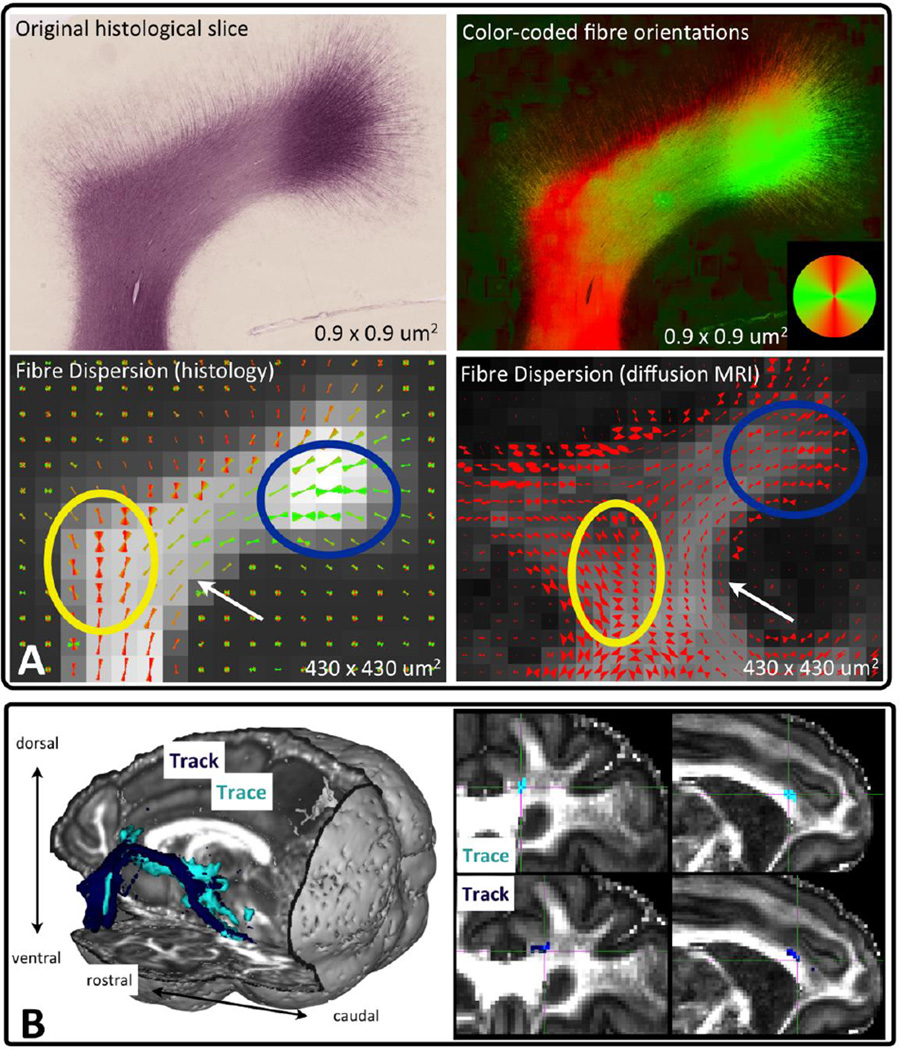
Validation examples from these two approaches are shown in Figure 15. Panel A presents qualitative comparisons between histology-derived fibre orientation and dispersion and diffusion MRI-based predictions (Sotiropoulos et al., 2013a). “Ground-truth” fibre orientation and dispersion maps were obtained by structure tensor analysis (Budde and Frank, 2012) applied to a myelin immune-reacted histological section from an early postnatal macaque (Van Essen et al., 2013a). The results were compared to MRI-derived dispersion estimates, obtained from a corresponding location from a postmortem adult macaque using the ball and racket model (Sotiropoulos et al., 2012). The two dispersion maps agree qualitatively in many aspects. Both exhibit increased dispersion, as fibres fan out to the cortex (blue circle) or exhibit incoherence due to bending/fanning in deeper white matter (yellow circle). Furthermore, they both predict reduced dispersion near the fundus of a sulcus (white arrow).
Figure 15.
A) Validation of local estimates from diffusion MRI with histology in the macaque brain. Structure tensor analysis was employed to obtain estimates of the main fibre orientations, shown color-coded, (top right) from a histological section of the superior frontal gyrus (top left) of an early postnatal macaque (Van Essen et al., 2013a). Orientations were then grouped at larger pixels to match the in-plane spatial resolution of a post-mortem diffusion MRI scan (bottom left). These “ground-truth” cones of dispersion were compared to MRI-derived dispersion estimates (bottom right) using the ball and racket model. Spatial resolution is mentioned at the bottom of each sub-figure. B) Validation of tractography results with tracers in the macaque brain (Jbabdi et al., 2013). On the left, the 3D trajectory of the tractography-reconstructed paths (dark blue) seeded from the lateral orbitofrontal cortex (OFC) and going through the internal capsule is shown along with the axonal connections revealed by chemical tracing (light blue) from the same region. On the right, the entry point of connections from the OFC into the cingulum bundle is shown. The estimated location through tractography (bottom) is almost identical to the ground-truth (top). Coronal and sagittal views are presented.
Figure 15B presents a comparison at a more global scale, in which tractography-derived paths are validated against bidirectional axonal tracing (Lehman et al., 2011; Jbabdi et al., 2013). The connections arising from the lateral orbitofrontal cortex (OFC) are shown on the left. Notice the striking overlap between tractography and chemical tracing. Another example is shown on the right. The location where connections from the lateral OFC enter the cingulum bundle is almost perfectly estimated by tractography, compared to the ground-truth location revealed by tracing. In summary, such local and global validation frameworks give unique possibilities for testing new methodological and data acquisition developments and increase our confidence on results interpretation.
Finally, it is useful to note the complementary aims of the efforts described here, by the “WU-Minn” HCP consortium, and the efforts of the “MGH-UCLA” HCP consortium (McNab et al., 2013; Setsompop et al., 2013). The WU-Minn consortium is in the process of generating a large database of state-of-the-art data aimed at characterizing human brain connectivity (functional and structural) and its variability in a large and extensively characterised population. Therefore, decisions were made for achieving very high data quality, but also keeping the technical risks at a relatively low level. The “MGH-UCLA” consortium, on the other hand, is capitalizing on a customized scanner that has a maximum gradient strength of 300 mT/m. This enables efforts to sample 3T diffusion data, with high SNR at high b values that are particularly useful for diffusion spectrum imaging (DSI). The SNR attainable by the two scanners would depend on the b value used. For b values employed in the WU-Minn 3T acquisition protocol, the SNR gains expected for the MGH-UCLA scanner would be ~30% or less (Ugurbil et al., 2013). The SNR gains would be larger for higher b for the MGH-UCLA scanner (Van Essen et al., 2012). Whatever the actual differences, once these are empirically compared, it is likely that methodological advances in pulse sequences and data analyses from the two consortia will continue to complement one another and will open new exciting possibilities for in-vivo studies of brain structure and function.
Highlights.
-
>
We present an overview of advances in diffusion MRI acquisition and processing.
-
>
These are the result of the intensive piloting phase of the Human Connectome Project.
-
>
They are representative of the data and pipeline public releases, beginning in 2013.
Acknowledgement
We acknowledge support from the Human Connectome Project (1U54MH091657-01), from the 16 NIH Institutes and Centers that support the NIH Blueprint for Neuroscience Research, plus grants P41 EB015894, P30 NS057091, P30 NS076408 and R01 MH60974. Computations were performed using the facilities of the Washington University Center for High Performance Computing, which were partially provided through grant NCRR 1S10RR022984-01A1. Members of the WU-Minn HCP Consortium are listed at http://www.humanconnectome.org/about/hcp-investigators.html and http://www.humanconnectome.org/about/hcp-colleagues.html.
Footnotes
Publisher's Disclaimer: This is a PDF file of an unedited manuscript that has been accepted for publication. As a service to our customers we are providing this early version of the manuscript. The manuscript will undergo copyediting, typesetting, and review of the resulting proof before it is published in its final citable form. Please note that during the production process errors may be discovered which could affect the content, and all legal disclaimers that apply to the journal pertain
The point spread functions (PSF) in both PE and readout direction, due to a finite sampling window, is a sinc function with full-width at half maximum (FWHM) of 121% voxel size (Rahmer et al, 2006). The effect of the finite sampling window is not typically reported in MRI; however, it should be noted that the actual PSF is calculated by convolving the PSF due to the finite sampling window with the PSF due to the transverse relaxation. What is typically reported is only the additional blurring along the PE direction due to the T2/T2* decay, which in this case is ~15%.
REFERENCES
- Aganj I, Lenglet C, Sapiro G, Yacoub E, Ugurbil K, Harel N. Reconstruction of the orientation distribution function in single- and multiple-shell q-ball imaging within constant solid angle. Magnetic Resonance in Medicine. 2010;64:554–566. doi: 10.1002/mrm.22365. [DOI] [PMC free article] [PubMed] [Google Scholar]
- Alexander DC. Maximum entropy spherical deconvolution for diffusion MRI. Inf Process Med Imaging. 2005;19:76–87. doi: 10.1007/11505730_7. [DOI] [PubMed] [Google Scholar]
- Alexander DC, Hubbard PL, Hall MG, Moore EA, Ptito M, Parker GJ, Dyrby TB. Orientationally invariant indices of axon diameter and density from diffusion MRI. Neuroimage. 2010;52:1374–1389. doi: 10.1016/j.neuroimage.2010.05.043. [DOI] [PubMed] [Google Scholar]
- Anderson AW. Measurement of fiber orientation distributions using high angular resolution diffusion imaging. Magn Reson Med. 2005;54:1194–1206. doi: 10.1002/mrm.20667. [DOI] [PubMed] [Google Scholar]
- Andersson JLR, Xu J, Yacoub E, Auerbach EJ, Moeller S, Ugurbil K. A comprehensive gaussian process framework for correcting distortions and movements in diffusion images; Melbourne, Australia. International Society for Magnetic Resonance in Medicine (ISMRM) Annual Meeting; 2012. p. 2426. [Google Scholar]
- Andersson JL, Skare S, Ashburner J. How to correct susceptibility distortions in spin-echo echo-planar images: application to diffusion tensor imaging. Neuroimage. 2003;20:870–888. doi: 10.1016/S1053-8119(03)00336-7. [DOI] [PubMed] [Google Scholar]
- Assaf Y, Basser PJ. Composite hindered and restricted model of diffusion (CHARMED) MR imaging of the human brain. Neuroimage. 2005;27:48–58. doi: 10.1016/j.neuroimage.2005.03.042. [DOI] [PubMed] [Google Scholar]
- Bammer R, Markl M, Barnett A, Acar B, Alley MT, Pelc NJ, Glover GH, Moseley ME. Analysis and generalized correction of the effect of spatial gradient field distortions in diffusion-weighted imaging. Magn Reson Med. 2003;50:560–569. doi: 10.1002/mrm.10545. [DOI] [PubMed] [Google Scholar]
- Basser PJ, Pajevic S, Pierpaoli C, Duda J, Aldroubi A. In vivo fiber tractography using DT-MRI data. Magn Reson Med. 2000;44:625–632. doi: 10.1002/1522-2594(200010)44:4<625::aid-mrm17>3.0.co;2-o. [DOI] [PubMed] [Google Scholar]
- Behrens TE, Berg HJ, Jbabdi S, Rushworth MF, Woolrich MW. Probabilistic diffusion tractography with multiple fibre orientations: What can we gain? Neuroimage. 2007;34:144–155. doi: 10.1016/j.neuroimage.2006.09.018. [DOI] [PMC free article] [PubMed] [Google Scholar]
- Behrens TEJ, Jbabdi S. MR Diffusion Tractography. In: Johansen-Berg H, Behrens TEJ, editors. Diffusion MRI: From quantitative measurement to in vivo neuroanatomy. Academic Press; 2009. pp. 333–352. [Google Scholar]
- Behrens TE, Sporns O. Human connectomics. Curr Opin Neurobiol. 2012;22:144–153. doi: 10.1016/j.conb.2011.08.005. [DOI] [PMC free article] [PubMed] [Google Scholar]
- Behrens TE, Woolrich MW, Jenkinson M, Johansen-Berg H, Nunes RG, Clare S, Matthews PM, Brady JM, Smith SM. Characterization and propagation of uncertainty in diffusion-weighted MR imaging. Magn Reson Med. 2003;50:1077–1088. doi: 10.1002/mrm.10609. [DOI] [PubMed] [Google Scholar]
- Budde MD, Frank JA. Examining brain microstructure using structure tensor analysis of histological sections. Neuroimage. 2012;63:1–10. doi: 10.1016/j.neuroimage.2012.06.042. [DOI] [PubMed] [Google Scholar]
- Caruyer E, Cheng J, Lenglet C, Sapiro G, Jiang T, Deriche R. Optimal design of multiple q-shells experiments for diffusion MRI. Toronto, Canada: MICCAI workshop on Computational Diffusion MRI (CDMRI; 2011. [Google Scholar]
- Catani M, Thiebaut de Schotten M. A diffusion tensor imaging tractography atlas for virtual in vivo dissections. Cortex. 2008;44:1105–1132. doi: 10.1016/j.cortex.2008.05.004. [DOI] [PubMed] [Google Scholar]
- Constantinides CD, Atalar E, McVeigh ER. Signal-to-noise measurements in magnitude images from NMR phased arrays. Magn Reson Med. 1997;38:852–857. doi: 10.1002/mrm.1910380524. [DOI] [PMC free article] [PubMed] [Google Scholar]
- Conturo TE, Lori NF, Cull TS, Akbudak E, Snyder AZ, Shimony JS, McKinstry RC, Burton H, Raichle ME. Tracking neuronal fiber pathways in the living human brain. Proc Natl Acad Sci U S A. 1999;96:10422–10427. doi: 10.1073/pnas.96.18.10422. [DOI] [PMC free article] [PubMed] [Google Scholar]
- Dell'Acqua F, Rizzo G, Scifo P, Clarke RA, Scotti G, Fazio F. A model-based deconvolution approach to solve fiber crossing in diffusion-weighted MR imaging. IEEE Trans Biomed Eng. 2007;54:462–472. doi: 10.1109/TBME.2006.888830. [DOI] [PubMed] [Google Scholar]
- Descoteaux M, Angelino E, Fitzgibbons S, Deriche R. Regularized, fast, and robust analytical Q-ball imaging. Magn Reson Med. 2007;58:497–510. doi: 10.1002/mrm.21277. [DOI] [PubMed] [Google Scholar]
- Duarte-Carvajalino JM, Lenglet C, Ugurbil K, Moeller S, Carin L, Sapiro G. A framework for multi-task Bayesian compressive sensing of DW-MRI; France. Proceedings of the CDMRI MICCAI workshop, Nice; 2012. pp. 1–13. [Google Scholar]
- Dyrby TB, Baare WF, Alexander DC, Jelsing J, Garde E, Sogaard LV. An ex vivo imaging pipeline for producing high-quality and high-resolution diffusion-weighted imaging datasets. Hum Brain Mapp. 2011;32:544–563. doi: 10.1002/hbm.21043. [DOI] [PMC free article] [PubMed] [Google Scholar]
- Feinberg DA, Moeller S, Smith SM, Auerbach E, Ramanna S, Gunther M, Glasser MF, Miller KL, Ugurbil K, Yacoub E. Multiplexed echo planar imaging for sub-second whole brain FMRI and fast diffusion imaging. PLoS One. 2010;5:e15710. doi: 10.1371/journal.pone.0015710. [DOI] [PMC free article] [PubMed] [Google Scholar]
- Fernandez-Miranda JC, Rhoton AL, Jr., Alvarez-Linera J, Kakizawa Y, Choi C, de Oliveira EP. Three-dimensional microsurgical and tractographic anatomy of the white matter of the human brain. Neurosurgery. 2008;62:989–1026. doi: 10.1227/01.neu.0000333767.05328.49. [DOI] [PubMed] [Google Scholar]
- Glasser MF, Sotiropoulos SN, Wilson JA, Coalson TS, Fischl B, Andersson JL, Xu J, Jbabdi S, Webster M, Polimeni JR, Van Essen DC, Jenkinson M for the WU-Minn HCP Consortium. The Minimal Preprocessing Pipelines for the Human Connectome Project. NeuroImage Special Issue "Mapping the Connectome". 2013 doi: 10.1016/j.neuroimage.2013.04.127. In press. [DOI] [PMC free article] [PubMed] [Google Scholar]
- Gomori JM, Holland GA, Grossman RI, Gefter WB, Lenkinski RE. Fat suppression by section-select gradient reversal on spin-echo MR imaging. Work in progress. Radiology. 1988;168:493–495. doi: 10.1148/radiology.168.2.3393670. [DOI] [PubMed] [Google Scholar]
- Haacke EM, Brown RW, Thompson MR, Venkatesan R. Magnetic resonance imaging : physical principles and sequence design. New York: Wiley; 1999. [Google Scholar]
- Haselgrove JC, Moore JR. Correction for distortion of echo-planar images used to calculate the apparent diffusion coefficient. Magn Reson Med. 1996;36:960–964. doi: 10.1002/mrm.1910360620. [DOI] [PubMed] [Google Scholar]
- Heidemann RM, Anwander A, Feiweier T, Knosche TR, Turner R. k-space and q-space: combining ultra-high spatial and angular resolution in diffusion imaging using ZOOPPA at 7 T. Neuroimage. 2012;60:967–978. doi: 10.1016/j.neuroimage.2011.12.081. [DOI] [PubMed] [Google Scholar]
- Heidemann RM, Porter DA, Anwander A, Feiweier T, Heberlein K, Knosche TR, Turner R. Diffusion imaging in humans at 7T using readout-segmented EPI and GRAPPA. Magn Reson Med. 2010;64:9–14. doi: 10.1002/mrm.22480. [DOI] [PubMed] [Google Scholar]
- Hernandez M, Guerrero GD, Cecilia JM, Garcia JM, Inuggi A, Jbabdi S, Behrens TE, Sotiropoulos SN. Accelerating Fibre Orientation Estimation from Diffusion Weighted Magnetic Resonance Imaging Using GPUs. PLoS One. 2013 doi: 10.1371/journal.pone.0061892. [DOI] [PMC free article] [PubMed] [Google Scholar]
- Hernandez M, Guerrero GD, Cecilia JM, Garcia JM, Inuggi A, Sotiropoulos SN. Accelerating Fibre Orientation Estimation from Diffusion Weighted Magnetic Resonance Imaging Using GPUs. Germany: International Conference on Parallel, Distributed and Network-based Processing (PDP), Munich; 2012. pp. 622–626. [Google Scholar]
- Jakob C. Estudios biológicos sobre los lóbulos frontales cerebrales. La Semana Medica. 1906;13:1375–1381. [Google Scholar]
- Jbabdi S, Johansen-Berg H. Tractography: where do we go from here? Brain Connect. 2011;1:169–183. doi: 10.1089/brain.2011.0033. [DOI] [PMC free article] [PubMed] [Google Scholar]
- Jbabdi S, Lehman JF, Haber SN, Behrens TE. Human and monkey ventral prefrontal fibers use the same organizational principles to reach their targets: tracing versus tractography. J Neurosci. 2013;33:3190–3201. doi: 10.1523/JNEUROSCI.2457-12.2013. [DOI] [PMC free article] [PubMed] [Google Scholar]
- Jbabdi S, Sotiropoulos SN, Savio AM, Grana M, Behrens TE. Model-based analysis of multishell diffusion MR data for tractography: How to get over fitting problems. Magn Reson Med. 2012;68:1846–1855. doi: 10.1002/mrm.24204. [DOI] [PMC free article] [PubMed] [Google Scholar]
- Jesmanowicz A, Bandettini PA, Hyde JS. Single-shot half k-space high-resolution gradient-recalled EPI for fMRI at 3 Tesla. Magn Reson Med. 1998;40:754–762. doi: 10.1002/mrm.1910400517. [DOI] [PubMed] [Google Scholar]
- Kaden E, Knosche TR, Anwander A. Parametric spherical deconvolution: inferring anatomical connectivity using diffusion MR imaging. Neuroimage. 2007;37:474–488. doi: 10.1016/j.neuroimage.2007.05.012. [DOI] [PubMed] [Google Scholar]
- Kamath A, Aganj I, Xu J, Yacoub E, Ugurbil K, Sapiro G, Lenglet C. Generalized Constant Solid Angle ODF and Optimal Acquisition Protocol for Fiber Orientation Mapping; Nice, France. Proceedings of the CDMRI MICCAI workshop.2012. [Google Scholar]
- Kellman P, McVeigh ER. Image reconstruction in SNR units: a general method for SNR measurement. Magn Reson Med. 2005;54:1439–1447. doi: 10.1002/mrm.20713. [DOI] [PMC free article] [PubMed] [Google Scholar]
- Larkman DJ, Hajnal JV, Herlihy AH, Coutts GA, Young IR, Ehnholm G. Use of multicoil arrays for separation of signal from multiple slices simultaneously excited. J Magn Reson Imaging. 2001;13:313–317. doi: 10.1002/1522-2586(200102)13:2<313::aid-jmri1045>3.0.co;2-w. [DOI] [PubMed] [Google Scholar]
- Lehman JF, Greenberg BD, McIntyre CC, Rasmussen SA, Haber SN. Rules ventral prefrontal cortical axons use to reach their targets: implications for diffusion tensor imaging tractography and deep brain stimulation for psychiatric illness. J Neurosci. 2011;31:10392–10402. doi: 10.1523/JNEUROSCI.0595-11.2011. [DOI] [PMC free article] [PubMed] [Google Scholar]
- Lenglet C, Sotiropoulos SN, Moeller S, Xu J, Auerbach E, Yacoub E, Feinberg DA, Setsompop K, Wald LL, Behrens TE, Ugurbil K. Multichannel diffusion MRimage reconstruction: How to reduce elevated noise floor and improve fiber orientation estimation; Melbourne, Australia. International Society for Magnetic Resonance in Medicine (ISMRM) Annual Meeting; 2012. p. 3538. [Google Scholar]
- Li L, Rilling JK, Preuss TM, Glasser MF, Hu X. The effects of connection reconstruction method on the interregional connectivity of brain networks via diffusion tractography. Hum Brain Mapp. 2012;33:1894–1913. doi: 10.1002/hbm.21332. [DOI] [PMC free article] [PubMed] [Google Scholar]
- Marcus DS, Harms MP, Snyder AZ, Jenkinson M, Wilson JA, Glasser MF, Barch DM, Archie KA, Burgess GC, Ramaratnam M, Hodge M, Horton W, Herrick R, Olsen T, McKay M, House M, Hileman M, Reid E, Harwell J, Coalson T, Schindler J, Elam J, Curtiss SW, Van Essen DC for the WU-Minn HCP Consortium. Human Connectome Project Informatics: quality control, database services, and data visualization. NeuroImage Special Issue "Mapping the Connectome". 2013 doi: 10.1016/j.neuroimage.2013.05.077. In press. [DOI] [PMC free article] [PubMed] [Google Scholar]
- Marcus DS, Harwell J, Olsen T, Hodge M, Glasser MF, Prior F, Jenkinson M, Laumann T, Curtiss SW, Van Essen DC. Informatics and data mining tools and strategies for the human connectome project. Front Neuroinform. 2011;5:4. doi: 10.3389/fninf.2011.00004. [DOI] [PMC free article] [PubMed] [Google Scholar]
- Margulies DS, Kelly AM, Uddin LQ, Biswal BB, Castellanos FX, Milham MP. Mapping the functional connectivity of anterior cingulate cortex. Neuroimage. 2007;37:579–588. doi: 10.1016/j.neuroimage.2007.05.019. [DOI] [PubMed] [Google Scholar]
- McGibney G, Smith MR, Nichols ST, Crawley A. Quantitative evaluation of several partial Fourier reconstruction algorithms used in MRI. Magn Reson Med. 1993;30:51–59. doi: 10.1002/mrm.1910300109. [DOI] [PubMed] [Google Scholar]
- McNab JA, Edlow BL, Witzel T, Huang SY, Bhat H, Heberlein K, Keil B, Cohen-Adad J, Tisdall MD, Folkerth R, Kinney HC, Wald LL. The Human Connectome Project and Beyond: Initial Applications of 300 mT/m Gradients. NeuroImage Special Issue "Mapping the Connectome". 2013 doi: 10.1016/j.neuroimage.2013.05.074. In press. [DOI] [PMC free article] [PubMed] [Google Scholar]
- McNab JA, Jbabdi S, Deoni SC, Douaud G, Behrens TE, Miller KL. High resolution diffusion-weighted imaging in fixed human brain using diffusion-weighted steady state free precession. Neuroimage. 2009;46:775–785. doi: 10.1016/j.neuroimage.2009.01.008. [DOI] [PubMed] [Google Scholar]
- Mesulam MM, Mufson EJ. Insula of the old world monkey. III: Efferent cortical output and comments on function. J Comp Neurol. 1982;212:38–52. doi: 10.1002/cne.902120104. [DOI] [PubMed] [Google Scholar]
- Miller KL, McNab JA, Jbabdi S, Douaud G. Diffusion tractography of postmortem human brains: optimization and comparison of spin echo and steady-state free precession techniques. Neuroimage. 2012;59:2284–2297. doi: 10.1016/j.neuroimage.2011.09.054. [DOI] [PMC free article] [PubMed] [Google Scholar]
- Miller KL, Stagg CJ, Douaud G, Jbabdi S, Smith SM, Behrens TE, Jenkinson M, Chance SA, Esiri MM, Voets NL, Jenkinson N, Aziz TZ, Turner MR, Johansen-Berg H, McNab JA. Diffusion imaging of whole, post-mortem human brains on a clinical MRI scanner. Neuroimage. 2011;57:167–181. doi: 10.1016/j.neuroimage.2011.03.070. [DOI] [PMC free article] [PubMed] [Google Scholar]
- Moeller S, Xu J, Auerbach EJ, Yacoub E, Ugurbil K. Signal leakage (L-factor) as a measure for parallel imaging performance among simultaneously multi-slice (SMS) excited and acquired signals; Melbourne, Australia. Proceedings of the International Society for Magnetic Resonance in Medicine (ISMRM) Annual Meeting; 2012. p. 519. [Google Scholar]
- Moeller S, Yacoub E, Olman CA, Auerbach E, Strupp J, Harel N, Ugurbil K. Multiband multislice GE-EPI at 7 tesla, with 16-fold acceleration using partial parallel imaging with application to high spatial and temporal whole-brain fMRI. Magn Reson Med. 2010;63:1144–1153. doi: 10.1002/mrm.22361. [DOI] [PMC free article] [PubMed] [Google Scholar]
- Mohammadi S, Hutton C, Nagy Z, Josephs O, Weiskopf N. Retrospective correction of physiological noise in DTI using an extended tensor model and peripheral measurements. Magn Reson Med. 2012 doi: 10.1002/mrm.24467. [DOI] [PMC free article] [PubMed] [Google Scholar]
- Mori S, Crain BJ, Chacko VP, van Zijl PC. Three-dimensional tracking of axonal projections in the brain by magnetic resonance imaging. Ann Neurol. 1999;45:265–269. doi: 10.1002/1531-8249(199902)45:2<265::aid-ana21>3.0.co;2-3. [DOI] [PubMed] [Google Scholar]
- Mufson EJ, Mesulam MM. Insula of the old world monkey. II: Afferent cortical input and comments on the claustrum. J Comp Neurol. 1982;212:23–37. doi: 10.1002/cne.902120103. [DOI] [PubMed] [Google Scholar]
- Ozarslan E, Shepherd TM, Vemuri BC, Blackband SJ, Mareci TH. Resolution of complex tissue microarchitecture using the diffusion orientation transform (DOT) Neuroimage. 2006;31:1086–1103. doi: 10.1016/j.neuroimage.2006.01.024. [DOI] [PubMed] [Google Scholar]
- Parker GJ, Alexander DC. Probabilistic Monte Carlo based mapping of cerebral connections utilising whole-brain crossing fibre information. Inf Process Med Imaging. 2003;18:684–695. doi: 10.1007/978-3-540-45087-0_57. [DOI] [PubMed] [Google Scholar]
- Rahmer J, Bornert P, Groen J, Bos C. Three-dimensional radial ultrashort echo-time imaging with T2 adapted sampling. Magn Reson Med. 2006;55:1075–1082. doi: 10.1002/mrm.20868. [DOI] [PubMed] [Google Scholar]
- Robson MD, Porter DA. Reconstruction as a source of artifact in non-gated single-shot diffusion-weighted EPI. Magn Reson Imaging. 2005;23:899–905. doi: 10.1016/j.mri.2005.09.005. [DOI] [PubMed] [Google Scholar]
- Setsompop K, Gagoski BA, Polimeni JR, Witzel T, Wedeen VJ, Wald LL. Blipped-controlled aliasing in parallel imaging for simultaneous multislice echo planar imaging with reduced g-factor penalty. Magn Reson Med. 2012;67:1210–1224. doi: 10.1002/mrm.23097. [DOI] [PMC free article] [PubMed] [Google Scholar]
- Setsompop K, Kimmlingen R, Eberlein E, Witzel T, Cohen-Adad J, McNab JA, Keil B, Tisdall MD, Hoecht P, Dietz P, Cauley SF, Tountcheva V, Matschl V, Lenz H, Bhat H, Heberlein K, Potthast A, Thein H, Van Horn JD, Toga AW, Schmitt F, Lehne D, Bruce RR, Wedeen VJ, Wald LL. Pushing the limits of in vivo diffusion MRI for the Human Connectome Project. NeuroImage Special Issue "Mapping the Connectome". 2013 doi: 10.1016/j.neuroimage.2013.05.078. In press. [DOI] [PMC free article] [PubMed] [Google Scholar]
- Seunarine KK, Alexander DC. Multiple fibers: beyond the diffusion tensor. In: Johansen-Berg H, Behrens TEJ, editors. Diffusion MRI: From quantitative measurement to in-vivo neuroanatomy. Academic Press; 2009. pp. 55–72. [Google Scholar]
- Smith SM, Andersson JL, Auerbach EJ, Beckmann CF, Bijsterbosch J, Douaud G, Duff E, Feinberg DA, Griffanti L, Harms MP, Kelly M, Laumann T, Miller KL, Moeller S, Petersen S, Power J, Salimi-Khorshidi G, Snyder AZ, Vu A, Woolrich MW, Xu J, Yacoub E, Ugurbil K, Van Essen DC, Glasser MF for the WU-Minn HCP Consortium. Resting-state fMRI in the Human Connectome Project. NeuroImage Special Issue "Mapping the Connectome". 2013 doi: 10.1016/j.neuroimage.2013.05.039. In press. [DOI] [PMC free article] [PubMed] [Google Scholar]
- Smith SM, Jenkinson M, Woolrich MW, Beckmann CF, Behrens TE, Johansen-Berg H, Bannister PR, De Luca M, Drobnjak I, Flitney DE, Niazy RK, Saunders J, Vickers J, Zhang Y, De Stefano N, Brady JM, Matthews PM. Advances in functional and structural MR image analysis and implementation as FSL. Neuroimage. 2004;23(Suppl 1):S208–S219. doi: 10.1016/j.neuroimage.2004.07.051. [DOI] [PubMed] [Google Scholar]
- Sotiropoulos SN, Aganj I, Jbabdi S, Sapiro G, Lenglet C, Behrens T. Inference on Constant Solid Angle Orientation Distribution Functions from Diffusion-Weighted MRI; Quebec City, Canada. Proceedings of the Organization for Human Brain Mapping (OHBM) Annual Meeting; 2011. p. 609. [Google Scholar]
- Sotiropoulos SN, Behrens TE, Jbabdi S. Ball and rackets: Inferring fiber fanning from diffusion-weighted MRI. Neuroimage. 2012;60:1412–1425. doi: 10.1016/j.neuroimage.2012.01.056. [DOI] [PMC free article] [PubMed] [Google Scholar]
- Sotiropoulos SN, Chen C, Dikranian K, Jbabdi S, Behrens TEJ, Van Essen DC, Glasser MF. Comparison of diffusion MRI predictions and histology in the macaque brain; Salt Lake City. Proceedings of the International Society for Magnetic Resonance in Medicine (ISMRM) Annual Meeting; 2013a. p. 835. [Google Scholar]
- Sotiropoulos SN, Jbabdi S, Andersson JL, Woolrich MW, Ugurbil K, Behrens TEJ. RubiX: Combining Spatial Resolutions for Bayesian Inference of Crossing Fibres in Diffusion MRI. IEEE Transactions in Medical Imaging. 2013b doi: 10.1109/TMI.2012.2231873. [DOI] [PMC free article] [PubMed] [Google Scholar]
- Sotiropoulos SN, Moeller S, Jbabdi S, Xu J, Andersson JL, Auerbach EJ, Yacoub E, Feinberg DA, Setsompop K, Wald LL, Behrens TE, Ugurbil K, Lenglet C. Effects of image reconstruction on fiber orientation mapping from multichannel diffusion MRI: Reducing the noise floor using SENSE. Magnetic Resonance in Medicine in press; 2013c. [DOI] [PMC free article] [PubMed] [Google Scholar]
- Stejskal EO, Tanner JE. Spin Diffusion Measurements: Spin Echoes in the Presence of a Time-Dependent Field Gradient. Journal of Chemical Physics. 1965;42 288-+ [Google Scholar]
- Theodoridou ZD, Triarhou LC. Challenging the supremacy of the frontal lobe: early views (1906–1909) of Christfried Jakob on the human cerebral cortex. Cortex. 2012;48:15–25. doi: 10.1016/j.cortex.2011.01.001. [DOI] [PubMed] [Google Scholar]
- Tournier JD, Calamante F, Connelly A. Robust determination of the fibre orientation distribution in diffusion MRI: non-negativity constrained super-resolved spherical deconvolution. Neuroimage. 2007;35:1459–1472. doi: 10.1016/j.neuroimage.2007.02.016. [DOI] [PubMed] [Google Scholar]
- Tournier JD, Calamante F, Gadian DG, Connelly A. Direct estimation of the fiber orientation density function from diffusion-weighted MRI data using spherical deconvolution. Neuroimage. 2004;23:1176–1185. doi: 10.1016/j.neuroimage.2004.07.037. [DOI] [PubMed] [Google Scholar]
- Tuch DS. Q-ball imaging. Magn Reson Med. 2004;52:1358–1372. doi: 10.1002/mrm.20279. [DOI] [PubMed] [Google Scholar]
- Tuch DS, Reese TG, Wiegell MR, Makris N, Belliveau JW, Wedeen VJ. High angular resolution diffusion imaging reveals intravoxel white matter fiber heterogeneity. Magn Reson Med. 2002;48:577–582. doi: 10.1002/mrm.10268. [DOI] [PubMed] [Google Scholar]
- Ugurbil K, Xu J, Auerbach EJ, Moeller S, Vu A, Duarte-Carvajalino JM, Lenglet C, Wu X, Schmitter S, Van de Moortele PF, Strupp J, Sapiro G, De Martino F, Wang D, Harel N, Garwood M, Chen L, Feinberg DA, Smith SM, Miller KL, Sotiropoulos SN, Jbabdi S, Andersson JL, Behrens TE, Glasser MF, Van Essen DC, Yacoub E for the WU-Minn HCP Consortium. Pushing spatial and temporal resolution for functional and diffusion MRI in the Human Connectome Project. NeuroImage Special Issue "Mapping the Connectome". 2013 doi: 10.1016/j.neuroimage.2013.05.012. In press. [DOI] [PMC free article] [PubMed] [Google Scholar]
- Van Essen DC, Jbabdi S, Sotiropoulos SN, Chen C, Dikranian K, Coalson T, Harwell J, Behrens TE, Glasser MF. Mapping Connections in Humans and Nonhuman Primates: Aspirations and Challenges for Diffusion Imaging. In: Johansen-Berg H, Behrens TE, editors. Diffusion MRI: From quantitative measurement to in-vivo neuroanatomy. 2nd Edition. Academic Press; 2013a. in press. [Google Scholar]
- Van Essen DC, Smith SM, Barch DM, Behrens TE, Yacoub E, Ugurbil K for the WU-Minn HCP Consortium. The WU-Minn Human Connectome Project: An Overview. NeuroImage Special Issue "Mapping the Connectome". 2013b doi: 10.1016/j.neuroimage.2013.05.041. In press. [DOI] [PMC free article] [PubMed] [Google Scholar]
- Van Essen DC, Ugurbil K, Auerbach E, Barch D, Behrens TE, Bucholz R, Chang A, Chen L, Corbetta M, Curtiss SW, Della Penna S, Feinberg D, Glasser MF, Harel N, Heath AC, Larson-Prior L, Marcus D, Michalareas G, Moeller S, Oostenveld R, Petersen SE, Prior F, Schlaggar BL, Smith SM, Snyder AZ, Xu J, Yacoub E. The Human Connectome Project: a data acquisition perspective. Neuroimage. 2012;62:2222–2231. doi: 10.1016/j.neuroimage.2012.02.018. [DOI] [PMC free article] [PubMed] [Google Scholar]
- Wansapura JP, Holland SK, Dunn RS, Ball WS., Jr. NMR relaxation times in the human brain at 3.0 tesla. J Magn Reson Imaging. 1999;9:531–538. doi: 10.1002/(sici)1522-2586(199904)9:4<531::aid-jmri4>3.0.co;2-l. [DOI] [PubMed] [Google Scholar]
- Wedeen VJ, Hagmann P, Tseng WY, Reese TG, Weisskoff RM. Mapping complex tissue architecture with diffusion spectrum magnetic resonance imaging. Magn Reson Med. 2005;54:1377–1386. doi: 10.1002/mrm.20642. [DOI] [PubMed] [Google Scholar]
- Wu YC, Alexander AL. Hybrid diffusion imaging. Neuroimage. 2007;36:617–629. doi: 10.1016/j.neuroimage.2007.02.050. [DOI] [PMC free article] [PubMed] [Google Scholar]
- Yablonskiy DA. Quantitation of intrinsic magnetic susceptibility-related effects in a tissue matrix. Phantom study. Magn Reson Med. 1998;39:417–428. doi: 10.1002/mrm.1910390312. [DOI] [PubMed] [Google Scholar]
- Zhang H, Schneider T, Wheeler-Kingshott CA, Alexander DC. NODDI: practical in vivo neurite orientation dispersion and density imaging of the human brain. Neuroimage. 2012;61:1000–1016. doi: 10.1016/j.neuroimage.2012.03.072. [DOI] [PubMed] [Google Scholar]


