

Abstract
We report a new class of thiophene (TP) compounds that kill Mycobacterium tuberculosis (Mtb) by the novel mechanism of Pks13 inhibition. An F79S mutation near the catalytic Ser-55 site in Pks13 conferred TP-resistance in Mtb. Over-expression of wild-type pks13 resulted in TP-resistance and over-expression of the F79S pks13 mutant conferred high-level resistance. In vitro, TP inhibited fatty acyl-AMP loading onto Pks13. TP inhibited mycolic acid biosynthesis in wild-type Mtb, but to a much lesser extent in TP-resistant Mtb. TP treatment was bactericidal and equivalent to the first-line drug isoniazid, but it was less likely to permit emergent resistance. Combined isoniazid and TP treatment exhibited sterilizing activity. Computational-docking identified a possible TP-binding groove within the Pks13 ACP domain. This study confirms that Mtb Pks13 is required for mycolic acid biosynthesis, validates it as a druggable target and demonstrates the therapeutic potential of simultaneously inhibiting multiple targets in the same biosynthetic pathway.
INTRODUCTION
The emergence of drug-resistant Mycobacterium tuberculosis (Mtb) is rapidly becoming a major global health concern1,2. The current pace of drug development is too slow to meet the clinical requirement for new anti-tuberculosis agents. Despite identification of several essential genes and pathways3, along with significant progress in the understanding of Mtb biochemistry and metabolism, few new drug targets have been validated. It is a well known fact that all essential metabolic processes do not represent good drug targets4–6. However, decades of drug development have proven that the bacterial cell wall is a rich source of druggable targets7–10. In the case of Mtb, isoniazid (INH), ethambutol (EMB), and ethionamide (ETH) all inhibit cell wall biosynthesis.
Mycolic acids are essential components of the mycobacterial cell wall. They are critical for the pathogenesis of Mtb and have been shown to be important in virulence and persistence in vivo11–13. Mycolic acids are C60–C90 branched-chain β-hydroxylated fatty acids that are covalently bound to arabinogalactan-peptidoglycan forming the mycolyl-arabinogalactan peptidoglycan complex (mAGP)14. They are also found non-covalently associated to the outer membrane as trehalose monomycolates (TMM) and trehalose dimycolates (TDM)15–17 or as free lipids in mycobacterial biofilms18. Pks13 plays a critical role in mycolic acid biosynthesis in Mtb19,20 by joining the α-alkyl C26 fatty acid branch (originating from FAS-I) and the meromycolic acid (C48–C64)13 branch (originating from FAS-II) activated by FadD3221 through Claisen-type condensation reaction to form α-alkyl β-ketoacids. Pks13 belongs to the type I polyketide synthase (PKS) gene family and is essential for survival of Mycobacterium smegmatis but not for Corynebacterium glutamicum20. Mtb Pks13 contains ACP domains located at the N-terminus (N-ACP) and C-terminus (C-ACP), a ketoacyl synthase (KS), an acyl transferase (AT) and a thioesterase (TE) domain19,20. The ACP domains contain 4′-phosphopantetheine attachment (P-pant) sites at Ser-55 and Ser-1266 respectively. For Pks13 to perform a condensation reaction, a meromycolic acid is converted to a meromycoloyl-AMP and loaded onto the P-pant binding site at N-ACP of Pks13 by FadD32, a fatty acyl-AMP ligase21. The meromycoloyl-AMP is then transferred to the KS domain and Pks13 completes the condensation reaction in a series of steps outlined in Supplementary results, Supplementary Fig. 119.
Although the role of Pks13 has not been confirmed in vivo in Mtb, an activated recombinant Mtb Pks13 can catalyze fatty acid chain condensing activity in vitro19 and the Mtb operon containing accD4, pks13 and fadD32 genes is essential20,22,23. Herein, we identified and investigated the mechanism of action of a novel class of thiophene (TP) compounds with whole-cell activity against Mtb, and determined that they act by selectively inhibiting Pks13. Two inhibitors of this class were used to decipher the microbiological and biochemical consequences of Pks13 inhibition, to explore their potential as drug leads, and to characterize the structural requirements for activity against Mtb.
RESULTS
Whole-cell screen for new Mtb cell wall inhibitors
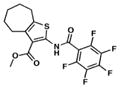
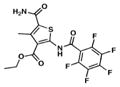
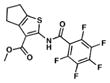
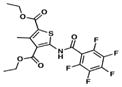
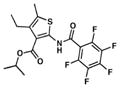
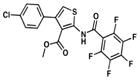
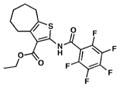
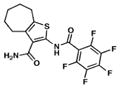
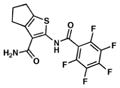
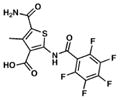
We searched for novel inhibitors of mycobacterial cell wall biosynthesis with the goal of identifying new drug targets and new classes of inhibitors with potent activity against Mtb. To search for inhibitors, we screened for compounds that induced expression of the Mtb iniBAC operon promoter (piniBAC, Supplementary Table 1). The iniBAC gene cluster is highly induced by a broad range of cell wall biosynthesis inhibitors24. We screened a library of 1,113 publically available compounds with known activity against Mtb on a whole-cell basis25,26. Interrogating experimental controls, the piniBAC screen correctly identified the known piniBAC inducers INH and EMB. Compounds that had a four-fold or greater induction were then selected for further study, resulting in the identification of a number of thiophene (TP) analogues (Table 1). Structural analogues of SQ109, another known inducer of piniBAC, were also identified27. The minimal inhibitory concentrations (MIC) of the TPs against Mtb H37Rv ranged from 0.5 μM to 20.2 μM, with TP2 and TP4 being among the most active. The three most potent compounds against Mtb (MIC values 0.5–1.0 μM), TP2, TP4 and TP626, also exhibited the largest fold inductions of the iniBAC reporter (10.1–14.6). Importantly, TP2 and TP4 were equally active against laboratory, clinical drug-susceptible and clinical multi drug-resistant (MDR) Mtb strains (Table 2). All non-tuberculous mycobacteria (NTM) tested were highly resistant to TP2, including M. smegmatis (Supplementary Table 2). Structure-activity relationship (SAR) analysis indicated that replacement of the pentafluorophenyl amide in these most potent hits with a 2-fluorophenylamide or 4-methylphenylamide (TP2 to TP175 or TP197) resulted in losses of ≥20-fold the MIC versus Mtb (Table 1). Exchange of the 3-alkyl ester for a primary amide (TP2 to TP953) was not tolerated nor was the carboxylic acid functionality (TP4 to TP1735). Transposition of the 3-ester and 5-amide functionalities (TP4 to TP238) also caused a ten-fold loss of whole-cell activity.
Table 1.
Thiophenes: structures, MICs against Mtb and piniBAC induction levels.
| Compound | Structure | MIC (μM) | piniBAC Fold Induction |
|---|---|---|---|
| 1. TP2 |
|
1.0 | 14.6 |
| 2. TP4 |
|
0.5 | 10.8 |
| 3. TP238 |

|
4.9 | 10.1 |
| 4. TP506 |
|
2.1 | 8.6 |
| 5. TP338 |
|
7.1 | 8.8 |
| 6. TP626 |
|
1.0 | 10.1 |
| 7. TP464 |
|
3.5 | 4.3 |
| 8. TP514 |
|
1.9 | 8.2 |
| 9. TP953 |
|
15.3 | 2 |
| 10. TP584 |
|
10.6 | 0.8 |
| 11. TP175 |
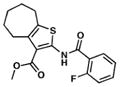
|
20.2 | 1.4 |
| 12. TP197 |
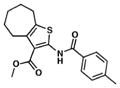
|
>20.2 | 1 ND |
| 13. TP1735 |
|
78.4 | 1 ND |
| 14. EMB |
|
7.2 | 14–39 |
| 15. INH |
|
0.2 | 11–18 |
| 16. DA5 |

|
10 | 21 |
Fold induction of piniBAC was determined by the OD420 of compounds divided by the OD420 of without drug controls. Ethambutol (EMB) and Isoniazid (INH) were used as controls.
ND: Not determined.
Table 2.
Lead thiophene MICs versus drug-susceptible and drug-resistant and Pks13 over-expressing strains of Mtb and M. bovis.
| Strain | Drug resistance | Strain type | TP2 (μM) | TP4 (μM) | INH (μM) |
|---|---|---|---|---|---|
| H37Rv | No | lab | 1.0 | 0.5 | 0.2 |
| 210 | No | clinical | 1.0 | 0.5 | 0.2 |
| 692 | No | clinical | 1.0 | 0.5 | 0.2 |
| 91 | RIF, EMB | clinical | 1.0 | 0.5 | 0.4 |
| 36 | INH, RIF, EMB | clinical | 1.0 | 0.9 | >23.3 |
| 116 | INH, EMB, PAS | clinical | 1.0 | 0.5 | >23.3 |
| 31 | INH, RIF, EMB, KAN, SM, CAP | clinical | 1.0 | 0.5 | >23.3 |
| DRM2 | TP2, TP4 | lab | 3.8 | 1.9 | 0.2 |
| H37Rv-ΔkatG | INH | lab | 1.0 | 0.5 | >1400 |
| H37Rv-PmabAinhA | INH | lab | 1.0 | 0.5 | 5.8 |
| H37Rv | No | lab | 2.0 | 1.0 | 0.4 |
| H37Rv::pMV306H | HYG | lab | 2.0 | 1.0 | 0.4 |
| H37Rv::pMV306H-pks13 | HYG | lab | 4.0 | 2.0 | 0.4 |
| H37Rv::pMV306H-pks13_F79S | HYG | lab | 64.0 | 4.0 | 0.4 |
| DRM2 | TP2, TP4 | lab | 8.0 | 2.0 | 0.4 |
| DRM2::pMV306H | HYG | lab | 8.0 | 2.0 | 0.2 |
| DRM2::pMV306H-pks13 | HYG | lab | 16.0 | 2.0 | 0.4 |
| DRM2::pMV306H-pks13_F79S | HYG | lab | 64.0 | 8.0 | 0.4 |
| mc27000 pMK1 | KAN | lab | 1.25 | 0.6 | 0.4 |
| mc27000 pMK1-pks13 | KAN | lab | 6.25 | 6.25 | 0.2 |
| BCG pMK1 | KAN | lab | 0.6 | 0.2 | ND |
| BCG pMK1-pks13 | KAN | lab | >2.4 | >1.2 | ND |
| BCG pVV16 | HYG | lab | 0.6 | 0.2 | ND |
| BCG pVV16-pks13 | HYG | lab | >1.2 | >0.6 | ND |
EMB – Ethambutol; RIF – Rifampicin; INH – Isoniazid; KAN – Kanamycin; SM – Streptomycin; CAP - Capreomycin; PAS - Para-aminosalicylic acid; HYG-Hygromycin and ND –not determined. MICs for H37Rv ΔkatG and H37Rv PmabAinhA were performed in liquid media31. The MICs in shaded rows were determined by micro-dilution method in 96-well plate. BCG and mc27000 MICs were determined by spotting on agar-plates. All other MICs were determined by BACTEC.
Isolation of resistant mutants and whole-genome sequencing
Mtb cultures (107 cells) were plated on solid agar containing 4× and 8× the MIC of TP2 or TP4. One mutant (DRM2) obtained on the 4× TP2 plate had a four-fold increase in MIC to TP2 in liquid media (3.8 μM) (Table 2). DRM2 also had a four-fold increase in MIC to TP4 (1.9 μM), indicating an overlapping target with TP2; however, we failed to directly isolate resistant mutants by plating on TP4. Whole-genome sequencing of DRM2 revealed a solitary T236C single nucleotide polymorphism (SNP) in the pks13 (Rv3800c) gene, which produced a Phe79Ser (F79S) substitution.
TP-resistance in Pks13 over-expressing M. bovis and Mtb
Over-expressing a gene encoding a drug target is expected to generate an increase in the MIC for that drug9. Therefore, to determine whether Pks13 is involved in TP2 and TP4 activity, we over-expressed wild-type Mtb Pks13 (Pks13_WT) in Mycobacterium bovis BCG using two multi-copy plasmids expressing Pks13 with either a C-terminus (pVV16-pks13) or N-terminus (pMK1-pks13) his6 tag driven by the hsp60 promoter. Pks13 expression from pMK1-pks13 was confirmed (Supplementary Fig. 2a). This strain exhibited a four to six-fold increase in MIC to both TP2 and TP4 (Table 2). Results were similar when Pks13 was expressed from pVV16-pks13 (Table 2). Comparable resistance levels to TP2 and TP4 were observed in Mtb mc27000 carrying pMK1-pks13 (Table 2). We were unable to stably express Pks13 in Mtb H37Rv or DRM2 from multi-copy plasmids. Therefore, we constructed integrative plasmids to express Pks13_WT and the mutant Pks13 (Pks13_F79S) under the hsp60 promoter (H37Rv::pMV306H-pks13 and H37Rv::pMV306H-pks13_F79S, respectively). The over-expression of Pks13 proteins was verified by SDS-PAGE (Supplementary Fig. 2b). Over-expression of Pks13_WT in H37Rv resulted in only a two-fold increase in resistance to TP2. However, over-expression of the TP-resistant Pks13_F79S mutant resulted in very high-level resistance to TP2 (64 μM) in both H37Rv (H37Rv::pMV306H-pks13_F79S), and DRM2 (DRM2::pMV306H-pks13_F79S). These results closely parallel a previous study that validated embB as the target of ethambutol in Mtb28. Resistance to TP4 was also increased, although at a lower level (4-fold in H37Rv and 8-fold in DRM2). Importantly, over-expression of Pks13 failed to increase resistance to unrelated drugs such as INH, ethambutol, rifampicin, DA5 (a recently identified MmpL3 inhibitor27), or cephalexin (Table 2 and Supplementary Table 3), thus highlighting the specificity of the TP inhibitory mechanism.
TP2/TP4 inhibit mycolic acid biosynthesis in Mtb
To test whether treatment with TP2 or TP4 alters mycolic acid synthesis in Mtb through Pks13 inhibition, H37Rv and the TP2-resistant mutant strain (DRM2), were either treated with increasing concentrations of TP2, TP4, or the control anti-TB drugs INH and ciprofloxacin, prior to labeling the cultures with 14C-acetate. Radiolabeled total lipids were then extracted, methyl esterified and analyzed by thin layer chromatography (TLC)/autoradiography. Treatment with either TP2 or TP4 suppressed all mycolic acid methyl esters (MAMEs; α-, methoxy- and keto-) in wild-type Mtb starting at a concentration of 0.5× MIC. Complete suppression of mycolic acid synthesis occurred at higher concentrations with concomitant accumulation of fatty acid methyl esters (FAMEs, Fig. 1a and Supplementary Fig. 3a). In contrast to their effect on H37Rv, neither TP2 nor TP4 showed substantial suppression of mycolic acid biosynthesis in the DRM2 strain, except for TP4 at very high concentrations (125× MIC). As expected, mycolic acid synthesis was also inhibited by INH (Fig. 1b), but not by the DNA gyrase inhibitor ciprofloxacin29 (CIP) used as a control (Supplementary Fig. 3b). The FAMEs from TP-treated cultures were further analyzed by reverse phase-TLC (Fig. 1c and d). This analysis showed accumulation of all fatty acids upon treatment with TP2 including C16, C18, C20 as well as C26 fatty acid a FAS-I end-product, which is also a Pks13 substrate. The exact chain lengths of the compounds observed on RP-TLC were determined by their co-migration (identical Rf values) with synthetic FAMEs as shown in the Supplementary Fig. 4. Furthermore, analysis of polar lipids upon treatment with TP2 showed a decline in the levels of TMM and TDM, similar to the effect of INH and consistent with Pks13 inhibition (Fig. 1e and f, Supplementary Fig. 5). In contrast, DA5 suppressed only TDM, and ethambutol resulted in a slight accumulation of both as expected27 (Fig. 1e and f). To further confirm the specificity of TPs, we also examined the apolar lipid fraction of H37Rv treated with up to 20× the MIC of TP2. A comprehensive analysis of extractable lipids (Fig. 1 e–f and Supplementary Fig. 6) did not reveal loss of other lipids such as PDIMs or sulfolipid-1. Together, with the over-expression results, these findings strongly suggest that the anti-TB activity of TP2 and TP4 occurs via inhibition of Pks13 and mycolic acid biosynthesis.
Figure 1. Effect of Thiophene 2 and 4 on mycolic acid biosynthesis in Mtb.

(a, b) Normal-phase TLC analysis of MAMEs/FAMEs from wild-type Mtb (H37Rv) and the TP-resistant Mtb (DRM2) after treatment with increasing concentration of TP2 (a) or isoniazid (b) (INH). Equal counts were loaded and the TLC was developed using hexane/ethyl acetate (19:1, v/v, 2 runs) solvent system. Similar TLCs upon TP4 or Ciprofloxacin treatment are shown in Supplementary Fig. 3. (c, d) Reverse-phase TLCs using acetonitrile/dioxane solvent (1:1, v/v and equal volumes of samples) showing the fatty acid chain length of the FAS-I derived products following treatment with TP2, INH or DA5 from H37Rv (c) or DRM2 (d). Cold methyl esters of fatty acids were used as standards as shown in Supplementary Fig. 4. (e–f) Normal-phase TLCs showing TMM (TM) and TDM (TD) from polar lipids extracted from H37Rv (e) or DRM2 (f) upon treatment with increasing concentrations of TP2, or 5× MIC of INH (H), DA5 (D), or ethambutol (E). Equal volume (5 μl) of each sample was analyzed on a silica gel 60 F254, developed with CHCl3/CH3OH/H2O (62:25:4, v/v/v).
TPs inhibit FadD32-dependent loading onto N-ACP of Pks13
Our observation that the TP-resistant DRM2 strain had a F79S mutation near the essential residue of the Pks13 N-ACP domain suggested that TP compounds act by interfering with this site. We postulated that TP compounds block loading of the meromycoloyl chain onto the Pks13 N-ACP domain. We purified Pks13_WT and Pks13_F79S by co-expressing with the Bacillus subtilis sfp gene19 to ensure phosphopantetheinylation at Ser-55 (confirmed by nano-LC-MS/MS analysis which showed a 340 Da increase in mass, Supplementary Fig. 7). The N-ACP loading step is FadD32-dependent21 and has been previously demonstrated using 14C-labeled C12 (lauric acid) and C16 (palmitic acid) fatty acids as substrates19. We developed a non-radioactive assay to measure meromycoloyl loading using a fluorescent analog of palmitic acid (BODIPY® FL C16). The loading of FL C16 onto Pks13 was specific and FadD32 dependent as demonstrated by the observations that negative controls BSA, NS5B and heat inactivated proteins failed to load FL C16 onto Pks13. Furthermore, we showed that the phosphopantetheinylation of Pks13 was required for FL C16 loading (Supplementary Fig. 8). We next examined whether the TP compounds inhibited FL C16 loading onto Pks13. The results showed that TP2 inhibited loading of Pks13_WT in a dose-dependent manner (Fig 2a). TP2 also inhibited FL C16 loading onto the TP-resistant F79S mutant protein (Fig. 2b). The difference in the ability of TP2 to inhibit loading of the wild-type Pks13 versus the F79S mutant was modest, but it was most noticeable at equimolar concentrations (1 μM) of protein and inhibitors. Similar inhibition kinetics were observed with TP4 (Supplementary Fig. 9a–c). In contrast, TP1735, which had some of the poorest activity against live Mtb, also failed to inhibit loading on either Pks13_WT or Pks13_F79S (~10% inhibition against Pks13-WT and no inhibition against Pks13_F79S). M. smegmatis is highly resistant to the TPs (MIC >128 μM), and purified M. smegmatis Pks13 (MsmPks13) was also highly resistant to inhibition of FL C16 loading by TP2 (Fig. 2c), although this comparison was best appreciated from the inhibition curves (Fig. 2d). We also ruled out any potential direct inhibition of FadD32 activity by TP2 or TP4 (Supplementary Fig. 10)30 Overall, these data further support our in vivo findings that TP compounds specifically and directly target Mtb Pks13.
Figure 2. Inhibition of fatty acyl-AMP loading onto purified Pks13 by TP2.
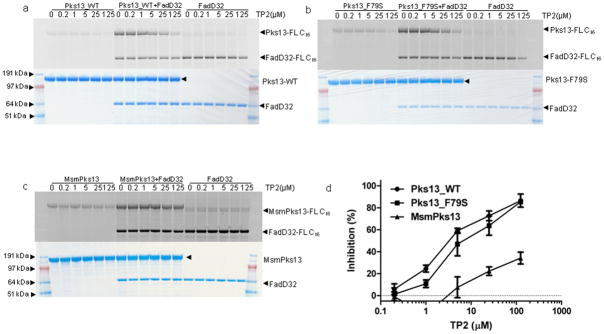
The loading of FadD32-activated FL C16 on Pks13_WT (a), Pks13_F79S (b) and MsmPks13 (c) was determined by separating the reaction mixtures on SDS-PAGE gels. Activities were determined by measuring in-gel fluorescence (top panels of a, b and c) and total protein by coomassie blue staining (bottom panels of a, b and c). SeeBlue Plus2 Pre-stained marker (Invitrogen) was used as molecular weight standard and approximate molecular weights in MOPS running buffer are indicated. The loading of FL C16 on Pks13_WT (a), Pks13_F79S (b) and MsmPks13 (c) was quantified using ImageQuant 5.2 (GE healthcare) and quantitation from 5-replicates (mean ± SD) each was used to generate inhibition curve (d). The full length images corresponding to these figures are shown in Supplementary Fig. 14.
Lack of cross resistance between the TP compounds and INH
Although INH does not share structural similarities to the TP class of compounds (Table 1), INH behaves like the TPs in that it is a strong inducer of piniBAC and a potent inhibitor of mycolic acid biosynthesis at the InhA step in the FAS-II pathway. We therefore tested for cross-resistance between INH, TP2 and TP4 to confirm that these compounds inhibited different molecular targets. MIC values were determined against H37Rv-ΔkatG31, an Mtb strain where the gene encoding the activator of INH, katG, was deleted and is therefore deficient in INH activation. MICs were also determined against H37Rv PmabAinhA (mc24914)9, an Mtb strain that is INH-resistant due to a promoter-up mutation (c15t) in inhA, the gene encoding the INH target. Although each of these mutants were highly resistant to INH, neither of them showed an increase in MIC to TP2 or TP4 (Table 2). INH MICs values were also quantified for the TP-resistant mutant DRM2 and no increase in INH MIC was noted compared to wild-type controls (Table 2). The lack of cross-resistance between INH-resistant and TP-resistant mutants provides further confirmation that these two compounds involve different mechanisms of action within the mycolic acid biosynthetic pathway: INH by targeting InhA and TPs by targeting Pks13.
TP2/TP4 in combination with INH/RIF enhanced Mtb killing
It is not known whether inhibition of two distinct targets within the same mycolic acid biosynthesis pathway will have synergistic or antagonistic effects. The availability of TP compounds made it possible to investigate this question. MIC values of Mtb treated with varying concentrations of INH and either TP2 or TP4 were measured using a checkerboard format32. Neither synergy nor antagonism were noted when the MIC was used as the measure of a combined drug effect (Supplementary Fig. 11). We then determined whether the TP compounds were synergistic with INH with regard to bactericidal activity (as opposed to MIC). For this study, we treated actively growing Mtb cultures with TP2, TP4, INH or rifampicin (RIF) alone, or with varying combinations of these drugs. Killing was studied in liquid cultures by performing daily measurements of bacterial metabolic activity (growth index or GI) in the BACTEC 460TB system33,34 (Fig. 3a and b) or by plating for colony forming units (CFU) (Fig. 3c). We found that TP4 killed Mtb at rates similar to INH using metabolic activity measured by GI, while killing by TP2 was somewhat slower. Measured by CFU viability, TP2 and TP4 killed at slightly slower rates than INH during the initial time points; however by seven days, both TP compounds showed better killing than INH. This effect persisted out past 20 days (Fig. 3a and c).
Figure 3. Bactericidal Activity of TP2, TP4 and other anti-TB drugs against Mtb.

Killing curves of Mtb strain, H37Rv after incubation with TP2, TP4, isoniazid (INH), rifampicin (RIF) or various combinations of these drugs. Killing activity was monitored using the BACTEC 460TB method at 5× the MIC for all drug compounds (a and b) or by plating for CFU (c) after incubation at 5× and 10× (as indicated) the MIC. “ϕ” indicates out of range growth. The arrows indicate the time when drugs were added to the cultures (a and b); for panel c drugs were added on day zero. The data represented (mean ± SD) is from two independent experiments performed in triplicates.
The GI and CFU of INH-treated cultures typically increase after a brief period of decline due to the rapid emergence of INH-resistant clones35–39. The same phenomenon was observed in our study for INH. In contrast, the GI of cultures treated with the TP2 compounds continued to fall, although viable cells were still detected after 30 days of treatment (Fig 3a). The CFU of TP treated cultures also continued to fall for at least seven days after INH treated CFU began to recover (Fig 3c). TP treated cultures did not begin to show an increase in CFU until 20 days after the compounds had been added to the growth media. Furthermore, while approximately half of the re-growth in INH treated cultures was due to INH-resistant clones (56% resistant to 1 μM of INH or 5× the wild-type INH MIC), only a small fraction of the growth in extensively TP-treated cultures were TP-resistant (9.7% TP2-resistant to 5 μM of TP2, or 5× the wild-type MIC; 1.7% TP4-resistant to 2.5 μM of TP4 or 5× the wild-type MIC). RIF caused more rapid and complete killing than the other compounds. Examining the effect of combined treatment, we noted that cultures treated with both INH and a TP compound showed initial killing rates that were moderately faster than cultures treated with either drug alone (Fig. 3c). Furthermore, the killing curves of the dual-compound treated cultures continued to decrease over time until both GI and CFU became undetectable (Fig. 3b and c). By the end of the culture period, all of the cells treated with INH plus TP2 or INH plus TP4 appeared to be sterile. Treatment with TP2 or TP4 plus RIF produced killing rates equivalent to INH plus RIF. Adding TP2 or TP4 to INH and RIF treatment did not result in a further enhancement in killing. However, no antagonism was noted.
Cytotoxicity and intracellular activity
Several studies were performed to assess the suitability of the TP family as potential drug leads. TP2 was shown to have an IC50 versus monkey kidney Vero cells40 and human liver carcinoma HepG2 cells41 of 17.5 and 7.30 μM, respectively, corresponding to selectivity indexes (SIs) of 17 and 7.3. Mtb is an intracellular pathogen that resides within host macrophages; therefore we studied the efficiency of TP compounds using a macrophage infection model. Significant intracellular killing activity (90 % killing) within BCG-infected J774A.1 macrophage cells40 was observed at TP2 and TP4 concentrations of 12.8 μM and 6.4 μM, respectively, (Supplementary Fig. 12). Overall, these results suggest that the TP compounds display properties suitable for a drug lead, but further work will be needed to increase the potency of these compounds.
A possible TP-binding groove on the N-ACP domain of Pks13
To explore the structural basis of Pks13 inhibition by the TP compounds, we performed computational docking42,43 studies with a comparative model44 of the Pks13 N-ACP domain (Supplementary Fig. 13a). The vast majority of the lowest free energy binding modes for the compounds listed in Table 1 positioned them in a deep largely neutral and hydrophobic groove separating Ser-55 (P-pant site) and Phe-79 whose mutation to Ser in DRM2 confers resistance to TP2 and TP4 (Supplementary Fig. 13a). In fact, most of the computationally determined binding modes placed the TP compounds in van der Waals contact with Phe-79, which forms the central portion of one face of the TP compound-binding groove. Substituting serine for Phe-79 replaces a bulky aromatic hydrophobic side-chain with a smaller polar hydrophilic side-chain that would alter the hydrophobicity and shape of the TP binding groove by lowering the height of one face (Supplementary Fig. 13b and c). Thus, the results of the docking studies provide a plausible binding site for TP2 and TP4 as well as a reasonable structural explanation for the resistance of the Pks13_F79S mutant to these compounds.
DISCUSSION
Here, we demonstrate that the TP compounds inhibit Mtb Pks13, an enzyme involved in a critical step of mycolic acid biosynthesis, establishing it as a vulnerable target for drug development. In this study, i) we isolated a TP-resistant mutant (DRM2) with a single SNP, introducing a F79S mutation in Pks13; ii) consistent with these findings, computational modeling placed this mutation in close physical proximity to the P-pant attachment site (Ser-55) involved in loading of meromycoloyl-AMPs by FadD3219; iii) Pks13_WT over-expression in Mtb H37Rv led to moderate increases in TP2 MIC and over-expression of the Pks13_F79S mutant caused high-level resistance; iv) we found that TP2 and TP4 treatment inhibited mycolic acid biosynthesis with the concomitant accumulation of mycolic acid precursors produced by FAS-I in a dose-dependent manner in Mtb H37Rv, while discernible mycolic acid inhibition required substantially higher TP concentrations in the TP-resistant DRM2 mutant; and v) TP compounds effectively inhibit the binding of FadD32-activated FL-C16 onto Pks13 in vitro of TP-susceptible Mtb, but inhibition is diminished in the presence of Pks13 derived from TP-resistant Mtb, or from highly TP-resistant M. smegmatis.
The identification of Pks13 inhibitors allowed us to explore, for the first time, the consequences of Pks13 inhibition in Mtb and to establish Pks13 as a druggable target. We noted that TP4 and INH displayed almost identical killing curves in vitro. Both compounds appeared to leave an unaffected persister population. In the case of INH, study of these persisters has been complicated by the rapid emergence of INH resistant clones that are either amplified from a pool of pre-existing mutants or generated by INH treatment35–39. TP2 and TP4 also generated resistant mutants, albeit to a much lower extent. Our plating studies confirmed that both INH and TP-treated cultures also contained drug-susceptible persisters. Interestingly, treatment with a combination of INH and TP compounds caused not only large decreases in cell viability but also appeared to kill persisters, leading to sterilization of the cultures. This is particularly remarkable because it suggests that treatment with two drugs that target different steps in the same metabolic pathway can overcome both persistence and drug resistance that develop in the presence of a single antitubercular agent. We also noted that TP2 was inactive against most NTM. However, this is consistent with previous studies showing that several drugs inhibiting mycolic acid biosynthesis in Mtb, including INH or isoxyl are less or even totally inactive against M. smegmatis45,46. TP2 was also inactive against C. glutamicum (a strain in which pks13 is dispensable) and C. diptheriae, further underlining TP2 specificity for Pks13 (Supplementary Table 2).
Although the TP compounds characterized so far have profiles that suggest they are suitable drug leads, their antitubercular activity, intracellular activity and cytotoxicity profile need to be further improved. Our mutation analysis, combined with SAR studies and computational modeling studies, suggests a route for drug optimization. Moreover, our simple and rapid in vitro FL C16 assay, validated with TP2 and TP4, makes it possible to easily screen for other Pks13 inhibitors or TP-analogues with improved potency. Complementing this in vitro assay, the in vivo piniBAC induction assay can be used to screen for whole-cell activity.
The F79S TP-resistance producing mutation in the DRM2 strain falls within the Pks13 N-ACP domain near the P-pant site (Ser-55), which has been shown to be essential for loading meromycoloyl-AMPs by FadD32 (Supplementary Fig. 1, Step 2). We propose that TP2 and TP4 compromise the loading of meromycolyl-AMPs onto the Pks13 N-terminal P-pant site. Our in vitro studies showing that TP inhibits FL C16 loading onto wild-type Pks13 strongly support this hypothesis. The data is also consistent with our computational docking analyses in which the binding groove for TP2 is in between the P-pant site at Ser-55 and Phe-79. Furthermore, virtually all of the TP compounds we modeled displayed a qualitatively better fit for the wild-type protein (Phe-79) than the DRM2 mutant (Ser-79). Interestingly, the TP binding groove identified in our computational studies was previously proposed to be an acyl chain binding site on E. coli butyryl-ACP47 and a P-pant binding site on Bacillus subtilis ACP48. It was hypothesized that the acyl chain interaction with the groove could protect the chain during cycles of fatty acid synthesis47. We speculate that the P-pant or acyl chain could interact with the Pks13 N-ACP domain, and that TP binding could function at least in part to displace the P-pant or acyl chain from the groove, hence affecting Pks13 activity.
This study was enabled by the discovery that certain TP compounds inhibit Pks13. Starting with a series of compounds shown to have bactericidal activity in a whole-cell Mtb screen25 and taking advantage of the observation that piniBAC is induced by a wide variety of compounds that inhibit Mtb cell wall biosynthesis24, we developed a relatively unbiased secondary screen for cell wall biosynthesis inhibitors. This approach already led to the discovery of SQ109 and other MmpL3 inhibitors27,49, as well as the new TP family of compounds reported here. Our discovery of two separate compound classes (DA5 and TP2) that inhibit two distinct steps in mycolic acid biosynthesis (MmpL3 and Pks13 respectively), clearly validates our function-specific promoter screen as a powerful tool for identifying a focused set of drug targets. This promoter will also be useful to characterize modified TP compounds for increased whole-cell activity, given our observed correlation between piniBAC activity and TP potency in our preliminary SAR analysis.
In conclusion, we present here a new mechanism for mycolic acid synthesis inhibition that rapidly leads to mycobacterial cell death. Pks13 appears to be a promising target for drugs to treat tuberculosis. The TP inhibitors that are likely to interfere with the function of the N-ACP domain of Pks13 appear to have desirable properties including additive killing and resistance prevention.
ONLINE METHODS
Bacterial strains, culture conditions, primers and plasmids
Mtb strains were obtained from laboratory stocks. Clinical strains were obtained from a collection of clinical isolates established by UNICEF/UNDP/World Bank/WHO Special Programs for Research and Training in Tropical Diseases (TDR). All Mtb strains were grown at 37 °C in Middlebrook medium 7H9 (Becton Dickinson, Sparks, MD) enriched with 10% oleic acid-albumin-dextrose-catalase (OADC-Becton Dickinson) and 0.05% (wt/v) Tween 80 or Tyloxapol in liquid media. Middlebrook 7H10 agar (Becton Dickinson) supplemented with 10% OADC and 0.5% glycerol (v/v) was used to grow strains on solid media.
Reporter screen for cell wall biosynthesis inhibitors
A total of 1,113 compounds previously identified as having antitubercular activity in a whole-cell screen of a 100,997 compound library25,26 (performed at the Southern Research Institute for the MLPCN and the Tuberculosis Antimicrobial Acquisition and Coordinating Facility program under NIH contracts N01-AI-95364 and N01-AI 15449)25 were tested for their ability to induce the iniBAC promoter (piniBAC). The promoter screen used a BCG strain (BCGS(pG4697-6)) containing the iniBAC promoter sequence fused to a lacZ reporter (pG4697-6)24. The BCGS(pG4697-6) was grown to an OD600 of 0.6 and 90 μl was dispensed into each well of 96-well plates, then 10 μl of each compound (final concentration 1× IC90) was added. After incubation for 24 h at 37 °C, 100 μl of Lac Z buffer (60 mM Na2HPO4·7H2O, 40 mM NaH2PO4·H2O, 10 mM KCl, 1 mM MgSO4·7H2O, 50 mM β-mercaptoethanol), 5 μl of chloroform and 2 μl of 0.1% SDS were added and incubated for 5 min at room temperature (RT). Then, 40 μl of 4 mg/ml of 2-Nitrophenyl β-D-galactopyranoside (Sigma Aldrich, St. Louis, MO) was added to each well and plates were incubated for 15 min. Following incubation, 100 μl of 1M sodium carbonate was added to each well and absorbance was read at 420 nm. Fold induction was determined by the OD420 of compounds/OD420 of without drug controls (Table 1 and Supplementary Table 1). EMB and INH were used as positive controls.
Construction of over-expression strains
For the over-expression of Pks13 variants in mycobacteria, we used pVV1650, pMK151 and pMV306-Hyg52 vectors. All primer sequences and plasmids used in this study are given in Supplementary Tables 4 and 5 respectively.
Minimal Inhibitory Concentration (MIC), synergy and bactericidal activity assays
MICs were determined using the standard radiometric BACTEC 460TB method (Becton Dickinson)33,34. Antibiotics were purchased from Sigma Aldrich and thiophene analogs (Table 1) were purchased by Chembridge except for TP1735 that was synthesized as described below. Compounds were stored as stocks at 20 mg/ml in DMSO. For the BACTEC-based bactericidal activity assays, each vial of 12B media was inoculated with H37Rv at 2×10⁵ CFU and grown to a GI of 200. Test drugs were then added to these vials either singly or in combination. The bottles were incubated at 37 °C and then the GI of each bottle was measured daily. Drug concentrations used for the bactericidal studies were calculated to be approximately 5× the MIC, for INH (1.1 μM), RIF (1.2 μM), TP2 (5.0 μM), and TP4 (2.5 μM) except where noted. The MIC assays in 96-well format were performed using the microdilution method53.
Synthesis of TP1735
Methyl ester (10 mg, 0.0237 mmol) was dissolved in 1.0 ml dioxane and subjected to the addition of aqueous lithium hydroxide (2.0 M solution, 5.0 equiv, 0.118 mmol, 60 μl). The brown, slightly turbid solution was stirred for 2 h at RT and then 2 d at 40 °C. At this point, TLC analysis demonstrated consumption of starting material. The basic solution was washed with 3×5 ml diethyl ether, acidified to ca. pH 1 with 1 N HCl(aq), and extracted with 3×5 ml ethyl acetate. The organics were washed with 5 ml saturated aqueous brine solution, dried over anhydrous magnesium sulfate for 5 min, and concentrated by vacuum to produce 8 mg of white solid. Recrystallization of this crude product from acetone at 0 °C produced analytically pure white crystals in the amount of 3 mg (0.00761 mmol, 33%). 1H NMR (400 MHz, d4-MeOH) δ12.4 (br s, 1), 6.92 (br s, 2), 2.76 (s, 3); 19F NMR (376 MHz, d4-MeOH) δ - 141.8, - 151.8, - 162.8; LC-MS (ES+) - 1.73 min (96% purity @ 215 nm); HRMS : 394.0067 amu; found; expect 394.0067 amu. NMR experiments were performed on a Bruker Avance 400 MHz NMR spectrometer. Low-resolution liquid chromatography-mass spectrometry experiments were achieved with a Shimadzu 2010 LC-MS instrument equipped with an electrospray source. High-resolution mass spectroscopy (HRMS) data were performed on an Agilent Technologies 6210 series Time-of-Flight mass spectrometer coupled to an Agilent Technologies 1200 series High Performance Liquid Chromatography system using no HPLC column.
Isolation of DRM2 and whole-genome sequencing
The TP2-resistant Mtb mutant, DRM2, was isolated by plating ten-fold serial dilutions of liquid cultures at OD600 ~ 1.5 onto 7H10 plates containing 3.8 μM and 7.6 μM of TP2. Plates were screened for resistant colonies after 3–6 weeks at 37 °C. The genomic DNA was isolated54 from DRM2 and subjected to whole-genome sequencing and single nucleotide polymorphism (SNP) analysis27.
Analysis of mycolic acids and other lipids
For the analysis of MAMEs and FAMEs55, the compounds were added to 4 ml of Mtb cultures (OD600 of ~ 1.5), incubated at 37 °C for 15 h and 1 μCi/ml of 14C-acetate (56 mCi/mmol) was added to each culture. Following incubation at 37 °C for another 8 h, the 14C-labeled cells were harvested, washed with PBS and sterilized by autoclaving. The lipids from cell pellets were hydrolyzed by adding 2 ml of tetra-n-butylammonium hydroxide (TBAH) by incubating overnight at 100 °C. Fatty acids were esterified by adding 4 ml CH2Cl2, 300 μl CH3I, and 2 ml distilled water (dH2O) and mixing at RT for 1 h. After centrifugation, the upper phase was discarded and samples were washed twice with dH2O. The lower phase was dried, resuspended in 3 ml of diethylether, after centrifugation, the organic phase was dried and lipids were resuspended in 200 μl CH2Cl2. Equal counts (75,000 cpm) were loaded on a silica gel 60 F254 thin-layer chromatography (TLC) plate and resolved using hexane/ethyl acetate (19:1, v/v, 2 runs). The FAMEs and MAMEs were detected by autoradiography. To determine the chain length distribution of FAMEs, the Mtb cultures (4 ml each at OD600 of 0.3) were treated with compounds for 2 h followed by 14C-acetate incorporation for another 2 h, then MAMEs/FAMEs were prepared as above. The samples (5 μl each) were analyzed on a C18 reverse-phase TLC, developed with acetonitrile/dioxane (1:1, v/v) and analyzed by phosphorimaging. To study the effect of compounds on polar lipids including TMM/TDM, labeled cell pellets were extracted overnight at 50 °C with 4 ml of CHCl3/CH3OH (2:1, v/v)27. After centrifugation the supernatants were dried and dissolved in 200 μl CHCl3-CH3OH (2:1). Equal volume (5 μl) of each sample was analyzed on normal phase TLC plates, developed with CHCl3/CH3OH/H2O (62:25:4, v/v/v). For the analysis of apolar lipids, Mtb cultures 10 ml each (OD600 of ~1.0)56 were treated with TP2 or orlistat (Sigma Aldrich) for 6 h followed by 5 μCi 14C-propionate (American Radiolabeled Chemicals, Inc., St. Louis, MO). After incubation for 16 h at 37 °C, the cell pellets were extracted with 2 ml CH3OH/0.3% NaCl (10:1) and 1 ml petroleum ether by vigorously mixing over 15 min. After centrifugation, the upper layer was dried, resuspended in 200 μl of petroleum ether, spotted (5 μl each) on normal-phase TLC plates and developed either with CHCl3/CH3OH/H2O (62:12:1, v/v/v) or petroleum ether/ethyl acetate (98:2, v/v, three times)57,58. The TLCs were visualized using a phosphorimager.
Synthesis of fatty acid methyl ester standards (FAMEs) for RP-TLC analysis
One millimole of each fatty acid was dissolved or suspended in 4 ml of 50% ethyl ether/methanol at RT. Trimethylsilyldiazomethane (2 M in hexanes, Sigma Aldrich) was added at a rate such that insoluble acids dissolved and the rate of gas evolution was controlled. When a yellow color persisted, the mixture was aged for one hour. The reaction was quenched by the dropwise addition of glacial acetic acid until the solution was colorless. The solution was then partitioned between ethyl ether and saturated aq. sodium bicarbonate. The organic layer was decanted, washed with brine, dried over magnesium sulfate, concentrated and purified via flash chromatography with a 4 gram silica cartridge (RedisSep) on an Isco Combiflash Companion using a 1–>5% ethyl acetate/hexanes gradient. Fractions containing product were identified using silica gel 60 TLC plates eluted with 10% ethyl ether/hexanes and visualized by dipping in a solution of 10% phosphomolybdic acid in isopropanol and heating on a hot plate. Analyzed on an Agilent LC/MS, the products were not detectable by UV in positive or negative ion mode. All gave satisfactory NMR spectra.
FadD32 dependent loading of BODIPY® FL C16 in Pks13
The loading assay of the N-term ACP domain was adapted from previous study19. The 14C- palmitic acid (C16) substrate was substituted with flourescein labeled palmitic acid. The Pks13 protein was incubated with 50 μM BODIPY® FL C16 (Invitrogen, D-3821) in 1× Pks13 reaction buffer (50 mM HEPES, pH 7.2, 7 mM trehalose, 7 mM glucose, 2 mM ATP, 8 mM MgCl2) at 30 °C with and without FadD32 (1 μM) in 20 μl reactions. After 2 h incubations the reactions were terminated by adding 5 μl of 6× Laemmli sample buffer and quantified as described below.
Inhibition of BODIPY® FL C16 incorporation in Pks13 by TP2/TP4
The Pks13 protein (1.0 μM) was pre-incubated with indicated amounts of TP compounds at RT and ice for 15 min each in 10 μl (25 mM Tris pH 8.0, 25 mM NaCl). The reactions were initiated by adding 10 μl of 2× Pks13 reaction mixture containing 100 μM FL C16 and incubated at 30 °C for 2 h. The reactions were terminated by adding Laemmli sample buffer (100 °C for 5 min) and separated on 4–12% NuPAGE novex bis-tris gel (Invitrogen) using 1× MOPS running buffer. After electrophoresis, the in-gel fluorescence was measured using Typhoon 9400. The total proteins in the gels were visualized with InstantBlue stain (Expedeon Inc., San Diego, CA). The fluorescence was quantified (RFU or relative fluorescence units) using ImageQuant software. For quantitative analysis, a common background correction was applied to all spots, and the activity was determined by subtracting counts corresponding to Pks13 only and FadD32 only from counts of both enzymes used together (ActivityRFU = RFU(Pks13+FadD32) –RFU(Pks13)-RFU(FadD32)). The percentage inhibition was calculated considering no inhibitor control as 100% activity (Inhibition % = 1− (100*(ActivityRFU in the presence of inhibitor/ActvityRFU in the absence of inhibitor).
Purification of Mtb and M. smegmatis Pks13 in E. coli
The E. coli expression constructs in pET26b vector were co-transformed with pLysS-sfp into E. coli BL21 (DE3). The purification was carried out as described previously19 using affinity (Talon resin, as detailed below for FadD32 below) and gel-filtration (Superdex-200, GE Healthcare) chromatography.
Confirmation of P-pant modification in peptide containing Ser-55
The P-pant status of Mtb Pks13 at S55 was confirmed by trypsin digestion and nano LC-MS/MS (Supplementary Fig. 3) as described previously19. Briefly, 5 μg Pks13 was precipitated with TCA digested with trypsin, peptides were desalted using C18 spin columns and capillary-liquid chromatography-nanospray tandem mass spectrometry (Nano-LC/MS/MS) was performed on a Thermo Finnigan LTQ orbitrap velos mass spectrometer equipped with a nanospray source operated in positive ion mode. The LC system was an UltiMate 3000 (Dionex, Sunnyvale, CA) with a FAMOS autosampler. Solvent A contained 2% acetonitrile and 0.1% formic acid. Solvent B contained 95.0 acetonitrile and 0.1% formic acid. Five microliters of each sample was injected onto a reversed phase 0.3 mm×5 mm trapping column (LC-Packings A Dionex Co, Sunnyvale, CA) and washed with solvent A. The injector port was switched to inject, and the peptides were eluted off of the trap and resolved on a 75 μm×150 mm capillary PepMap column (3 μm, 100 Å, C18, Dionex). Peptides were eluted into the LTQ system using a gradient of 10–95% B over 60 min, with a flow rate of 250 nl/min. The scan sequence of the mass spectrometer was programmed to perform a full scan followed by 10 data-dependent MS/MS scans of the most abundant peaks in the spectrum. Dynamic exclusion was used to exclude multiple MS/MS of the same peptide. Data was searched against Pks13 sequence along with contaminants on mascot search engine with following parameters; trypsin as a protease, one missed cleavage, P-pant as variable modification. Precursor ion tolerance was set at 10 ppm and fragment ion tolerance was set at 0.5 Da. Matched spectra were manually verified for confirmation.
Purification and activity of Mtb FadD32
The pET26b-fadD32 was transformed into E. coli BL21(DE3) and grown in 500 ml autoinduction media (Overnight Express™ Autoinduction System 1, Novagen) supplemented with kanamycin (50 μg/ml) at 18 °C for 72 h. The cells were harvested and resuspended in 40 ml of lysis buffer (50 mM Tris-HCl pH 8.0, 300 mM NaCl, 10 mM imidazole, 0.1% Triton-Χ100, 1 mg/ml lysozyme, 1× EDTA free-protease inhibitor cocktail) and frozen overnight at −80 °C. The cells were lysed by sonication and the clarified supernatant was allowed to bind with 2 ml Talon resin (Clonetech) at 4 °C for 1 h. The resin was washed 3×30 ml wash buffer (50 mM Tris-HCl pH 8.0, 300 mM NaCl, 10 mM imidazole), eluted with 15 ml elution buffer (50 mM Tris-HCl pH 8.0, 50 mM NaCl, 500 mM imidazole), concentrated by amicon centrifugal device, washed with 50 ml of 50 mM Tris-HCl pH 8.0–50 mM NaCl and dialyzed overnight in storage buffer (50 mM Tris-HCl pH 8.0, 50 mM NaCl, 50% glycerol). The activity and inhibition of FadD32 by TP2 and TP4 was determined using a radioTLC assay30 performed under same the conditions as Pks13 assays. The FadD32 (1 μM for TP2 and 2 μM for TP4) was pre-incubated with the indicated amount of TP compound at RT followed by incubation on ice for 15 min each. The reactions were initiated by adding 14C lauric acid (50 μM) as substrate in 1× reaction buffer and terminated by adding glacial acetic acid (final concentration 2%) after 2 h. Fractions of the reactions (2.5 μl) were analyzed on silica gel G-60 TLC plates in n-butanol/acetic acid/water (80:25:40, v/v/v) solvent system and visualized by phosphorimaging.
Determination of drug interactions (synergism and antagonism)
Mtb H37Rv was treated with two-fold serial dilutions of INH and TP2/TP4 with concentrations ranging from 0.05–0.40 and 0.125–1 μM, respectively. Growth was monitored using the Bactec 460TB method33,34. Compound concentrations that inhibited growth compared to the compound-free 12B media 1:100 dilution control were defined as negative (−) for growth. A checkerboard analysis32 was used to determine synergy and antagonism of the TP compounds with INH. The fractional inhibitory concentration (FIC) was determined by dividing the MIC of the combination of drugs by the MIC of the drugs independently. Fractional inhibitory index (ΣFIC) was determined by adding the FICs of each drug tested. Activity of compounds were defined as synergistic if ΣFIC ≤ 0.5, antagonistic if ΣFIC ≥ 4.0, and independent if ΣFIC >0.5 and <4.032.
Killing studies using CFU measurements
For the CFU-based bactericidal activity assays, H37Rv was grown in Middlebrook 7H9-OADC-tyloxapol-glycerol to mid-log phase (OD600 of ~ 1.0). The cultures were diluted 1:50 and incubated with TP compounds at 37 °C while stirring. At specific time points, aliquots were taken and serial dilutions were plated on Middlebrook 7H10-OADC-glycerol. The plates were incubated at 37 °C for 4 weeks and colony forming units were counted.
Measuring the emergence of drug resistance during BACTEC killing studies
To determine the proportion of resistant cells that emerged upon prolonged drug treatment, bacterial cells were removed from their BACTEC vials after forty-eight days drug treatment, spun down and serial diluted for CFU determination onto 7H10 plates containing varying concentrations of the relevant drug.
Cytotoxicity assays
Cytotoxicity studies were performed by a commercial vendor (Pharmaron Inc.). In brief, Vero (African green monkey kidney epithelial) and HepG2 (human liver carcinoma) cells were grown to exponential growth phase and seeded on 96-well microplates at a final concentration of 5×10⁴cells/ml in media containing 10% FBS. Three fold serial dilutions of TP2 with a starting concentration of 20 mM were added to wells and plates were incubated for 72 h in a 37 °C, 5% CO2 incubator. After incubation, 150 μl XTT solution (0.33 mg XTT/ml free phenol red RPMI 1640 medium) was added per well and incubated for an additional 2 h in CO2 incubator (5%, 37 °C). Following incubation, plates were shaken for 5 min at 200 rpm and absorbance was read at 450 nm. Paclitaxel, a mitotic inhibitor, was used as a positive control.
Intracellular activity in J774A.1 murine macrophages
J774A.1 macrophages were seeded onto 24-well clear plates at 1×10⁵ cells/well, incubated at 37 °C for 16 h, and infected with BCG at an MOI of 5. After incubation at 37 °C for 1 h, cells were treated with amikacin (200 μg/ml) for 2 h. The cells were washed 3× with Hank’s Balanced Saline Solution (HBSS) and incubated at 37 °C for ~16 h. After incubation, compounds were added. On day 6, cells were washed with 3× HBSS to remove excess compounds, lysed with dH2O, serially diluted and plated on 7H10 media for CFU.
Comparative modeling and thiophene compound docking
Comparative models of the wild-type and F79S mutant Pks13 N-ACP domain were generated using MODELLER44. The high resolution X-ray crystal structure of an acyl carrier protein (PDB ID 1X3O) from Thermus thermophilus was used as the modeling template. The Pks13 N-ACP domain model (residues 18–95) yielding the lowest DOPE score and a GA341 score of 0.99975 was selected for the thiophene compound docking studies. AutoDock Tools42 was used to prepare the thiophene compound models and the Pks13 N-ACP domain model for docking in AutoDock Vina43. The docking grid encompassed the entire Pks13 N-terminal ACP domain and no residues were selected as flexible. Molecular graphics were produced with PyMOL59.
Supplementary Material
Acknowledgments
This work was supported in part by NIH grant R01 AI080653 to D.A., a UNCF/Merck Postdoctoral Science Research Fellowship to R.W., a US National Institutes of Health (NIH) grant R01 AI081736 to M.B.N. W.R.J. acknowledges generous support from the NIH Centers for AIDS Research Grant (CFAR) AI-051519 at the Albert Einstein College of Medicine and by the NIH Grant AI26170. The compounds initially screened in this work were supplied as part of NIH grants AI-95364 and AI-15449.
We thank Robert Goldman for his support obtaining MLPCN compounds for the piniBAC screen, Robert Reynolds for his advice on the initial analysis of the MLPCN library, and Clifton Barry III and Helena Boshoff for their kind gift of TDM and TMM standards.
Footnotes
Author Contributions
R.W., P.K., C.V., W.R.J., L.K., and D.A. conceived and designed experiments. J.S.F. synthesized compound JSF-1735, M.J.S. and J.S.F. synthesized FAME standards. V.P. and M.B.N. performed computational docking studies. S.W.B. and J.R.W. performed whole-genome sequencing and analysis. R.W., P.K., C.V., R.V-C., E.M., S.S., R.C. and L.K. performed whole-cell screening, performed MIC testing, selected resistant mutants, constructed recombinant strains, performed mycolic acid analyses, over-expression studies, bactericidal, intracellular, and synergy assays. R.W., P.K. and D. A. wrote the manuscript. All authors discussed the results, commented and contributed to sections of the manuscript.
Competing financial interests
The authors declare no competing financial interests.
References
- 1.Espinal MA. The global situation of MDR-TB. Tuberculosis (Edinb) 2003;83:44–51. doi: 10.1016/s1472-9792(02)00058-6. [DOI] [PubMed] [Google Scholar]
- 2.Mondal R, Jain A. Extensively drug-resistant Mycobacterium tuberculosis, India. Emerg Infect Dis. 2007;13:1429–31. doi: 10.3201/eid1309.070443. [DOI] [PMC free article] [PubMed] [Google Scholar]
- 3.Caminero JA, Sotgiu G, Zumla A, Migliori GB. Best drug treatment for multidrug-resistant and extensively drug-resistant tuberculosis. Lancet Infect Dis. 2010;10:621–9. doi: 10.1016/S1473-3099(10)70139-0. [DOI] [PubMed] [Google Scholar]
- 4.Kroon AM, Van den Bogert C. Antibacterial drugs and their interference with the biogenesis of mitochondria in animal and human cells. Pharm Weekbl Sci. 1983;5:81–7. doi: 10.1007/BF01960982. [DOI] [PubMed] [Google Scholar]
- 5.Kohanski MA, Dwyer DJ, Collins JJ. How antibiotics kill bacteria: from targets to networks. Nat Rev Microbiol. 2010;8:423–35. doi: 10.1038/nrmicro2333. [DOI] [PMC free article] [PubMed] [Google Scholar]
- 6.Wei JR, et al. Depletion of antibiotic targets has widely varying effects on growth. Proc Natl Acad Sci U S A. 2011;108:4176–81. doi: 10.1073/pnas.1018301108. [DOI] [PMC free article] [PubMed] [Google Scholar]
- 7.Jovetic S, Zhu Y, Marcone GL, Marinelli F, Tramper J. beta-Lactam and glycopeptide antibiotics: first and last line of defense? Trends Biotechnol. 2010;28:596–604. doi: 10.1016/j.tibtech.2010.09.004. [DOI] [PubMed] [Google Scholar]
- 8.Khoo KH, et al. Truncated structural variants of lipoarabinomannan in ethambutol drug-resistant strains of Mycobacterium smegmatis. Inhibition of arabinan biosynthesis by ethambutol. J Biol Chem. 1996;271:28682–90. doi: 10.1074/jbc.271.45.28682. [DOI] [PubMed] [Google Scholar]
- 9.Vilcheze C, et al. Transfer of a point mutation in Mycobacterium tuberculosis inhA resolves the target of isoniazid. Nat Med. 2006;12:1027–9. doi: 10.1038/nm1466. [DOI] [PubMed] [Google Scholar]
- 10.Slayden RA, et al. Antimycobacterial action of thiolactomycin: an inhibitor of fatty acid and mycolic acid synthesis. Antimicrob Agents Chemother. 1996;40:2813–9. doi: 10.1128/aac.40.12.2813. [DOI] [PMC free article] [PubMed] [Google Scholar]
- 11.Glickman MS, Cox JS, Jacobs WR., Jr A novel mycolic acid cyclopropane synthetase is required for cording, persistence, and virulence of Mycobacterium tuberculosis. Mol Cell. 2000;5:717–27. doi: 10.1016/s1097-2765(00)80250-6. [DOI] [PubMed] [Google Scholar]
- 12.Dubnau E, et al. Oxygenated mycolic acids are necessary for virulence of Mycobacterium tuberculosis in mice. Mol Microbiol. 2000;36:630–7. doi: 10.1046/j.1365-2958.2000.01882.x. [DOI] [PubMed] [Google Scholar]
- 13.Bhatt A, Molle V, Besra GS, Jacobs WR, Jr, Kremer L. The Mycobacterium tuberculosis FAS-II condensing enzymes: their role in mycolic acid biosynthesis, acid-fastness, pathogenesis and in future drug development. Mol Microbiol. 2007;64:1442–54. doi: 10.1111/j.1365-2958.2007.05761.x. [DOI] [PubMed] [Google Scholar]
- 14.Kremer L, Baulard AR, Besra GS. Genetics of Mycolic Acid Biosynthesis. In: Hatfull GF, Jacobs WR Jr, editors. Molecular Genetics of Mycobacteria. ASM Press; 2000. pp. 173–190. [Google Scholar]
- 15.Takayama K, Wang C, Besra GS. Pathway to synthesis and processing of mycolic acids in Mycobacterium tuberculosis. Clin Microbiol Rev. 2005;18:81–101. doi: 10.1128/CMR.18.1.81-101.2005. [DOI] [PMC free article] [PubMed] [Google Scholar]
- 16.Barry CE, 3rd, et al. Mycolic acids: structure biosynthesis and physiological functions. Prog Lipid Res. 1998;37:143–79. doi: 10.1016/s0163-7827(98)00008-3. [DOI] [PubMed] [Google Scholar]
- 17.Brennan PJ. Structure, function, and biogenesis of the cell wall of Mycobacterium tuberculosis. Tuberculosis (Edinb) 2003;83:91–7. doi: 10.1016/s1472-9792(02)00089-6. [DOI] [PubMed] [Google Scholar]
- 18.Ojha AK, Trivelli X, Guerardel Y, Kremer L, Hatfull GF. Enzymatic hydrolysis of trehalose dimycolate releases free mycolic acids during mycobacterial growth in biofilms. J Biol Chem. 2010;285:17380–9. doi: 10.1074/jbc.M110.112813. [DOI] [PMC free article] [PubMed] [Google Scholar]
- 19.Gavalda S, et al. The Pks13/FadD32 crosstalk for the biosynthesis of mycolic acids in Mycobacterium tuberculosis. J Biol Chem. 2009;284:19255–64. doi: 10.1074/jbc.M109.006940. [DOI] [PMC free article] [PubMed] [Google Scholar]
- 20.Portevin D, et al. A polyketide synthase catalyzes the last condensation step of mycolic acid biosynthesis in mycobacteria and related organisms. Proc Natl Acad Sci U S A. 2004;101:314–9. doi: 10.1073/pnas.0305439101. [DOI] [PMC free article] [PubMed] [Google Scholar]
- 21.Leger M, et al. The dual function of the Mycobacterium tuberculosis FadD32 required for mycolic acid biosynthesis. Chem Biol. 2009;16:510–9. doi: 10.1016/j.chembiol.2009.03.012. [DOI] [PubMed] [Google Scholar]
- 22.Carroll P, Faray-Kele MC, Parish T. Identifying vulnerable pathways in Mycobacterium tuberculosis by using a knockdown approach. Appl Environ Microbiol. 2011;77:5040–3. doi: 10.1128/AEM.02880-10. [DOI] [PMC free article] [PubMed] [Google Scholar]
- 23.Sassetti CM, Rubin EJ. Genetic requirements for mycobacterial survival during infection. Proc Natl Acad Sci U S A. 2003;100:12989–94. doi: 10.1073/pnas.2134250100. [DOI] [PMC free article] [PubMed] [Google Scholar]
- 24.Alland D, Steyn AJ, Weisbrod T, Aldrich K, Jacobs WR., Jr Characterization of the Mycobacterium tuberculosis iniBAC promoter, a promoter that responds to cell wall biosynthesis inhibition. J Bacteriol. 2000;182:1802–11. doi: 10.1128/jb.182.7.1802-1811.2000. [DOI] [PMC free article] [PubMed] [Google Scholar]
- 25.Maddry JA, et al. Antituberculosis activity of the molecular libraries screening center network library. Tuberculosis (Edinb) 2009;89:354–63. doi: 10.1016/j.tube.2009.07.006. [DOI] [PMC free article] [PubMed] [Google Scholar]
- 26.Ananthan S, et al. High-throughput screening for inhibitors of Mycobacterium tuberculosis H37Rv. Tuberculosis (Edinb) 2009;89:334–53. doi: 10.1016/j.tube.2009.05.008. [DOI] [PMC free article] [PubMed] [Google Scholar]
- 27.Tahlan K, et al. SQ109 targets MmpL3, a membrane transporter of trehalose monomycolate involved in mycolic acid donation to the cell wall core of Mycobacterium tuberculosis. Antimicrob Agents Chemother. 2012;56:1797–809. doi: 10.1128/AAC.05708-11. [DOI] [PMC free article] [PubMed] [Google Scholar]
- 28.Telenti A, et al. The emb operon, a gene cluster of Mycobacterium tuberculosis involved in resistance to ethambutol. Nat Med. 1997;3:567–70. doi: 10.1038/nm0597-567. [DOI] [PubMed] [Google Scholar]
- 29.Onodera Y, Tanaka M, Sato K. Inhibitory activity of quinolones against DNA gyrase of Mycobacterium tuberculosis. J Antimicrob Chemother. 2001;47:447–50. doi: 10.1093/jac/47.4.447. [DOI] [PubMed] [Google Scholar]
- 30.Trivedi OA, et al. Enzymic activation and transfer of fatty acids as acyl-adenylates in mycobacteria. Nature. 2004;428:441–5. doi: 10.1038/nature02384. [DOI] [PubMed] [Google Scholar]
- 31.Freundlich JS, et al. Triclosan derivatives: towards potent inhibitors of drug-sensitive and drug-resistant Mycobacterium tuberculosis. ChemMedChem. 2009;4:241–8. doi: 10.1002/cmdc.200800261. [DOI] [PMC free article] [PubMed] [Google Scholar]
- 32.Reddy VM, Einck L, Andries K, Nacy CA. In vitro interactions between new antitubercular drug candidates SQ109 and TMC207. Antimicrob Agents Chemother. 2010;54:2840–6. doi: 10.1128/AAC.01601-09. [DOI] [PMC free article] [PubMed] [Google Scholar]
- 33.Siddiqi SH, Libonati JP, Middlebrook G. Evaluation of rapid radiometric method for drug susceptibility testing of Mycobacterium tuberculosis. J Clin Microbiol. 1981;13:908–12. doi: 10.1128/jcm.13.5.908-912.1981. [DOI] [PMC free article] [PubMed] [Google Scholar]
- 34.Safi H, Sayers B, Hazbon MH, Alland D. Transfer of embB codon 306 mutations into clinical Mycobacterium tuberculosis strains alters susceptibility to ethambutol, isoniazid, and rifampin. Antimicrob Agents Chemother. 2008;52:2027–34. doi: 10.1128/AAC.01486-07. [DOI] [PMC free article] [PubMed] [Google Scholar]
- 35.Middlebrook G. Sterilization of tubercle bacilli by isonicotinic acid hydrazide and the incidence of variants resistant to the drug in vitro. Am Rev Tuberc. 1952;65:765–7. [PubMed] [Google Scholar]
- 36.Siddiqi S, Takhar P, Baldeviano C, Glover W, Zhang Y. Isoniazid induces its own resistance in nonreplicating Mycobacterium tuberculosis. Antimicrob Agents Chemother. 2007;51:2100–4. doi: 10.1128/AAC.00086-07. [DOI] [PMC free article] [PubMed] [Google Scholar]
- 37.Gumbo T, et al. Isoniazid bactericidal activity and resistance emergence: integrating pharmacodynamics and pharmacogenomics to predict efficacy in different ethnic populations. Antimicrob Agents Chemother. 2007;51:2329–36. doi: 10.1128/AAC.00185-07. [DOI] [PMC free article] [PubMed] [Google Scholar]
- 38.Gumbo T, et al. Isoniazid’s bactericidal activity ceases because of the emergence of resistance, not depletion of Mycobacterium tuberculosis in the log phase of growth. J Infect Dis. 2007;195:194–201. doi: 10.1086/510247. [DOI] [PubMed] [Google Scholar]
- 39.Wallis RS, et al. Drug tolerance in Mycobacterium tuberculosis. Antimicrob Agents Chemother. 1999;43:2600–6. doi: 10.1128/aac.43.11.2600. [DOI] [PMC free article] [PubMed] [Google Scholar]
- 40.Falzari K, et al. In vitro and in vivo activities of macrolide derivatives against Mycobacterium tuberculosis. Antimicrob Agents Chemother. 2005;49:1447–54. doi: 10.1128/AAC.49.4.1447-1454.2005. [DOI] [PMC free article] [PubMed] [Google Scholar]
- 41.Boechat N, et al. Novel 1,2,3-triazole derivatives for use against Mycobacterium tuberculosis H37Rv (ATCC 27294) strain. J Med Chem. 2011;54:5988–99. doi: 10.1021/jm2003624. [DOI] [PubMed] [Google Scholar]
- 42.Morris GM, et al. AutoDock4 and AutoDockTools4: Automated docking with selective receptor flexibility. J Comput Chem. 2009;30:2785–91. doi: 10.1002/jcc.21256. [DOI] [PMC free article] [PubMed] [Google Scholar]
- 43.Trott O, Olson AJ. AutoDock Vina: improving the speed and accuracy of docking with a new scoring function, efficient optimization, and multithreading. J Comput Chem. 2010;31:455–61. doi: 10.1002/jcc.21334. [DOI] [PMC free article] [PubMed] [Google Scholar]
- 44.Sali A, Blundell TL. Comparative protein modelling by satisfaction of spatial restraints. J Mol Biol. 1993;234:779–815. doi: 10.1006/jmbi.1993.1626. [DOI] [PubMed] [Google Scholar]
- 45.Phetsuksiri B, et al. Antimycobacterial activities of isoxyl and new derivatives through the inhibition of mycolic acid synthesis. Antimicrob Agents Chemother. 1999;43:1042–51. doi: 10.1128/aac.43.5.1042. [DOI] [PMC free article] [PubMed] [Google Scholar]
- 46.Kremer L, et al. Inhibition of InhA activity, but not KasA activity, induces formation of a KasA-containing complex in mycobacteria. J Biol Chem. 2003;278:20547–54. doi: 10.1074/jbc.M302435200. [DOI] [PubMed] [Google Scholar]
- 47.Roujeinikova A, et al. X-ray crystallographic studies on butyryl-ACP reveal flexibility of the structure around a putative acyl chain binding site. Structure. 2002;10:825–35. doi: 10.1016/s0969-2126(02)00775-x. [DOI] [PubMed] [Google Scholar]
- 48.Parris KD, et al. Crystal structures of substrate binding to Bacillus subtilis holo-(acyl carrier protein) synthase reveal a novel trimeric arrangement of molecules resulting in three active sites. Structure. 2000;8:883–95. doi: 10.1016/s0969-2126(00)00178-7. [DOI] [PubMed] [Google Scholar]
- 49.Lee RE, et al. Combinatorial lead optimization of [1,2]-diamines based on ethambutol as potential antituberculosis preclinical candidates. J Comb Chem. 2003;5:172–87. doi: 10.1021/cc020071p. [DOI] [PubMed] [Google Scholar]
- 50.Jackson M, Crick DC, Brennan PJ. Phosphatidylinositol is an essential phospholipid of mycobacteria. J Biol Chem. 2000;275:30092–9. doi: 10.1074/jbc.M004658200. [DOI] [PubMed] [Google Scholar]
- 51.Veyron-Churlet R, Zanella-Cleon I, Cohen-Gonsaud M, Molle V, Kremer L. Phosphorylation of the Mycobacterium tuberculosis beta-ketoacyl-acyl carrier protein reductase MabA regulates mycolic acid biosynthesis. J Biol Chem. 2010;285:12714–25. doi: 10.1074/jbc.M110.105189. [DOI] [PMC free article] [PubMed] [Google Scholar]
- 52.Stover CK, et al. New use of BCG for recombinant vaccines. Nature. 1991;351:456–60. doi: 10.1038/351456a0. [DOI] [PubMed] [Google Scholar]
- 53.Kim P, et al. Structure-activity relationships of antitubercular nitroimidazoles. 2. Determinants of aerobic activity and quantitative structure-activity relationships. J Med Chem. 2009;52:1329–44. doi: 10.1021/jm801374t. [DOI] [PMC free article] [PubMed] [Google Scholar]
- 54.van Soolingen D, Hermans PW, de Haas PE, Soll DR, van Embden JD. Occurrence and stability of insertion sequences in Mycobacterium tuberculosis complex strains: evaluation of an insertion sequence-dependent DNA polymorphism as a tool in the epidemiology of tuberculosis. J Clin Microbiol. 1991;29:2578–86. doi: 10.1128/jcm.29.11.2578-2586.1991. [DOI] [PMC free article] [PubMed] [Google Scholar]
- 55.Slayden RA, Barry CE., 3rd Analysis of the Lipids of Mycobacterium tuberculosis. Methods Mol Med. 2001;54:229–45. doi: 10.1385/1-59259-147-7:229. [DOI] [PubMed] [Google Scholar]
- 56.Seeliger JC, et al. Elucidation and chemical modulation of sulfolipid-1 biosynthesis in Mycobacterium tuberculosis. J Biol Chem. 2012;287:7990–8000. doi: 10.1074/jbc.M111.315473. [DOI] [PMC free article] [PubMed] [Google Scholar]
- 57.Domenech P, Reed MB. Rapid and spontaneous loss of phthiocerol dimycocerosate (PDIM) from Mycobacterium tuberculosis grown in vitro: implications for virulence studies. Microbiology. 2009;155:3532–43. doi: 10.1099/mic.0.029199-0. [DOI] [PMC free article] [PubMed] [Google Scholar]
- 58.Alibaud L, et al. A Mycobacterium marinum TesA mutant defective for major cell wall-associated lipids is highly attenuated in Dictyostelium discoideum and zebrafish embryos. Mol Microbiol. 2011;80:919–34. doi: 10.1111/j.1365-2958.2011.07618.x. [DOI] [PubMed] [Google Scholar]
- 59.DeLano WL. The PyMOL Molecular Graphics System. DeLano Scientific; San Carlos, CA, USA: 2002. [Google Scholar]
Associated Data
This section collects any data citations, data availability statements, or supplementary materials included in this article.