

Abstract
Mapping anatomical brain networks with graph-theoretic analysis of diffusion tractography has recently gained popularity, because of its presumed value in understanding brain function. However, this approach has seldom been used to compare brain connectomes across species, which may provide insights into brain evolution. Here, we employed a data-driven approach to compare interregional brain connections across three primate species: 1) the intensively studied rhesus macaque, 2) our closest living primate relative, the chimpanzee, and 3) humans. Specifically, we first used random parcellations and surface-based probabilistic diffusion tractography to derive the brain networks of the three species under various network densities and resolutions. We then compared the characteristics of the networks using graph-theoretic measures. In rhesus macaques, our tractography-defined hubs showed reasonable overlap with hubs previously identified using anterograde and retrograde tracer data. Across all three species, hubs were largely symmetric in the two hemispheres and were consistently identified in medial parietal, insular, retrosplenial cingulate and ventrolateral prefrontal cortices, suggesting a conserved structural architecture within these regions. However, species differences were observed in the inferior parietal cortex, polar and medial prefrontal cortices. The potential significance of these interspecies differences is discussed.
Keywords: brain networks, graph theory, prefrontal cortex, parietal cortex, tracer, random parcellation
Introduction
The brain is organized as distributed dynamic networks that are largely constrained by their anatomical connections (Greicius et al., 2003). Mapping and characterizing interregional anatomical connections of the brain, known collectively as the structural connectome (Sporns et al., 2005), has recently gained significant attention and proven to be an effective approach for understanding brain structural architecture (Bullmore and Sporns, 2009; Gong et al., 2009b; Hagmann et al., 2008; Honey et al., 2009). Although many studies have modeled and analyzed anatomical networks of human brains (Bullmore and Sporns, 2009; Gong et al., 2009a; Hagmann et al., 2008; Iturria-Medina et al., 2008; Li et al., 2009; Shu et al., 2009), there is little parallel research on other primates using similar methodologies (Iturria-Medina et al., 2011). These studies are important, as comparing human and non-human brain networks may provide insights into the evolution of human brain specializations (Denys et al., 2004b).
The interregional anatomical connections of the brain can be reconstructed with in vivo diffusion tractography, an imaging technique that is able to noninvasively estimate the orientations of neuronal fiber bundles in the brain based on anisotropic diffusion of water molecules in white matter (Basser et al., 2000; Behrens et al., 2007). Then, the reconstructed networks can be studied using graph theory, a powerful data-reduction technique that summarizes the characteristics of a complex network with only a few measures, giving insight into the organization of entire networks as well as individual network elements (Gong et al., 2009b; Honey et al., 2009; Tymofiyeva et al., 2012; van den Heuvel et al., 2010). Interregional connections of the rhesus monkey brain have been extensively investigated for decades using invasive tracer methods (Kobbert et al., 2000; Markov et al., 2011). The resulting information has greatly enhanced our understanding of the structural architecture of the rhesus monkey brain (Bezgin et al., 2012; Felleman and Van Essen, 1991; Lewis and Van Essen, 2000). These data are also invaluable for evaluating the accuracy of results obtained by non-invasive diffusion tractography (Iturria-Medina et al., 2011; Li et al., 2012a). In contrast to the widespread knowledge of connectivity in macaque brains, knowledge of brain connectivity of chimpanzees is still in its infancy (Bailey et al., 1950; Hecht et al., 2012; Rilling et al., 2008). Chimpanzees have cognitive abilities that distinguish them from other primates (Tomasello and Call, 1997), and they are our closest living primate relative. Mapping their brain connectome may therefore shed light on both chimpanzee and human brain specializations.
In this study, we used a data-driven approach to map and compare the brain connectomes of macaques, chimpanzees and humans. We first divided the neocortex of the three species into hundreds of random parcels of equal area using an anatomically unconstrained method and mapped the interparcel connections with surface-based probabilistic diffusion tractography. We then summarized the characteristics of the derived brain networks using graph theory, and compared network hubs across species. Although multi-modal areal parcellation schemes are preferable for connectome studies like this, we demonstrate here that a great deal of the structural architecture can be revealed with anatomically unconstrained parcellation (see Fig.1 for an analogy), when a detailed multi-modal areal-based scheme is unavailable across species.
Fig. 1.
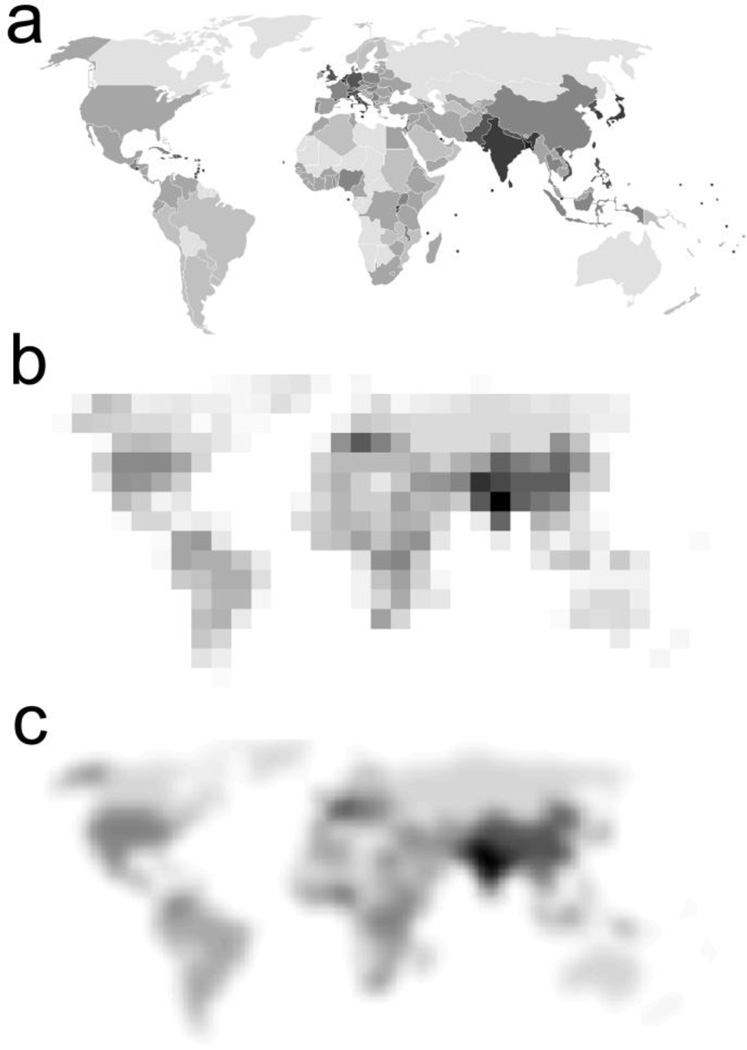
The schematic of random parcellation of world population density map. (a) Original world population density map with well-defined boundaries between countries. (b) Random square masks were used to parcellate the map and the value in each mask is the mean of population density covered by the mask. (c) Fifty random parcellation schemes were generated and the results were averaged. It can be seen that a great deal of world population density was revealed with the random parcellation method (e.g., the countries with highest population densities could be easily identified in b, with even more details in c) even though no prior knowledge on the boundaries of the countries is available. Extremely high network resolutions were avoided in our analyses due to the large inter-subject misregistration of parcels under the high network resolutions.
Methods
Subjects
MRI scans were collected from 10 female rhesus macaques (Macaca mulatta, 14±6.7 yrs), 10 female chimpanzees (Pan troglodytes, 29.4±12.8 yrs) and 10 female humans (Homo sapiens, 42.5±9.8 yrs), which were randomly selected from larger cohorts. All chimpanzees and macaques were housed at Yerkes National Primate Research Center (YNPRC) in Atlanta, Georgia. All procedures were carried out in accordance with protocols approved by the YNPRC and the Emory University Institutional Animal Care and Use Committee (IACUC, approval #: YER-2001206). All female humans were healthy volunteers with no known neurological disorders (IRB approval #: IRB00000028).
Data acquisition
The anatomical and diffusion MR data for all three species were acquired on two Siemens 3T Trio Tim Scanners (Siemens Medical System, Malvern, PA). Macaques and chimpanzees were immobilized with ketamine (2–6 mg/kg, i.m.) prior to being anesthetized with isoflurane (1%). Animals were under constant observation by the veterinary staff before, during, and after the scan. Head motion was minimized by stabilizing with foam cushions and elastic straps. For diffusion imaging, equal sets of diffusion-weighted images with phase-encoding directions (left-right) of opposite polarity were acquired for removing susceptibility-related distortion in postprocessing (Andersson et al., 2003). We used a phase-array human knee coil for macaques. For chimpanzees, we used a standard circularly polarized (CP) birdcage coil because their protruding jaw would be too large to be fit into the standard phase-array coil designed for humans. For humans, we used a 12-channel phase-array coil. The details of the sequences and scanning parameters for the three species are listed in Table. 1. SNR of the diffusion weighted images was similar (approximately 30) for all three species.
Table 1.
The detailed imaging parameters for macaques, chimpanzees and humans
| MPRAGE | |||||||||
|---|---|---|---|---|---|---|---|---|---|
| Species | GRAPPA | Flip angle |
Slice thickness (mm) |
Voxel size (mm3) |
TR/TI/TE (ms) |
NEX | Matrix size |
FOV | Scan time (min) |
| macaques | 2 | 8 | 0.5 | 0.5×0.5×0.5 | 2600/900/3.37 | 3 | 320 × 320 × 176 |
160 × 160 × 88 |
25 |
| chimpanzees | 1 | 8 | 0.8 | 0.8×0.8×0.8 | 2600/900/3.06 | 2 | 256 × 256 × 192 |
205 × 205 × 154 |
16 |
| human | 2 | 8 | 1 | 1×1 ×1 | 2600/900/3.02 | 1 | 224 × 256 × 176 |
224 × 256 × 176 |
4 |
| Double spin echo EPI | |||||||||
| Species | GRAPPA |
Partial Fourier |
Slices |
Voxel size (mm3) |
TR/TE (ms) |
# of NEX/ b0s |
Matrix size |
FOV |
Scan time (min) |
| macaques | 3 | N/A | 43 | 1.1×1.1×1.1 | 7000/108 | 10/50 | 128×120 | 141×132 | 86 |
| chimpanzees | 1 | 5/8 | 41 | 1.8×1.8×1.8 | 5900/86 | 8/40 | 72×128 | 130×230 | 60 |
| human | 2 | N/A | 64 | 2×2 × 2 | 8500/95 | 2/8 | 108×128 | 216×256 | 20 |
Notes: TR: repetition time, TI: inversion time, TE: echo time, NEX: number of excitations (averages), FOV: field of view, GRAPPA: Generalized auto-calibrating partially parallel acquisition, DWI: diffusion weighted images.
Data preprocessing
All data were analyzed using FSL (http://fsl.fmrib.ox.ac.uk/fsl/fslwiki/). T1-weighted images were preprocessed with skull stripping (Smith, 2002), intensity bias correction (Zhang et al., 2001), noise reduction (Smith and Brady, 1997), and contrast enhancement (square of the images to improve white-matter/gray-matter contrast). Diffusion-weighted images were first corrected for eddy-current induced distortion across diffusion directions by using a linear coregistration of the diffusion-weighted images to the b0 image. Then, the susceptibility distortion was corrected based on the method by Andersson, et al. (Andersson et al., 2003).
Reconstructing interregional connectivity of brain networks
In this study, we first generated a population-specific surface template for each species by randomly choosing six subjects in each cohort and then iteratively generated the surface templates using FreeSurfer (http://surfer.nmr.mgh.harvard.edu/). Specifically, a random subject was first chosen for generating a single-subject, surface-based template. Then all the remaining five subjects were surface-registered to the template and the derived warps were used to generate a population-specific, surface template. These procedures were repeated using the resulting surface template as the starting point for a final population-specific, surface template in each species. Acquiring accurate FreeSurfer surfaces in macaques and chimpanzees requires steps outside the FreeSurfer processing pipeline, including: i) brain segmentation, ii) manually editing the segmented white matter in the subcortical areas in macaques, and iii) linear alignment of the subjects to the template. Then, the surfaces of white-matter/gray-matter (WM/GM) interface for each species were reconstructed and registered to the population-specific surface template using FreeSurfer’s energy-based surface registration technique. Last, after excluding cortex on the medial wall, surface templates for each species were randomly divided into a total of 300 and 600 parcels for both hemispheres. These random parcellations have identical numbers of parcels (N=300, 600) across species. Keeping the parcel number identical across species is necessary as previous studies indicated that graph-theoretic measures are functions of node number (Wang et al., 2009; Zalesky et al., 2010). The number of 300 parcels for both hemispheres was chosen to approximate the estimated total cortical areas in macaques and humans (260–280 for macaques and 300–400 for humans)(Van Essen et al., 2012a; Van Essen et al., 2012b). The 600-parcellation scheme was selected for higher mapping resolution, but at the price of increased errors associated with inter-subject parcel transformation (Cammoun et al., 2012; Hagmann et al., 2008). Extremely high network resolutions were avoided in our analyses due to the large inter-subject misregistration of parcels under the high network resolutions. After the parcels were generated in the template space, they were transformed to each subject’s WM/GM surface space using the surface-based transformation derived earlier. The probabilistic tractography implemented in FDT (http://www.fmrib.ox.ac.uk/fsl/) was used to derive the interregional connections for network analyses. The WM/GM interface surfaces were used as the seed masks, whereas the pial surfaces were used as stop masks to prevent fibers jumping from one side of a gyrus to another. We first estimated the local probability density functions of the primary and secondary diffusion orientations of the fibers in each voxel for each subject (Behrens et al., 2007; Behrens et al., 2003). We then sent 1000 random samples from each vertex in the seed surface mask and counted the number of the “probabilistic streamlines” originating from one parcel and reaching to the other parcels. As the vertex number in our surface-based tractography analyses was approximately ten times more than the voxel number in the GM/WM interface mask in the three species’ diffusion space (~ 130K for macaques, ~200K for chimpanzees and humans), 1000 samples per vertex will guarantee the convergence of the Monte Carlo sampling for posterior distribution.
Characterizing the reconstructed brain networks via graph theory
In this study, we utilized four related but complementary centrality measures to characterize putative hubs in the brain, with two focusing on topological distances and two on the effects of perturbation (Harriger et al., 2012). The first centrality measure is a widely used quantity called nodal betweenness centrality (BC), which expresses the potential role of each node in network communication along shortest paths (Hagmann et al., 2008). It is defined as the fraction of shortest paths between pairs of nodes that pass through a given node (Rubinov and Sporns, 2010). Closeness centrality is defined as the average distance between a given node and all other nodes in the network. The vulnerability measure attempts to capture the effect of deleting a network element on global network structure and is expressed as the difference in global efficiency (which is the average of the nodal global efficiency, defined as the mean of the inverse of the shortest path length for that given node to the other nodes in the network) due to the deletion of a given node element (Kaiser and Hilgetag, 2004; Rubinov and Sporns, 2010). Dynamical importance is designed to capture the changes in the magnitude of the largest eigenvector of a network, a key quantity determining several important dynamic processes on complex networks, after the deletion of a given node (Restrepo et al., 2006). In the current study, we defined brain regions with at least two of the four centrality measures placed in the top 10% regions across the whole brain as putative hubs. All brain regions above this criterion were treated equally. The network density is defined as the ratio of the number of existing connections over the number of all possible connections in the network. Probabilistic tractography results must be thresholded to avoid including false positive connections that would result in an implausibly high network density. Therefore, we specify a range of anatomically plausible network densities and threshold the tractography data to match these pre-specified network density values. In this study, only the networks with density ranging from 10% to 30% were investigated. We did not include networks with density sparser than 10% or denser than 30% for several reasons: i) network density of mammalian brain networks is estimated to be higher than 10% (Felleman and Van Essen, 1991; Hagmann et al., 2008; Jouve et al., 1998; Kaiser, 2011; Young, 1993); ii) connectivity matrices with density sparser than 10% were found to be dominated by short fibers in our diffusion data, which could be a result of the distance effect in the tracking algorithm (Li et al., 2012b); iii) binary networks with density higher than 30% have similar network characteristics as the matched random networks (results not shown here). In the present study, all networks were first thresholded with the density ranging from 10% to 30% under five thresholds, then binarized for further network analyses. However, future studies utilizing weighted adjacency matrix with higher network density are warranted, as a recent quantitative tracer study suggested a network density of 66% in macaque tracing studies examining 29 injected target areas and 91 source areas (Markov et al., 2012). As we included two random parcellation schemes (N=300, 600 for both hemispheres), choosing any combination of network density and parcellation scheme for hub identification will give us somewhat different results. Inspired by the idea of mapping brain networks at multiple scales (Cammoun et al., 2012), here we extended the idea by identifying the putative hubs at multiple network densities and resolutions. Specifically, we calculated and delineated hubs in the brain networks of macaques, chimpanzees and humans at five densities (10%, 15%, 20%, 25%, 30%) and two resolutions (N=300, 600). We then binarized and averaged the hub regions identified at each combination of density and resolution. Brain regions with high intensities in the resulting map are identified as hubs under most network densities and resolutions. All the graph-theoretic measures were calculated using the Matlab functions implemented in Brain Connectivity Toolbox (http://www.brain-connectivity-toolbox.net)(Rubinov and Sporns, 2010).
Comparison of tractography- and tracer- derived brain networks in monkeys
To evaluate the accuracy of the putative hubs mapped via diffusion tractography, we treated the tracer-derived putative hubs based on identical centrality measures as the gold standard (Harriger et al., 2012) and compared our tractography-derived results with the gold standard. Their directed tracer-derived brain networks in macaques were based on an earlier network analysis in which the connectivity information of the macaque cortex was collated from 410 anatomical tracing studies (Modha and Singh, 2010). Harriger and colleagues conducted the analyses on 242 cortical regions and mapped the identified hubs on 187 cortical regions for which matching surface coordinates could be found. The hubs that were originally visualized on F99AU1 surface were mapped to our macaque template using the landmark-based spherical registration in CARET software (Van Essen et al., 2001). Visual inspection of the tracer-derived hubs on F99AU1 template and our macaque template (YM6) showed a relatively good correspondence (supplementary Fig.1). As the connectivity information in the Harriger’s study does not include commissural pathways, we derived centrality hubs in each hemisphere separately in our macaque diffusion data under the above-mentioned network resolutions and thresholds, and then averaged the hubs that were individually identified at specific network density and resolution for a probability map. Unless otherwise specified, all the other cross-species analyses of hubs included commissural connectivity information, which results in slightly different distribution of structural hubs. Since the definition of the hub in our tractography-based analyses is that at least two out of the four centrality measures are placed among 10%, we removed all the tracer-derived hubs with only one centrality measure placed in the top 10% (Harriger et al., 2012). After the tracer- and tractography-derived hubs were identified, the spatial overlap of the hubs were evaluated using Jaccard Similarity Coefficient (Rombouts et al., 1998):
| (1) |
where Vi,j is the overlapped area on the surface templates between the two methods, where the Vi and Vj are the areas underlying the hubs identified by tractography and tracer methods respectively. We also simulated the random probability for the tracer- and tractography-derived hubs to overlap on the surface template. Specifically, we assumed equal distance between vertices in the simulations and used the vertex as a substitute for area for computational efficiency. Identical proportions of the vertices as those of actually estimated values in the respective tracer and tractography analyses were randomly designated as hubs and the overlapped vertices were counted and quantified using Jaccard Simulation Coefficients. The procedure was repeated 1000 times and the coefficients were averaged.
Results
Qualitative comparison of hubs identified via tracer and tractography methods
Our previous work comparing tracer- and tractography- derived brain networks focused mainly on the intraparietal areas in monkeys (Li et al., 2012a). In the current study, we took advantage of the results from a recent network analysis in which connectivity information for the monkey’s cerebral cortex from 410 tract-tracing studies were collated and analyzed to identify hubs (Harriger et al., 2012; Modha and Singh, 2010). By directly visualizing and comparing the identified hubs between these tracer results and our tractography results (Fig.3, supplementary Fig.2), we found a reasonable correspondence in the ventrolateral prefrontal cortex (PFCvl), the medial prefrontal cortex (PFCm), the medial parietal cortex (PCm), the inferior parietal cortex (PCi) and the left ventrolateral premotor area, based on the nomenclature in Kotter and Wanke’s study (2005). On the other hand, major disparities were observed in the inferior temporal cortex, the insular cortex and the mid-cingulate cortex. The tractography-derived hubs covered on average 21.1% of the total cerebral cortex (left: 20.4%; right: 21.8%), approximately one third less than that derived using tracer methods (34.6%). This disparity might be due to the fact that the parcellation schemes employed in the tracer-derived networks have unequal areal extents. The mean Jaccard Similiarity Coefficient of the tracer- and tractography- derived hubs was 11.5% (left: 12.2%; right: 10.9%), nearly four times higher than that by random chance (3.23%, table. 2).
Fig. 3.

Comparison of tracer- and tractography- derived brain networks on monkey’s inflated surfaces. (a) Centrality hubs identified using tracer-derived brain networks (adapted from Harriger et al. and mapped to our macaque surface template). The hubs were identified based on the regional scores for node betweenness centrality, closeness centrality, vulnerability and dynamical importance. Different colors indicate the number of the four centrality measures being placed in the top 10%; (b) Centrality hubs in the tractography-derived brain networks. Hubs were first identified under each network resolution (N=300,600) and threshold (10%,15%,20% 25%,30%) and then binarized and overlapped for a probability map (see methodology for details). To easily interpret the results, we did not differentiate brain regions that were ranked as hubs (i.e., at least two of four centrality measures were placed in the top 10%) and treated them equally. As a result, different colors in (b) represent how frequent the area was identified as a hub across network densities and resolutions. (c) The overlapped brain regions that have been identified as hubs across the two methodologies. It can be seen that the overlapped hubs are mainly located at the PFCvl, PFCm, PCi, PCm and the left ventrolateral premotor cortex.
Table 2.
Quantitative results of the tracer- and tractography- derived hubs and their overlaps in monkeys.
| hemisphere | Total area (cm2) |
Tracer-derived hubs (%) |
Tractography hubs (%) |
Jaccard Similarity Coeficient |
Jaccard Similarity Coefficient by random chance |
|---|---|---|---|---|---|
| Left | 133.2 | — | 20.4 | 12.2 | 3.16±0.02 |
| Right | 130.7 | 34.6 | 21.8 | 10.9 | 3.31±0.02 |
The simulations were repeated 1000 times and assumed the equal distance between vertices.
Identification of putative hubs in macaques, chimpanzees and humans
Fig.4 illustrates the distribution of BC at network density of 10%, resolution of 300. With a single threshold and resolution, high BC values at the insular, medial parietal and the ventrolateral prefrontal cortices are consistent across all three species. When all the putative hubs that were identified under individual network density and resolution were binarized and then averaged across density and resolution for a probability map, we found that highly central brain regions are largely symmetric in the two hemispheres, and are located at the frontal, parietal, insular and occipital lobes (Fig.5). Specifically, we identified the following brain regions that serve as putative hubs in macaques: PFCvl/PFCol, the prefrontal polar cortex (PFCpol), PFCm, the anterior and posterior insular cortex (la/lp), PCi, the medial parietal and posterior cingulate cortex (PGm/CCp), the retrosplenial cingulate cortex (CCr), the primary and secondary visual cortex (V1, V2), the intermediate orbital prefrontal cortex (PFCoi) (Fig.5, upper two rows). We identified the following brain regions as putative hubs in chimpanzees: PFCvl, PFCpol, PFCm, la/lp, PCi, PGm/CCp, CCr and V1. Less consistent hubs were also present in the bilateral central temporal cortices (TCc) (Fig.5, middle two rows). The following brain areas were identified as hubs in humans: the PFCvl, the primary motor cortex (M1), the intraparietal sulcus and superior parietal cortex (PCip/PCs), PCm, Ia/Ip, the medial premotor cortex (PMCm) and CCr. Similar to chimpanzees, less consistent hubs were observed on TCc (Fig.5 bottom two rows). Detailed information about the identified putative hubs and the papers highlighting their structural and functional roles are presented in table 3. The hub distribution on the original GM/WM interface surface was also plotted and presented in supplementary Fig.3.
Fig. 4.

Betweenness centrality of the brain networks from macaques, chimpanzees and humans at the network density of 10% and resolution of 300. For each species, the left two columns represent the lateral and medial views of the left hemisphere and the right two represent the right hemisphere. For all three species, the color scale was set identically.
Fig. 5.

The probability map of the putative hubs in macaques (upper two rows), chimpanzees (middle two rows) and humans (bottom two rows). For each species, the left two columns showed the lateral, medial, dorsal and ventral views of the left hemisphere and the right two columns showed the corresponding views for the right hemisphere. The cortical parcels with at least two out of four centrality measures placed in the top 10% were first identified under five network densities (10%, 15%,20%,25%,30%) and two resolutions (N=300,600) respectively. Then these hubs that were identified under a specific network density and resolution were binarized and averaged for a probability map. Brain regions with high intensities in the resulting map are frequently identified as hubs. Labels for humans and macaques were based on the nomenclature proposed by Kotter and Wanke (2005) and areas for chimpanzees were labeled based on their putative homologues in humans and macaques (Kotter and Wanke, 2005). Abbreviations: CCp, posterior cingulate cortex; CCr, retrosplenial cingulate cortex; Ia, anterior insular; Ip, posterior insula; M1, primary motor cortex; PCi, inferior parietal cortex; PCip, cortex of the intraparietal sulcus; PCm, medial parietal cortex; PCs, superior parietal cortex; PFCm, medial prefrontal cortex; PFCoi, intermediate orbital prefrontal cortex; PFCol, orbitolateral prefrontal cortex; PFCom, orbitomedial prefrontal cortex; PFCpol, polar prefrontal cortex; PFCvl, ventrolateral prefrontal cortex; PMCm, medial (supplementary) premotor cortex; V1, primary visual cortex; V2, secondary visual cortex;
Table 3.
The identified putative hubs in macaques, chimpanzees and humans and their structural and functional importance in literature.
| Species | Hemi | Cortex[1] | Possible areas reported in literature[2] |
Structural & functional importance in literature |
Literature | Type of network |
|---|---|---|---|---|---|---|
| Macaques | Left | medial parietal cortex |
PGm |
PGm: components of the default mode network (DMN) PGm: top 10 (out of 383) in out- degree PGm: top 10% across four centrality measures |
(Harriger et al., 2012; Kojima et al., 2009; Mantini et al., 2011; Modha and Singh, 2010) |
PET, task fMRI, tracer |
| inferior parietal cortex |
PCi, 7a | 7a: identified as a hub, 7a: a component of DMN PCi: identified as a hub |
(Bezgin et al., 2012; Sporns et al., 2007; Vincent et al., 2007) |
Tracer, rs- fMRI |
||
| insular cortex | Ia,Ip, Iai | Iai: rich-club region | (Harriger et al., 2012) | Tracer | ||
| medial prefrontal cortex |
PFCm, 32, 24, 9 |
32, 24, 9: components of DMN 32: top 10 (out of 383) in in-degree and BC 24: top 10 in degree and BC 9: top 10 in out-degree 24: top 10% across four centrality measures 32: top 10% across four centrality measures |
(Harriger et al., 2012; Mantini et al., 2011; Modha and Singh, 2010) |
Task fMRI, tracer |
||
| ventrolateral and orbitolateral prefrontal cortex |
PFCvl , PFCol, 46d,46, 12, 12o,12l |
46d: a component of DMN 46: identified as a hub 12: components of resting-state networks 46: top 10 in degree and BC 12o,12l: top 10 in in-degree PFCvl: identified as a hub 46: top 10% across four centrality measures |
(Bezgin et al., 2012; Kojima et al., 2009; Mantini et al., 2011; Modha and Singh, 2010; Sporns et al., 2007) |
Task fMRI, tracer, PET |
||
| primary visual cortex |
V1 | a component of resting-state networks | (Hutchison et al., 2011) | Rs-fMRI | ||
| right | medial parietal cortex |
PGm | PGm: components of DMN PGm: top 10 (out of 383) in out- degree PGm: top 10% across four centrality measures |
(Harriger et al., 2012; Kojima et al., 2009; Mantini et al., 2011; Modha and Singh, 2010) |
PET, task fMRI, tracer |
|
| inferior parietal cortex |
PCi,7a | 7a: identified as a hub, 7a: a component of DMN PCi: identified as a hub |
(Bezgin et al., 2012; Sporns et al., 2007; Vincent et al., 2007) |
Tracer, rs- fMRI |
||
| insular cortex | Ia,Ip, Iai | Iai: rich-club region | (Harriger et al., 2012) | Tracer | ||
| medial prefrontal cortex |
PFCm, 32, 24,9 | 32, 24, 9: components of DMN 32: top 10 in in-degree and BC 24: top 10 in degree and BC 9: top 10 in out-degree 24: top 10% across four centrality measures 32: top 10% across four centrality measures |
(Harriger et al., 2012; Mantini et al., 2011; Modha and Singh, 2010) |
Task fMRI, tracer |
||
| ventrolateral and orbitolateral prefrontal cortex |
PFCvl, PFCol, 46d,46, 12, 12o, 12l |
46d: components of DMN 46: identified as a hub 12: components of resting-state networks 46: top 10 (out of 383) in degree and BC 12o,12l: top 10 in in-degree PFCvl: identified as a hub 46: top 10% across four centrality measures |
(Bezgin et al., 2012; Kojima et al., 2009; Mantini et al., 2011; Modha and Singh, 2010; Sporns et al., 2007) |
Task fMRI, tracer, PET |
||
| primary and secondary visual cortex |
V1,V2 | Component of resting-state networks V2: top 10 in out-degree |
(Hutchison et al., 2011; Modha and Singh, 2010) |
Rs-fMRI, tracer |
||
| Chimpanzee |
Left | medial parietal cortex |
PCm | Components of resting-state networks | (Rilling et al., 2007) | PET |
| inferior parietal cortex |
PCi | Components of resting-state networks | (Rilling et al., 2007) | PET | ||
| insular cortex | Ia, Ip | |||||
| medial prefrontal cortex |
PFCm | Components of resting-state networks | (Rilling et al., 2007) | PET | ||
| ventrolateral, polar prefrontal cortex |
PFCvl, PFCpol | Components of resting-state networks | (Rilling et al., 2007) | PET | ||
| primary visual cortex |
V1 | |||||
| right | medial parietal cortex |
PCm | Components of resting-state networks | (Rilling et al., 2007) | PET | |
| inferior parietal cortex |
PCi | Components of resting-state networks | (Rilling et al., 2007) | PET | ||
| insular cortex | Ia, lp | |||||
| medial prefrontal cortex |
PFCm | Components of resting-state networks | (Rilling et al., 2007) | PET | ||
| ventrolateral, polar prefrontal cortex |
PFCvl, PFCpol | Components of resting-state networks | (Rilling et al., 2007) | PET | ||
| Primary visual cortex |
V1 | |||||
| Humans | Left | medial parietal cortex |
PCm, PCUN | Components of DMN PCUN: ranked top 25% in degrees and BC PCm: rich-club region |
(Gong et al., 2009; Greicius et al., 2003; Hagmann et al., 2008; Li et al., 2012) |
Task & rs- fMRI; diffusion MRI |
| intraparietal sulcus and superior parietal cortex |
PCip, PCs, SP | SP: the top 25% in BC SP: rich-club region |
(Hagmann et al., 2008) (van den Heuvel et al., 2011) |
Diffusion MRI |
||
| insular cortex | Ia,Ip, | The top 10% in BC | (Iturria-Medina et al., 2008) | Diffusion MRI |
||
| medial premotor cortex |
PMCm, SFG | SFG: identified as a hub | (Gong et al., 2009) | Diffusion MRI |
||
| primary motor cortex |
M1 | |||||
| retrosplenial cingulate cortex |
CCr, ISTC | ISTC: top 25% in degree and BC | (Hagmann et al., 2008) | Diffusion MRI |
||
| right | medial parietal cortex |
PCm, PCUN | Components of DMN PCUN: ranked top 25% in degrees and BC PCm: rich-club region |
(Gong et al., 2009; Greicius et al., 2003; Hagmann et al., 2008; Li et al., 2012) |
Task & rs- fMRI; diffusion MRI |
|
| intraparietal sulcus and superior parietal cortex |
PCip, PCs, SP | SP: the top 25% in BC SP: rich-club region |
(Hagmann et al., 2008) (van den Heuvel and Sporns, 2011) |
Diffusion MRI |
||
| insular cortex | Ia,Ip, | The top 10% in BC | (Iturria-Medina et al., 2008) | Diffusion MRI |
||
| medial premotor cortex |
PMCm, SFG | SFG: identified as a hub | (Gong et al., 2009) | Diffusion MRI |
||
| primary motor cortex |
M1 | |||||
| retrosplenial cingulate cortex |
CCr, ISTC | ISTC: top 25% in degree and BC | (Hagmann et al., 2008) | Diffusion MRI |
The nomenclature for cortical areas is based on the study by Kotter et al., (Kotter and Wanke, 2005)
For areas studied in literature, the abbreviations in Kotter et al., were first used, followed by the abbreviations in the related literature. For the full names of these abbreviations other than these from Kotter’s work, they are as follows: PCUN: precuneus; SP: superior parietal cortex; SFG: superior frontal gyrus; ISTC: isthmus of the cingulate cortex.
In sum, we found common hubs in ventrolateral prefrontal cortex, insula, medial parietal cortex, and restrosplenial cingulate cortex in all three species. Macaques and chimpanzees showed hubs in medial prefrontal cortex, inferior parietal cortex and V1 that are lacking in the corresponding brain regions in humans. On the other hand, hubs in intraparietal/superior parietal cortex, and medial premotor cortex were detected in humans but were absent in the corresponding brain regions in two non-human primates. Chimpanzees were intermediate between macaques and humans with regard to the hub distribution, but generally showed more similarity to macaques than to humans, consistent with the observations via myelin maps of the three species (Glasser et al., 2012).
Discussion
In this study, we employed a data-driven approach, without need for predefined cortical parcellation schemes based on cytoarchitecture or on gross anatomical landmarks, to analyze the brain connectomes of macaques, chimpanzees and humans. We compared characteristics of brain networks across species using graph-theoretic methods for measuring tractography-derived putative hubs under multiple network densities and resolutions. Our results demonstrated a reasonable correspondence in certain brain regions between tracer- and tractography- derived hubs in monkeys. Furthermore, the most central brain regions are usually symmetric in the two hemispheres. Hubs were found in the medial parietal, insular, retrosplenial cingulate and ventrolateral prefrontal cortex in all three species, suggesting that the structural organization within these regions is conserved among the three primate species. Major differences at the polar and medial prefrontal cortices, as well as the inferior parietal cortex, were found between humans and the other two non-human primates, indicating possible cross-species differences in the connectivity patterns of these areas.
Comparison of hubs identified using tracer and tractography methods
To the best of our knowledge, this is the first attempt to directly compare structural hubs identified based on two different techniques (tract tracer and diffusion tractography). We believe such evaluations are essential prerequisites for advancing the use of diffusion tractography and graph theory in human brain network analyses. In our results, we found reasonable overlap between tracer and tractography results for multiple brain regions, although considerable disparities were also observed. It should be noted that the graph-theoretic characteristics of the two types of networks are not expected to be identical, due to significant limitations in both methods: although invasive tracers are probably the most reliable ways to study inter-areal connections in real brain tissues and the tracer-based gold standard used in our study is the most comprehensive one available for monkeys, they are not without problems: the accuracy of tracer-based connectivity studies may be affected by the choice of injection sites, incomplete tracer uptake and/or spread, the histology methods employed for detecting the labeled brain areas (Caspers et al., 2011; Kobbert et al., 2000). Moreover, our gold standard was collated from 410 anatomical tracing studies with hierarchical parcellations (Modha and Singh, 2010), which has been demonstrated to affect the distribution of tracer-derived hubs (Bezgin et al., 2012). The limitations of diffusion tractography include the lack of directionality, geometric biases favoring gyral connectivity in vertex-to-vertex tractography analyses, limited spatial resolution and varying sensitivity to different fiber systems. Furthermore, as no anatomical priors were usually applied to constrain tractography in whole-brain network analyses, more false positive/negative connections are expected compared to the studies in which prior knowledge on anatomical connectivity was used for deriving major white matter fasciculi in the brain.
The common PCm hub in macaques, chimpanzees and humans
The medial parietal cortex (PCm) was identified as a putative hub in all three primate species. PCm is located between the somatosensory and visual cortex, well situated to play a multimodal, integrative functional role. It is usually associated with high-level cognitive functions in humans, such as episodic memory, aspects of consciousness and self-related processing (Margulies et al., 2009; Vogt and Laureys, 2005). Brain network studies using diffusion tractography have shown that the medial parietal cortex (including the precuneus) is among the most consistently reported structural hubs in humans (Gong et al., 2009a; Hagmann et al., 2008; Iturria-Medina et al., 2008; Li et al., 2012b). Similarly, graph-theoretic approaches based on monkey tracer results also strongly suggest the importance of the medial parietal cortex in monkey brain architecture. For example, recent studies that analyzed brain connectivity in macaques by collating all the connection information in CoCoMac database (Collations of Connectivity data on the Macaque brain, cocomac.g-node.org) demonstrated that PGm in the medial parietal cortex ranks in the top 10 out of 383 brain regions in terms of out-degree (degree for directed graphs), and acts as a component of the structural core and centrality hubs, highlighting its central role in information distribution (Harriger et al., 2012; Modha and Singh, 2010). Moreover, evidence from a resting-state fMRI study also suggested that humans and macaques may share similar intrinsic functional architecture at the precuneus (Margulies et al., 2009). Based on the evidence in the literature obtained via various methodologies and in both humans and monkeys, we propose that the identified hub at the medial parietal cortex in our study is a brain structural hub that has been largely preserved across the three primate species and may have similar functions in them as well. Given the large amount of information being integrated in medial parietal cortex, we might expect it to be among the most metabolically active areas of the brain, and this is indeed the case in both humans and chimpanzees (Raichle et al., 2001; Rilling et al., 2007).
The common insula hub in macaques, chimpanzees and humans
The anterior insula that was consistently identified as a tractography hub in our study is documented as visceral somatosensory cortex that receives feedback from the body (Craig, 2002, 2003; Critchley, 2005). It is part of a salience network (Seeley et al., 2007), and has been proposed as an integral hub that mediates dynamic interactions between other large-scale brain networks involved in externally oriented attention and internally oriented or self-related cognition (Menon and Uddin, 2010). Our data suggest that these functions of the insula may be preserved among non-human primates, as well as humans. However, these results should be interpreted with caution (see limitation section for details).
The differences in PCi between humans and non-human primates
Using landmark-based surface registration for interspecies comparison, Van Essen and colleagues found that human PCi, together with lateral prefrontal cortex, is the most expanded brain area compared to macaques (Van Essen and Dierker, 2007). In macaques, area 7a is considered as a visually responsive area for space perception and guidance of motor behavior, whereas area 7b contains somatosensory, mouth, face and arm fields. Several network analyses based on the tracer data in macaques have identified PCi as a hub, consistent with our findings at PCi in macaques using diffusion tractography (Bezgin et al., 2012; Harriger et al., 2012; Sporns et al., 2007). In contrast, few tractography-based brain network analyses in humans reported PCi hub (see Fig.1 in (Li et al., 2011)), which is in good line with our observations in human PCi in the present study. We also noted that PCi hub has been more frequently reported in functional MRI-based network analyses in humans(Buckner et al., 2009; Cole et al., 2010), although the exact reason behind the inconsistent findings between the tractography- and functional MRI-based network analyses is still unclear. In the present study, we found hubs in macaque and chimpanzee PCi using diffusion tractography (Fig.3). However, the PCi hubs were not observed in humans (Fig.5). It has been suggested that area 7a and 7b in macaques, which are located in PCi, are homologous to area 7 in human PCs, instead of PCi (Culham and Kanwisher, 2001; Stiles et al., 1988; Van Essen and Dierker, 2007). If macaque PCi and human PCs are indeed homologous, the identified structural hubs in the macaque and chimpanzee PCi in the current study may correspond to those identified in human PCs/PCip (Fig.5), suggesting preserved hubs in these regions between humans and non-human primates.
The difference in PFCm between humans and non-human primates
Perhaps one of the most intriguing findings in the current study is the presence of the structural hubs in the polar and medial prefrontal cortices (PFCpol, PFCm) in two non-human primate species, in contrast to the absence of such hubs in humans (Fig.5). Lateral and medial prefrontal cortices receive highly processed sensory afferents, influence visceral functions, participate in high-order cognitive functions and guide emotional and reward-related behaviors (Ongur et al., 2003; Ongur and Price, 2000). Graph theoretic analysis of anatomical tracer studies in monkeys has clearly demonstrated the structural importance of these regions (Bezgin et al., 2012; Harriger et al., 2012; Lewis and Van Essen, 2000; Modha and Singh, 2010; Sporns et al., 2007; Stephan et al., 2001). Several areas in the medial prefrontal cortex, including areas 9, 24 and 32 are ranked near the top in degree and/or betweenness centrality (see table 3 for details). In fact, a recent network analysis based on tracer-derived connections in monkeys estimated that 7 of top 10 brain regions in terms of several centrality measures were found to reside in the prefrontal cortex (Modha and Singh, 2010). These results are in good agreement with our findings of structural hubs in macaque prefrontal cortex using diffusion tractography, highlighting the importance of these areas in macaque brain structural networks.
Invasive tracer methods cannot be applied in humans and therefore human brain network studies have been conducted using non-invasive imaging such as diffusion tractography (Gong et al., 2009a; Hagmann et al., 2008; Iturria-Medina et al., 2008) and cortical thickness measures (He et al., 2007). Similar to our observations in humans, hubs have not been consistently reported in the polar and medial prefrontal cortices in the human literature (Bastiani et al., 2012; Hagmann et al., 2008; Iturria-Medina et al., 2008; Li et al., 2012b), especially in studies where the medial and polar prefrontal cortex were distinguished from the superior frontal cortex using high-resolution parcellation schemes. For example, in a seminal study by Hagmann and colleagues (Hagmann et al., 2008) the human cerebral cortex was divided into 998 parcels and structural hubs were mapped based on degree or BC. Hubs were not observed in the prefrontal pole (Fig.6 and Fig.7 in Hagmann et al.).
A fundamental question is therefore why these interspecies differences exist in the prefrontal hubs. Human prefrontal cortex is among the most enlarged brain regions compared to other primates (Preuss, 2011; Schoenemann et al., 2005; Van Essen and Dierker, 2007). The human prefrontal cortex forms 28.5% of human neocortex in contrast to only 11.3% in macaque brain (Brodmann, 1913; Passingham, 2009). Compared to the chimpanzee brain, the polar prefrontal cortex (area 10) of humans is proportionately twice as large (Semendeferi et al., 2001). A recent comparative study using cortical myelin maps based on T1/T2 images also demonstrated a greatly expanded, lightly myelinated region of prefrontal cortex in humans when compared with that in macaques and chimpanzees (Glasser et al., 2012). Moreover, human prefrontal cortex is more gyrified than prefrontal cortex of other primates, even after controlling for differences in brain size (Rilling and Insel, 1999). These morphological and microstructural changes suggest that the prefrontal cortex became specialized during hominin evolution. Structural interspecies differences in the prefrontal areas are also supported by comparative functional MRI evidences (Astafiev et al., 2003; Denys et al., 2004b; Mantini et al., 2012a; Mantini et al., 2012b). When mapping preparatory signals for looking at a visual location, large differences in the functional organizations of the prefrontal cortex were found between macaques and humans (Astafiev et al., 2003). In another study to assess the information reaching the prefrontal cortex, Denys and colleagues reported that the prefrontal object-related visual activations in macaques constituted 4.2% of the total volume of the prefrontal cortex, fivefold greater than that of humans (Denys et al., 2004a). As functional connectivity is constrained by anatomical circuitry (Honey et al., 2009; Honey et al., 2010), the interspecies difference in functional activations found in these studies could be explained by the differences in connectivity patterns in the prefrontal cortex as reflected in our results.
An alternative explanation for the lack of prefrontal hubs in humans relates to the sensitivity of diffusion tractography to the coherence of white-matter bundles. It is well known that tractography is more sensitive to large and coherent white matter bundles (Catani and Thiebaut de Schotten, 2008; Mori et al., 2002). Since human prefrontal cortex is large and more gyrified than the other two non-human primates, it is possible that the terminations of the major white matter bundles connecting to the prefrontal gray matter in humans have evolved more diffuse trajectories and/or larger bending angles relative to the GM/WM surfaces to accommodate the enlarged and more gyrified prefrontal cortex, making them less detectable using current diffusion tractography algorithms.
Resting-state functional MRI (rsfMRI), which assesses the brain’s spontaneous intrinsic activity and does not suffer from the above-mentioned shortcomings in diffusion tractography, may be helpful in explaining the lack of human PFCm hubs in tractography-derived brain networks. Unfortunately, hub identification in PFCm using rsfMRI-based brain networks has not been consistent, either (Achard and Bullmore, 2007; Buckner et al., 2009; Cole et al., 2010; Lohmann et al., 2010; van den Heuvel et al., 2008). For example, using degree centrality as the measure, Buckner et.al., identified functional hubs in medial prefrontal cortex. However, such functional hubs in PFCm were not observed in another analysis based on voxelwise functional brain networks and degree centrality (van den Heuvel et al., 2008). Inconsistency in the literature could be due to different preprocessing steps, choice of parcellation scheme and criteria for hub selection. It should also be noted that the functional connections based on rsfMRI are polysynaptic in nature, in contrast to the usual monosynaptic connections in tractography-based network analyses, which may contribute to the differences in hub distribution across the two imaging modalities. We also plotted the projection patterns of the white-matter pathways originated from the medial prefrontal cortex across the species (supplementary Fig.4). However, readers are cautioned not to use the results to justify the existence or absence of hubs in that specific region (see the captions in supplementary Fig.4 for details).
Parceling and analyzing brain networks at multiple scales
The node is the most basic and important element of a network and its definition directly affects the outcome of network analyses (Cammoun et al., 2012; van Wijk et al., 2010; Zalesky et al., 2010). Parceling the cerebral cortex of macaques has been a century-long effort (Van Essen et al., 2012a). Currently, there are several available cortical parcellation schemes for macaque cortex. However, a recent investigation that coregistered these independently derived parcellation schemes onto a common cortical surface showed that the number of areas (ranging from 26 to 161 each hemisphere) and their boundaries vary significantly (Ferry et al., 2000; Markov et al., 2011; Paxinos et al., 2000; Van Essen et al., 2012a). Such variability will certainly affect outcomes of brain network analyses (Bezgin et al., 2012; Van Essen et al., 2012a). A detailed, consensus whole-brain parcellation scheme for the human cortex is lacking (Van Essen et al., 2012b), which is a probable cause of hub inconsistency in the literature (Bassett et al., 2011; Li et al., 2012b; Zalesky et al., 2010). Cytoarchitectonic mapping of the chimpanzee brain (Bailey, 1950; Schenker et al., 2010; Spocter et al., 2010) is still in its infancy, making it impractical to explore their brain networks using a well-defined whole-brain parcellation scheme. Although it is ideal to have neurobiologically delineated parcellation schemes for connectome studies as suggested by Wig and colleagues(Wig et al., 2011), such parcellation schemes that are comparable across the three species and controlled for the node number in network analyses will not be available in the near future. Alternatively, we proposed to randomly and repeatedly parcellate the cortex at multiple scales for a balance of sensitivity and robustness in our network analyses (Fig.1c). Using this strategy, it is possible to compare interspecies structural connectomes for insights into human brain specializations without well-defined, neurobiologically delineated parcellation schemes for each species. Indeed, we identified several common hubs across species that have been frequently reported in literature using different methodologies, as well as a few significant interspecies differences in the frontal and parietal association cortices, two of the most expanded brain regions in humans (Mantini et al., 2012a; Van Essen and Dierker, 2007). It should be noted that the preliminary results in the current study are based on only two random parcellation schemes, an initial attempt for achieving parcellation-independent network analysis as illustrated in Fig.1c. Future studies with more repeated sampling and varying parcel sizes are desired to obtain maps of hub distribution independent of the node definition.
Several technical limitations warrant discussion: First, although great effort has been made to match data quality across species, acquiring diffusion MR data from several primate species that have major differences in brain size and head anatomy requires somewhat different protocols. Thus, data heterogeneity is expected to be larger than studies based on only a single species. Second, as there are currently over a dozen tractography algorithms that could be utilized for building anatomical brain networks, selecting different tractography algorithms (for example, local vs. global tractography; deterministic vs. probabilistic tractography; model-based vs. model-free method) could alter the distribution of identified hubs. These are, however, not likely to modify the major conclusions in the study, as many of our findings have been replicated in other studies using various tractography algorithms. Third, as the parcel size in our study is similar across the brain, in contrast to the variable parcel sizes obtained using cytoarchitectonical/multi-modal methods (Van Essen et al., 2012a), it is possible that certain structural hubs with small brain areas may be missed. Last, one unique geometric feature of the insular cortex compared to the other cortices is that a large proportion of its WM/GM surface (the seed mask in our tractography analysis) is adjacent to the external/extreme capsules, through which several major white matter pathways pass (including the inferior fronto-occipital fasciculus, the inferior longitudinal fasciculus and uncinate fasciculus, etc). Whether this geometric positioning contributes to its identification as a hub in the low-resolution diffusion MR data warrants further investigation.
To summarize, we mapped the anatomical brain networks of macaques, chimpanzees and humans using diffusion tractography and analyzed the characteristics of their brain networks via graph theory. When comparing our tractography-derived brain networks in monkeys with those derived by invasive tracer studies, we find a reasonable correspondence between the two in terms of hub distribution. In all three species, putative hubs were consistently identified at the medial parietal, insular, the retrosplenial cingulate and ventrolateral prefrontal cortices, indicating a largely preserved structural architecture associated with these brain regions. Interesting disparities were found between humans and non-human primates in the inferior parietal, as well as the polar and medial prefrontal cortex, suggesting potentially significant changes of connectivity patterns within these regions during human evolution.
Supplementary Material
Fig. 2.

Flowchart of deriving whole-brain anatomical brain networks. The procedures could be divided into three steps: First, a surface template was generated on a sphere space and randomly parcellated into 300 and 600 parcels with the medial wall excluded. The parcellation schemes were transformed to the template original surface (1a). Each subject’s original WM/GM boundary surface was constructed based on the T1-weighted images using the FreeSurfer (1b). Then the parcellation schemes were transformed to each subject’s surface space (1c). In the second step, local diffusion orientation distribution functions in each voxel of subject’s diffusion data were estimated using FDT toolbox (2). Then the connections between each cortical parcel pairs were reconstructed by sending millions of samples from vertices on the WM/GM interface surface and the number of the “probabilistic streamlines” sent from every vertex and reached every other vertices were counted and summed over parcels for graph-theoretic analyses (3).
Highlights.
We use diffusion tractography to derive brain networks of three primate species
Tractography-based hubs partially overlap with tracer-based hubs
Hubs are found in PCm, insular and PFCvl cortex in all three species
Major species differences are found in PCi, polar and PFCm cortex
Acknowledgements
We sincerely thank Dr. Govind Nair, Dr. Xiaodong Zhang for assisting the data acquisition and Lei Zhou for the helpful discussions, the anonymous reviewers for their constructive comments and suggestions. We also must thank Dr. Olaf Sporns for providing data for plotting hubs based on tracer-derived brain networks. This work was supported by NIH (5P01 AG026423-03, P50-HD073921-01), the National Center for Research Resources (P51RR165) and the Office of Research Infrastructure Programs (P51OD11132).
Footnotes
Publisher's Disclaimer: This is a PDF file of an unedited manuscript that has been accepted for publication. As a service to our customers we are providing this early version of the manuscript. The manuscript will undergo copyediting, typesetting, and review of the resulting proof before it is published in its final citable form. Please note that during the production process errors may be discovered which could affect the content, and all legal disclaimers that apply to the journal pertain.
References
- Achard S, Bullmore E. Efficiency and cost of economical brain functional networks. PLoS Comput Biol. 2007;3:e17. doi: 10.1371/journal.pcbi.0030017. [DOI] [PMC free article] [PubMed] [Google Scholar]
- Andersson JL, Skare S, Ashburner J. How to correct susceptibility distortions in spin-echo echo-planar images: application to diffusion tensor imaging. Neuroimage. 2003;20:870–888. doi: 10.1016/S1053-8119(03)00336-7. [DOI] [PubMed] [Google Scholar]
- Astafiev SV, Shulman GL, Stanley CM, Snyder AZ, Van Essen DC, Corbetta M. Functional organization of human intraparietal and frontal cortex for attending, looking, and pointing. J Neurosci. 2003;23:4689–4699. doi: 10.1523/JNEUROSCI.23-11-04689.2003. [DOI] [PMC free article] [PubMed] [Google Scholar]
- Bailey P. The isocortex of the chimpanzee. Urbana: Univ. of Illinois Press; 1950. [Google Scholar]
- Bailey P, Bonin Gv, McCulloch WS. The isocortex of the chimpanzee. Urbana, IL: Univ. of Illionois Press; 1950. [Google Scholar]
- Basser PJ, Pajevic S, Pierpaoli C, Duda J, Aldroubi A. In vivo fiber tractography using DT-MRI data. Magn Reson Med. 2000;44:625–632. doi: 10.1002/1522-2594(200010)44:4<625::aid-mrm17>3.0.co;2-o. [DOI] [PubMed] [Google Scholar]
- Bassett DS, Brown JA, Deshpande V, Carlson JM, Grafton ST. Conserved and variable architecture of human white matter connectivity. Neuroimage. 2011;54:1262–1279. doi: 10.1016/j.neuroimage.2010.09.006. [DOI] [PubMed] [Google Scholar]
- Bastiani M, Shah NJ, Goebel R, Roebroeck A. Human cortical connectome reconstruction from diffusion weighted MRI: The effect of tractography algorithm. Neuroimage. 2012;62:1732–1749. doi: 10.1016/j.neuroimage.2012.06.002. [DOI] [PubMed] [Google Scholar]
- Behrens TE, Berg HJ, Jbabdi S, Rushworth MF, Woolrich MW. Probabilistic diffusion tractography with multiple fibre orientations: What can we gain? Neuroimage. 2007;34:144–155. doi: 10.1016/j.neuroimage.2006.09.018. [DOI] [PMC free article] [PubMed] [Google Scholar]
- Behrens TE, Woolrich MW, Jenkinson M, Johansen-Berg H, Nunes RG, Clare S, Matthews PM, Brady JM, Smith SM. Characterization and propagation of uncertainty in diffusion-weighted MR imaging. Magn Reson Med. 2003;50:1077–1088. doi: 10.1002/mrm.10609. [DOI] [PubMed] [Google Scholar]
- Bezgin G, Vakorin VA, van Opstal AJ, McIntosh AR, Bakker R. Hundreds of brain maps in one atlas: registering coordinate-independent primate neuro-anatomical data to a standard brain. Neuroimage. 2012;62:67–76. doi: 10.1016/j.neuroimage.2012.04.013. [DOI] [PubMed] [Google Scholar]
- Brodmann K. Neue Forchungsergebnisse der Grosshirnrindeanatomische mit besonderer Berucksichtung anthropologischer Fragen. Gesselch. Deuts. Naturf. Artze. 1913;85:200–240. [Google Scholar]
- Buckner RL, Sepulcre J, Talukdar T, Krienen FM, Liu H, Hedden T, Andrews-Hanna JR, Sperling RA, Johnson KA. Cortical hubs revealed by intrinsic functional connectivity: mapping, assessment of stability, and relation to Alzheimer's disease. J Neurosci. 2009;29:1860–1873. doi: 10.1523/JNEUROSCI.5062-08.2009. [DOI] [PMC free article] [PubMed] [Google Scholar]
- Bullmore E, Sporns O. Complex brain networks: graph theoretical analysis of structural and functional systems. Nat Rev Neurosci. 2009;10:186–198. doi: 10.1038/nrn2575. [DOI] [PubMed] [Google Scholar]
- Cammoun L, Gigandet X, Meskaldji D, Thiran JP, Sporns O, Do KQ, Maeder P, Meuli R, Hagmann P. Mapping the human connectome at multiple scales with diffusion spectrum MRI. J Neurosci Methods. 2012;203:386–397. doi: 10.1016/j.jneumeth.2011.09.031. [DOI] [PubMed] [Google Scholar]
- Caspers S, Eickhoff SB, Rick T, von Kapri A, Kuhlen T, Huang R, Shah NJ, Zilles K. Probabilistic fibre tract analysis of cytoarchitectonically defined human inferior parietal lobule areas reveals similarities to macaques. Neuroimage. 2011;58:362–380. doi: 10.1016/j.neuroimage.2011.06.027. [DOI] [PMC free article] [PubMed] [Google Scholar]
- Catani M, Thiebaut de Schotten M. A diffusion tensor imaging tractography atlas for virtual in vivo dissections. Cortex. 2008;44:1105–1132. doi: 10.1016/j.cortex.2008.05.004. [DOI] [PubMed] [Google Scholar]
- Cole MW, Pathak S, Schneider W. Identifying the brain's most globally connected regions. Neuroimage. 2010;49:3132–3148. doi: 10.1016/j.neuroimage.2009.11.001. [DOI] [PubMed] [Google Scholar]
- Craig AD. How do you feel? Interoception: the sense of the physiological condition of the body. Nat Rev Neurosci. 2002;3:655–666. doi: 10.1038/nrn894. [DOI] [PubMed] [Google Scholar]
- Craig AD. Interoception: the sense of the physiological condition of the body. Curr Opin Neurobiol. 2003;13:500–505. doi: 10.1016/s0959-4388(03)00090-4. [DOI] [PubMed] [Google Scholar]
- Critchley HD. Neural mechanisms of autonomic, affective, and cognitive integration. J Comp Neurol. 2005;493:154–166. doi: 10.1002/cne.20749. [DOI] [PubMed] [Google Scholar]
- Culham JC, Kanwisher NG. Neuroimaging of cognitive functions in human parietal cortex. Curr Opin Neurobiol. 2001;11:157–163. doi: 10.1016/s0959-4388(00)00191-4. [DOI] [PubMed] [Google Scholar]
- Denys K, Vanduffel W, Fize D, Nelissen K, Peuskens H, Van Essen D, Orban GA. The processing of visual shape in the cerebral cortex of human and nonhuman primates: a functional magnetic resonance imaging study. J Neurosci. 2004a;24:2551–2565. doi: 10.1523/JNEUROSCI.3569-03.2004. [DOI] [PMC free article] [PubMed] [Google Scholar]
- Denys K, Vanduffel W, Fize D, Nelissen K, Sawamura H, Georgieva S, Vogels R, Van Essen D, Orban GA. Visual activation in prefrontal cortex is stronger in monkeys than in humans. J Cogn Neurosci. 2004b;16:1505–1516. doi: 10.1162/0898929042568505. [DOI] [PubMed] [Google Scholar]
- Felleman DJ, Van Essen DC. Distributed hierarchical processing in the primate cerebral cortex. Cereb Cortex. 1991;1:1–47. doi: 10.1093/cercor/1.1.1-a. [DOI] [PubMed] [Google Scholar]
- Ferry AT, Ongur D, An X, Price JL. Prefrontal cortical projections to the striatum in macaque monkeys: evidence for an organization related to prefrontal networks. J Comp Neurol. 2000;425:447–470. doi: 10.1002/1096-9861(20000925)425:3<447::aid-cne9>3.0.co;2-v. [DOI] [PubMed] [Google Scholar]
- Glasser MF, Preuss TM, Nair G, Rilling JK, Zhang X, Li L, Van Essen D. Improved Cortical Myelin Maps in Humans, Chimpanzees, and Macaques Allow Identification of Putative Areal Homologies. New Orleans: Society for Neuroscience; 2012. [Google Scholar]
- Gong G, He Y, Concha L, Lebel C, Gross DW, Evans AC, Beaulieu C. Mapping anatomical connectivity patterns of human cerebral cortex using in vivo diffusion tensor imaging tractography. Cereb Cortex. 2009a;19:524–536. doi: 10.1093/cercor/bhn102. [DOI] [PMC free article] [PubMed] [Google Scholar]
- Gong G, Rosa-Neto P, Carbonell F, Chen ZJ, He Y, Evans AC. Age- and gender-related differences in the cortical anatomical network. J Neurosci. 2009b;29:15684–15693. doi: 10.1523/JNEUROSCI.2308-09.2009. [DOI] [PMC free article] [PubMed] [Google Scholar]
- Greicius MD, Krasnow B, Reiss AL, Menon V. Functional connectivity in the resting brain: a network analysis of the default mode hypothesis. Proc Natl Acad Sci U S A. 2003;100:253–258. doi: 10.1073/pnas.0135058100. [DOI] [PMC free article] [PubMed] [Google Scholar]
- Hagmann P, Cammoun L, Gigandet X, Meuli R, Honey CJ, Wedeen VJ, Sporns O. Mapping the structural core of human cerebral cortex. PLoS Biol. 2008;6:e159. doi: 10.1371/journal.pbio.0060159. [DOI] [PMC free article] [PubMed] [Google Scholar]
- Harriger L, van den Heuvel MP, Sporns O. Rich club organization of macaque cerebral cortex and its role in network communication. PLoS One. 2012;7:e46497. doi: 10.1371/journal.pone.0046497. [DOI] [PMC free article] [PubMed] [Google Scholar]
- He Y, Chen ZJ, Evans AC. Small-world anatomical networks in the human brain revealed by cortical thickness from MRI. Cereb Cortex. 2007;17:2407–2419. doi: 10.1093/cercor/bhl149. [DOI] [PubMed] [Google Scholar]
- Hecht EE, Gutman DA, Preuss TM, Sanchez MM, Parr LA, Rilling JK. Process Versus Product in Social Learning: Comparative Diffusion Tensor Imaging of Neural Systems for Action Execution-Observation Matching in Macaques, Chimpanzees, and Humans. Cereb Cortex: 2012. [DOI] [PMC free article] [PubMed] [Google Scholar]
- Honey CJ, Sporns O, Cammoun L, Gigandet X, Thiran JP, Meuli R, Hagmann P. Predicting human resting-state functional connectivity from structural connectivity. Proc Natl Acad Sci U S A. 2009;106:2035–2040. doi: 10.1073/pnas.0811168106. [DOI] [PMC free article] [PubMed] [Google Scholar]
- Honey CJ, Thivierge JP, Sporns O. Can structure predict function in the human brain? Neuroimage. 2010;52:766–776. doi: 10.1016/j.neuroimage.2010.01.071. [DOI] [PubMed] [Google Scholar]
- Iturria-Medina Y, Perez Fernandez A, Morris DM, Canales-Rodriguez EJ, Haroon HA, Garcia Penton L, Augath M, Galan Garcia L, Logothetis N, Parker GJ, Melie-Garcia L. Brain hemispheric structural efficiency and interconnectivity rightward asymmetry in human and nonhuman primates. Cereb Cortex. 2011;21:56–67. doi: 10.1093/cercor/bhq058. [DOI] [PubMed] [Google Scholar]
- Iturria-Medina Y, Sotero RC, Canales-Rodriguez EJ, Aleman-Gomez Y, Melie-Garcia L. Studying the human brain anatomical network via diffusion-weighted MRI and Graph Theory. Neuroimage. 2008;40:1064–1076. doi: 10.1016/j.neuroimage.2007.10.060. [DOI] [PubMed] [Google Scholar]
- Jouve B, Rosenstiehl P, Imbert M. A mathematical approach to the connectivity between the cortical visual areas of the macaque monkey. Cereb Cortex. 1998;8:28–39. doi: 10.1093/cercor/8.1.28. [DOI] [PubMed] [Google Scholar]
- Kaiser M. A tutorial in connectome analysis: topological and spatial features of brain networks. Neuroimage. 2011;57:892–907. doi: 10.1016/j.neuroimage.2011.05.025. [DOI] [PubMed] [Google Scholar]
- Kaiser M, Hilgetag CC. Edge vulnerability in neural and metabolic networks. Biol Cybern. 2004;90:311–317. doi: 10.1007/s00422-004-0479-1. [DOI] [PubMed] [Google Scholar]
- Kobbert C, Apps R, Bechmann I, Lanciego JL, Mey J, Thanos S. Current concepts in neuroanatomical tracing. Prog Neurobiol. 2000;62:327–351. doi: 10.1016/s0301-0082(00)00019-8. [DOI] [PubMed] [Google Scholar]
- Kotter R, Wanke E. Mapping brains without coordinates. Philos Trans R Soc Lond B Biol Sci. 2005;360:751–766. doi: 10.1098/rstb.2005.1625. [DOI] [PMC free article] [PubMed] [Google Scholar]
- Lewis JW, Van Essen DC. Corticocortical connections of visual, sensorimotor, and multimodal processing areas in the parietal lobe of the macaque monkey. J Comp Neurol. 2000;428:112–137. doi: 10.1002/1096-9861(20001204)428:1<112::aid-cne8>3.0.co;2-9. [DOI] [PubMed] [Google Scholar]
- Li L, Rilling JK, Preuss TM, Glasser MF, Damen FW, Hu X. Quantitative assessment of a framework for creating anatomical brain networks via global tractography. Neuroimage. 2012a;61:1017–1030. doi: 10.1016/j.neuroimage.2012.03.071. [DOI] [PMC free article] [PubMed] [Google Scholar]
- Li L, Rilling JK, Preuss TM, Glasser MF, Hu X. The effects of connection reconstruction method on the interregional connectivity of brain networks via diffusion tractography. Hum Brain Mapp. 2011 doi: 10.1002/hbm.21332. [DOI] [PMC free article] [PubMed] [Google Scholar]
- Li L, Rilling JK, Preuss TM, Glasser MF, Hu X. The effects of connection reconstruction method on the interregional connectivity of brain networks via diffusion tractography. Hum Brain Mapp. 2012b;33:1894–1913. doi: 10.1002/hbm.21332. [DOI] [PMC free article] [PubMed] [Google Scholar]
- Li Y, Liu Y, Li J, Qin W, Li K, Yu C, Jiang T. Brain anatomical network and intelligence. PLoS Comput Biol. 2009;5:e1000395. doi: 10.1371/journal.pcbi.1000395. [DOI] [PMC free article] [PubMed] [Google Scholar]
- Lohmann G, Margulies DS, Horstmann A, Pleger B, Lepsien J, Goldhahn D, Schloegl H, Stumvoll M, Villringer A, Turner R. Eigenvector centrality mapping for analyzing connectivity patterns in fMRI data of the human brain. PLoS One. 2010;5:e10232. doi: 10.1371/journal.pone.0010232. [DOI] [PMC free article] [PubMed] [Google Scholar]
- Mantini D, Corbetta M, Romani GL, Orban GA, Vanduffel W. Data-driven analysis of analogous brain networks in monkeys and humans during natural vision. Neuroimage. 2012a;63:1107–1118. doi: 10.1016/j.neuroimage.2012.08.042. [DOI] [PMC free article] [PubMed] [Google Scholar]
- Mantini D, Hasson U, Betti V, Perrucci MG, Romani GL, Corbetta M, Orban GA, Vanduffel W. Interspecies activity correlations reveal functional correspondence between monkey and human brain areas. Nat Methods. 2012b;9:277–282. doi: 10.1038/nmeth.1868. [DOI] [PMC free article] [PubMed] [Google Scholar]
- Margulies DS, Vincent JL, Kelly C, Lohmann G, Uddin LQ, Biswal BB, Villringer A, Castellanos FX, Milham MP, Petrides M. Precuneus shares intrinsic functional architecture in humans and monkeys. Proc Natl Acad Sci U S A. 2009;106:20069–20074. doi: 10.1073/pnas.0905314106. [DOI] [PMC free article] [PubMed] [Google Scholar]
- Markov NT, Ercsey-Ravasz MM, Ribeiro Gomes AR, Lamy C, Magrou L, Vezoli J, Misery P, Falchier A, Quilodran R, Gariel MA, Sallet J, Gamanut R, Huissoud C, Clavagnier S, Giroud P, Sappey-Marinier D, Barone P, Dehay C, Toroczkai Z, Knoblauch K, Van Essen DC, Kennedy H. A Weighted and Directed Interareal Connectivity Matrix for Macaque Cerebral Cortex. Cereb Cortex: 2012. [DOI] [PMC free article] [PubMed] [Google Scholar]
- Markov NT, Misery P, Falchier A, Lamy C, Vezoli J, Quilodran R, Gariel MA, Giroud P, Ercsey-Ravasz M, Pilaz LJ, Huissoud C, Barone P, Dehay C, Toroczkai Z, Van Essen DC, Kennedy H, Knoblauch K. Weight consistency specifies regularities of macaque cortical networks. Cereb Cortex. 2011;21:1254–1272. doi: 10.1093/cercor/bhq201. [DOI] [PMC free article] [PubMed] [Google Scholar]
- Menon V, Uddin LQ. Saliency, switching, attention and control: a network model of insula function. Brain Struct Funct. 2010;214:655–667. doi: 10.1007/s00429-010-0262-0. [DOI] [PMC free article] [PubMed] [Google Scholar]
- Modha DS, Singh R. Network architecture of the long-distance pathways in the macaque brain. Proc Natl Acad Sci U S A. 2010;107:13485–13490. doi: 10.1073/pnas.1008054107. [DOI] [PMC free article] [PubMed] [Google Scholar]
- Mori S, Kaufmann WE, Davatzikos C, Stieltjes B, Amodei L, Fredericksen K, Pearlson GD, Melhem ER, Solaiyappan M, Raymond GV, Moser HW, van Zijl PC. Imaging cortical association tracts in the human brain using diffusion-tensor-based axonal tracking. Magn Reson Med. 2002;47:215–223. doi: 10.1002/mrm.10074. [DOI] [PubMed] [Google Scholar]
- Ongur D, Ferry AT, Price JL. Architectonic subdivision of the human orbital and medial prefrontal cortex. J Comp Neurol. 2003;460:425–449. doi: 10.1002/cne.10609. [DOI] [PubMed] [Google Scholar]
- Ongur D, Price JL. The organization of networks within the orbital and medial prefrontal cortex of rats, monkeys and humans. Cereb Cortex. 2000;10:206–219. doi: 10.1093/cercor/10.3.206. [DOI] [PubMed] [Google Scholar]
- Passingham R. How good is the macaque monkey model of the human brain? Curr Opin Neurobiol. 2009;19:6–11. doi: 10.1016/j.conb.2009.01.002. [DOI] [PMC free article] [PubMed] [Google Scholar]
- Paxinos G, Huang XF, Toga AW. The rhesus monkey brain in stereotaxic coordinates. San Diego; London: Academic; 2000. [Google Scholar]
- Preuss TM. The human brain: rewired and running hot. Ann N Y Acad Sci. 2011;1225(Suppl 1):E182–E191. doi: 10.1111/j.1749-6632.2011.06001.x. [DOI] [PMC free article] [PubMed] [Google Scholar]
- Raichle ME, MacLeod AM, Snyder AZ, Powers WJ, Gusnard DA, Shulman GL. A default mode of brain function. Proc Natl Acad Sci U S A. 2001;98:676–682. doi: 10.1073/pnas.98.2.676. [DOI] [PMC free article] [PubMed] [Google Scholar]
- Restrepo JG, Ott E, Hunt BR. Characterizing the dynamical importance of network nodes and links. Physical Review Letters. 2006:97. doi: 10.1103/PhysRevLett.97.094102. [DOI] [PubMed] [Google Scholar]
- Rilling JK, Barks SK, Parr LA, Preuss TM, Faber TL, Pagnoni G, Bremner JD, Votaw JR. A comparison of resting-state brain activity in humans and chimpanzees. Proc Natl Acad Sci U S A. 2007;104:17146–17151. doi: 10.1073/pnas.0705132104. [DOI] [PMC free article] [PubMed] [Google Scholar]
- Rilling JK, Glasser MF, Preuss TM, Ma X, Zhao T, Hu X, Behrens TE. The evolution of the arcuate fasciculus revealed with comparative DTI. Nat Neurosci. 2008;11:426–428. doi: 10.1038/nn2072. [DOI] [PubMed] [Google Scholar]
- Rilling JK, Insel TR. The primate neocortex in comparative perspective using magnetic resonance imaging. J Hum Evol. 1999;37:191–223. doi: 10.1006/jhev.1999.0313. [DOI] [PubMed] [Google Scholar]
- Rombouts SA, Barkhof F, Hoogenraad FG, Sprenger M, Scheltens P. Within-subject reproducibility of visual activation patterns with functional magnetic resonance imaging using multislice echo planar imaging. Magn Reson Imaging. 1998;16:105–113. doi: 10.1016/s0730-725x(97)00253-1. [DOI] [PubMed] [Google Scholar]
- Rubinov M, Sporns O. Complex network measures of brain connectivity: uses and interpretations. Neuroimage. 2010;52:1059–1069. doi: 10.1016/j.neuroimage.2009.10.003. [DOI] [PubMed] [Google Scholar]
- Schenker NM, Hopkins WD, Spocter MA, Garrison AR, Stimpson CD, Erwin JM, Hof PR, Sherwood CC. Broca's area homologue in chimpanzees (Pan troglodytes): probabilistic mapping, asymmetry, and comparison to humans. Cereb Cortex. 2010;20:730–742. doi: 10.1093/cercor/bhp138. [DOI] [PMC free article] [PubMed] [Google Scholar]
- Schoenemann PT, Sheehan MJ, Glotzer LD. Prefrontal white matter volume is disproportionately larger in humans than in other primates. Nat Neurosci. 2005;8:242–252. doi: 10.1038/nn1394. [DOI] [PubMed] [Google Scholar]
- Seeley WW, Menon V, Schatzberg AF, Keller J, Glover GH, Kenna H, Reiss AL, Greicius MD. Dissociable intrinsic connectivity networks for salience processing and executive control. J Neurosci. 2007;27:2349–2356. doi: 10.1523/JNEUROSCI.5587-06.2007. [DOI] [PMC free article] [PubMed] [Google Scholar]
- Semendeferi K, Armstrong E, Schleicher A, Zilles K, Van Hoesen GW. Prefrontal cortex in humans and apes: a comparative study of area 10. Am J Phys Anthropol. 2001;114:224–241. doi: 10.1002/1096-8644(200103)114:3<224::AID-AJPA1022>3.0.CO;2-I. [DOI] [PubMed] [Google Scholar]
- Shu N, Liu Y, Li J, Li Y, Yu C, Jiang T. Altered anatomical network in early blindness revealed by diffusion tensor tractography. PLoS One. 2009;4:e7228. doi: 10.1371/journal.pone.0007228. [DOI] [PMC free article] [PubMed] [Google Scholar]
- Smith MS, Brady JM. SUSAN - A new approach to low level image processing. International Journal of Computer Vision. 1997;23:45–78. [Google Scholar]
- Smith SM. Fast robust automated brain extraction. Hum Brain Mapp. 2002;17:143–155. doi: 10.1002/hbm.10062. [DOI] [PMC free article] [PubMed] [Google Scholar]
- Spocter MA, Hopkins WD, Garrison AR, Bauernfeind AL, Stimpson CD, Hof PR, Sherwood CC. Wernicke's area homologue in chimpanzees (Pan troglodytes) and its relation to the appearance of modern human language. Proc Biol Sci. 2010;277:2165–2174. doi: 10.1098/rspb.2010.0011. [DOI] [PMC free article] [PubMed] [Google Scholar]
- Sporns O, Honey CJ, Kotter R. Identification and classification of hubs in brain networks. PLoS One. 2007;2:e1049. doi: 10.1371/journal.pone.0001049. [DOI] [PMC free article] [PubMed] [Google Scholar]
- Sporns O, Tononi G, Kotter R. The human connectome: A structural description of the human brain. PLoS Comput Biol. 2005;1:e42. doi: 10.1371/journal.pcbi.0010042. [DOI] [PMC free article] [PubMed] [Google Scholar]
- Stephan KE, Kamper L, Bozkurt A, Burns GA, Young MP, Kotter R. Advanced database methodology for the Collation of Connectivity data on the Macaque brain (CoCoMac) Philos Trans R Soc Lond B Biol Sci. 2001;356:1159–1186. doi: 10.1098/rstb.2001.0908. [DOI] [PMC free article] [PubMed] [Google Scholar]
- Stiles J, Kritchevsky M, Bellugi U. Spatial cognition : brain bases and development. Hillsdale, N.J.; London: Erlbaum; 1988. [Google Scholar]
- Tomasello M, Call J. Primate Cognition. Oxford: Oxford University Press; 1997. [Google Scholar]
- Tymofiyeva O, Hess CP, Ziv E, Tian N, Bonifacio SL, McQuillen PS, Ferriero DM, Barkovich AJ, Xu D. Towards the "baby connectome": mapping the structural connectivity of the newborn brain. PLoS One. 2012;7:e31029. doi: 10.1371/journal.pone.0031029. [DOI] [PMC free article] [PubMed] [Google Scholar]
- van den Heuvel MP, Mandl RC, Stam CJ, Kahn RS, Hulshoff Pol HE. Aberrant frontal and temporal complex network structure in schizophrenia: a graph theoretical analysis. J Neurosci. 2010;30:15915–15926. doi: 10.1523/JNEUROSCI.2874-10.2010. [DOI] [PMC free article] [PubMed] [Google Scholar]
- van den Heuvel MP, Stam CJ, Boersma M, Hulshoff Pol HE. Small-world and scale-free organization of voxel-based resting-state functional connectivity in the human brain. Neuroimage. 2008;43:528–539. doi: 10.1016/j.neuroimage.2008.08.010. [DOI] [PubMed] [Google Scholar]
- Van Essen DC, Dierker DL. Surface-based and probabilistic atlases of primate cerebral cortex. Neuron. 2007;56:209–225. doi: 10.1016/j.neuron.2007.10.015. [DOI] [PubMed] [Google Scholar]
- Van Essen DC, Drury HA, Dickson J, Harwell J, Hanlon D, Anderson CH. An integrated software suite for surface-based analyses of cerebral cortex. J Am Med Inform Assoc. 2001;8:443–459. doi: 10.1136/jamia.2001.0080443. [DOI] [PMC free article] [PubMed] [Google Scholar]
- Van Essen DC, Glasser MF, Dierker DL, Harwell J. Cortical parcellations of the macaque monkey analyzed on surface-based atlases. Cereb Cortex. 2012a;22:2227–2240. doi: 10.1093/cercor/bhr290. [DOI] [PMC free article] [PubMed] [Google Scholar]
- Van Essen DC, Glasser MF, Dierker DL, Harwell J, Coalson T. Parcellations and hemispheric asymmetries of human cerebral cortex analyzed on surface-based atlases. Cereb Cortex. 2012b;22:2241–2262. doi: 10.1093/cercor/bhr291. [DOI] [PMC free article] [PubMed] [Google Scholar]
- van Wijk BC, Stam CJ, Daffertshofer A. Comparing brain networks of different size and connectivity density using graph theory. PLoS One. 2010;5:e13701. doi: 10.1371/journal.pone.0013701. [DOI] [PMC free article] [PubMed] [Google Scholar]
- Vogt BA, Laureys S. Posterior cingulate, precuneal and retrosplenial cortices: cytology and components of the neural network correlates of consciousness. Prog Brain Res. 2005;150:205–217. doi: 10.1016/S0079-6123(05)50015-3. [DOI] [PMC free article] [PubMed] [Google Scholar]
- Wang J, Wang L, Zang Y, Yang H, Tang H, Gong Q, Chen Z, Zhu C, He Y. Parcellation-dependent small-world brain functional networks: a resting-state fMRI study. Hum Brain Mapp. 2009;30:1511–1523. doi: 10.1002/hbm.20623. [DOI] [PMC free article] [PubMed] [Google Scholar]
- Wig GS, Schlaggar BL, Petersen SE. Concepts and principles in the analysis of brain networks. Ann N Y Acad Sci. 2011;1224:126–146. doi: 10.1111/j.1749-6632.2010.05947.x. [DOI] [PubMed] [Google Scholar]
- Young MP. The organization of neural systems in the primate cerebral cortex. Proc Biol Sci. 1993;252:13–18. doi: 10.1098/rspb.1993.0040. [DOI] [PubMed] [Google Scholar]
- Zalesky A, Fornito A, Harding IH, Cocchi L, Yucel M, Pantelis C, Bullmore ET. Whole-brain anatomical networks: does the choice of nodes matter? Neuroimage. 2010;50:970–983. doi: 10.1016/j.neuroimage.2009.12.027. [DOI] [PubMed] [Google Scholar]
- Zhang Y, Brady M, Smith S. Segmentation of brain MR images through a hidden Markov random field model and the expectation-maximization algorithm. IEEE Trans Med Imaging. 2001;20:45–57. doi: 10.1109/42.906424. [DOI] [PubMed] [Google Scholar]
Associated Data
This section collects any data citations, data availability statements, or supplementary materials included in this article.