

Abstract
Salt stress is one of the major abiotic stresses in agriculture worldwide. Analysis of natural genetic variation in Arabidopsis is an effective approach to characterize candidate salt responsive genes. Differences in salt tolerance of three Arabidopsis ecotypes were compared in this study based on their responses to salt treatments at two developmental stages: seed germination and later growth. The Sha ecotype had higher germination rates, longer roots and less accumulation of superoxide radical and hydrogen peroxide than the Ler and Col ecotypes after short term salt treatment. With long term salt treatment, Sha exhibited higher survival rates and lower electrolyte leakage. Transcriptome analysis revealed that many genes involved in cell wall, photosynthesis, and redox were mainly down-regulated by salinity effects, while transposable element genes, microRNA and biotic stress related genes were significantly changed in comparisons of Sha vs. Ler and Sha vs. Col. Several pathways involved in tricarboxylic acid cycle, hormone metabolism and development, and the Gene Ontology terms involved in response to stress and defense response were enriched after salt treatment, and between Sha and other two ecotypes. Collectively, these results suggest that the Sha ecotype is preconditioned to withstand abiotic stress. Further studies about detailed gene function are needed. These comparative transcriptomic and analytical results also provide insight into the complexity of salt stress tolerance mechanisms.
Introduction
Salinity is an increasingly important agricultural problem. Salt stress involves a combination of dehydration or osmotic-related stress effects and damage due to excess sodium ions [1] that greatly affect plant growth and crop production. Salt stress treatment also regulated the expression level of many genes involved either directly or indirectly in plant protection [2], [3]. Plant adaptations to salt stress include avoidance by reduced sodium uptake, sequestration of toxic sodium ions away from the cytoplasm, or production of compatible solutes or osmoprotectants to reduce molecular disruption [4], [5]. Much effort has been directed toward understanding the molecular mechanisms of plant salt tolerance, with the ultimate goal of improving salt tolerance of crop plants. Engineered salt stress resistance has been achieved by over-expression of genes encoding compatible solutes [6], ion transporters [7], and transcription factors [8] and is a high priority for commercial and public improvement efforts.
Besides genomics and mutant approaches, research based on the analysis of natural genetic variation in Arabidopsis and other species is receiving increased attention [9], [10]. Recently, large-scale evaluation of salt tolerance among different Arabidopsis ecotypes was performed by several groups [11], [12], [13]. Several loci associated with the salt sensitivity response were also mapped [14], [15]. Elemental profiling of shoot tissue from Arabidopsis ecotypes also revealed different Na+ and K+ accumulation because of natural variants of AtHKT1 gene [16], [17], indicating possible natural variation of salinity tolerance in Arabidopsis [18]. Global transcriptome analyses have revealed numerous differences in transcript abundance among Arabidopsis ecotypes in response to several abiotic and biotic stresses [19], [20], [21]. Indeed, thousands of genes are differentially expressed between pairs of different Arabidopsis ecotypes under stress conditions [22], [23]. These differentially expressed genes were enriched for those involved in biotic and abiotic responses, suggesting that natural variation for gene expression is frequently observed among different Arabidopsis ecotypes. However, different ecotypes can differ for a large number of genes that are differentially regulated upon the same treatment [24], [25].
The Shahdara ecotype (Sha; also referred to as Shakdara) has been considered to be more tolerant to drought stress [26], osmotic stress [27], [28] as well as salt stress and ABA treatment [14], [15], [29]. These results are consistent with its origin in a region of overall low precipitation (the Shakdara valley of Tadjikistan; [30]). Quantitative genetics studies using different Arabidopsis ecotypes revealed a large variation for root development and seed germination under salt stress conditions. Twenty two quantitative trait loci (QTL) for these traits have been detected by phenotyping two recombinant inbred line populations, Sha × Col and Sha × Ler [14]. Another study indicated that a premature stop codon resulting in a truncated Response to ABA and Salt 1 (RAS1) protein in Sha contributes to the increased salt tolerance [15] based on QTL mapping.
To date, transcriptomic and physiological level changes between Sha and other ecotypes under salt stress conditions remain to be elucidated. To narrow down the list of candidate genes differentially expressed among Arabidopsis ecotypes under stress conditions, one salt tolerant (Sha) and two relative salt susceptible ecotypes (Landsberg erecta (Ler) and Columbia-0 (Col)) were used in this study to characterize transcriptome changes after salt treatment. The aims of this study are: (1) to detect physiological changes of three ecotypes under salt stress conditions; (2) to characterize transcriptional variation among these three ecotypes in the presence and absence of salt; and (3) to interpret related pathways which are involved in salt tolerance of the Sha ecotype.
Materials and Methods
Plant materials and growth conditions
Three Arabidopsis thaliana ecotypes Shakdara (Sha), Landsberg erecta (Ler) and Columbia-0 (Col) were used in this study. Arabidopsis seeds were surface sterilized and sown on Murashige and Skoog (MS) agar plates containing full-strength MS salts, 0.8% (w/v) agar, and 3% (w/v) sucrose. The seeds were stratified at 4°C for 4 days in darkness and then transferred to a growth chamber with 16 h/8 h light (350 μmol m−2s−1)/dark cycle at 23°C, or the seeds were directly sown in soil after stratification under the same conditions.
Salt tolerance test
The standard for measuring germination rates was percent of seeds with emerged radicles (>1 mm) and/or two cotyledons turning green, as described by Wang et al. [31]. The root elongation data was quantified as described by Verslues et al. [32]. Salt treatment in soil-grown plants was initiated at 14 Days After Sowing (DAS) as described by Chan et al. [2]. Each ecotype-treatment combination included five replicate pots with nine plants per replicate pot. The NaCl concentrations were increased stepwise to the final concentrations (0, 100, 150, or 200 mM) by 50 mM every 2 days. Nine plants were grown in each pot and four replicated pots were used for each ecotype and salt treatment combination in above mentioned growth chamber. All the above experiments were repeated at least three times.
Measurement of electrolyte leakage
Electrolyte leakage was determined from the detached aerial parts of salt-stressed plants with the indicated NaCl concentrations at the 10th day after salt-treatment initiation. The detached plants (n = 10) were individually placed in 50 ml tubes containing 15 ml ddH2O and gently shaken for 2 h. Plants in tubes were then boiled at 100°C for 40 min. When plants were cooled to room temperature, the percentage of electrolyte leakage was determined as the percentage of the conductivity before and after boiling of the detached plants.
Determination of reactive oxygen species (ROS) levels and enzyme activities
Superoxide radical and hydrogen peroxide (H2O2) were detected as described previously by NBT (Sigma-Aldrich) and DAB staining (Sigma-Aldrich), respectively [33]. Quantification of H2O2 content was determined using the method described by Hu et al. [34]. Two-week-old plants grown in soil were treated with 0, 100, 150 or 200 mM NaCl as described above. After 10 days, whole plants (0.2 g, FW) were ground in liquid nitrogen to extract total proteins and suspended in 500 µl PBS buffer (50 mM, pH 7.5), and then centrifuged at 12000 rpm at 4°C for 15 min. The supernatant was recovered and immediately used for enzyme activity measurement. Superoxide dismutase (SOD) activity was determined using the WST (2-(4-iodophenyl)-3-(4-nitrophenyl)-5-(2,4-disulfophenyl)-2H-tetrazolium, monosodium salt assay) method as described by Ukeda et al. [35]. One unit SOD was defined as the amount of enzyme required to inhibit reduction rate of WST-1 by 50%. The activity of catalase (CAT) was analyzed as described by Aebi [36]. One unit of CAT activity was defined as the amount of enzyme necessary to catalize 1 µmol H2O2 in 1 min at 25°C (pH 7.0). The absorbance of reaction buffer was analyzed at 520 nm. Experiments were repeated two times.
Plant growth and salt treatment for microarray experiment
Seeds of three ecotypes were sown in MS plates as described above with three replicates for each ecotype and salt combination. Ten days after sowing, uniform seedlings of all ecotypes were carefully transferred to MS plates with or without 100 mM NaCl. Seedlings in MS plates without salt were used as controls. Plant materials were collected for RNA extraction 4 days after transferring at 2 h after dawn (the onset of illumination).
RNA extraction and array hybridization
Total RNA was extracted and purified from leaves of at least 30 seedlings per plate for each ecotype and salt combination using QIAGEN-RNeasy Mini Kit (Qiagen, Valencia, CA, USA) according to guidelines specified by the manufacturer. Two biological replicates were prepared for each combination. Microarray analysis was performed using Agilent-021169 Arabidopsis 4 Oligo Microarray (V4) (Probe Name version). In total 150 ng of total RNA was used to prepare Cyanine-3 (Cy3) labeled probe with the help of the low RNA input linear amplification/labeling kit (Agilent technologies). Labeled cRNA probes (1.65 µg) were fragmented using fragmentation buffer (Agilent Technologies) and hybridized to the Arabidopsis arrays according to manufacturer’s instructions.
Microarray data analysis
The arrays were scanned using the high resolution array scanner (Agilent technologies). Array images were acquired with Agilent's dual-laser microarray scanner and signal intensities were extracted from the scanned images with dedicated Agilent Feature Extraction software (Agilent technologies). GeneSpring software (Agilent technologies) was used to calculate the intensity ratios and fold changes. All the genes with a P-value below 0.01 and a fold change above 2 were chosen for further analysis. The normalized microarray data have been submitted to the Gene Expression Omnibus (GEO) database with accession number (GSE40940). Genes significantly changed by at least one comparison (p-value ≤0.05 and fold change >2.0) are listed in Table S1.
Biological enrichment and metabolic pathway analysis
All genes with P-value <0.01 and fold change >2.0 were loaded and annotated in the Classification SuperViewer Tool (http://bar.utoronto.ca/ntools/cgi-bin/ntools_classification_superviewer.cgi) [37]. MapMan was used as the classification source to assign functional categories for each gene [38]. For GO term enrichment analysis, all genes with P-value <0.01 and fold change >2.0 were loaded in “Term enrichment” using AmiGO software (http://amigo.geneontology.org) [39]. Normalized frequency (NF) of each functional category was calculated as following: NF = sample frequency of each category in this experiment/background frequency of each category in the Arabidopsis genome.
Cluster analysis
The data sets of specific genes were imported into the CLUSTER program [40], http://bonsai.ims.u-tokyo.ac.jp/~mdehoon/software/cluster/). Hierarchical cluster analysis was performed using an uncentered matrix and complete linkage method. Resulting tree figures were displayed using the software package, Java Treeview (http://jtreeview.sourceforge.net/).
Results
Effects of salt stress on seed germination of three ecotypes
On the fifth Day After Germination (DAG), the Sha ecotype exhibited less injury than Col and Ler in the presence of 150 mM NaCl (Figure 1A). More than half of the Sha seeds (51.3%) developed a radicle even in the presence of 200 mM NaCl at 3 DAG and 86% of the seeds developed green cotyledons at 5 DAG in the presence of 150 mM NaCl, while less than 13% and 3% of other two ecotypes (Col and Ler) seeds developed radicle and green cotyledons, respectively (Figure 1B and C). In the presence of 100 mM NaCl, 93% and 97% of Sha seeds developed radicles at 2 DAG and green cotyledons at 5 DAG, respectively. In comparison, only 36% and 20% of Ler seeds showed radicles and green cotyledons at this stage. Col ecotype showed moderate susceptibility to salt stress and the germination parameters were in between Sha and Ler (Figure 1D and E). Sha ecotype also had relatively longer primary roots and significantly more lateral roots than those of Ler and Col (Figure S1).
Figure 1. Comparison of seed germination rates among Col, Ler and Sha under salt stress treatment.

(A) Plants were grown on MS plate supplied with the indicated concentrations of NaCl (mM). Photos were taken after 5 DAG (Days-After-Germination). Bar = 1 cm. (B) & (C) Germination rates were compared with various concentrations of NaCl. Germination rates were analyzed by counting the number of emergenced radicles after 3 DAG on the indicated concentrations of NaCl in (B) or by counting the number of green cotyledons after 5 DAG in (C). The values indicated means + SEs of four independent experimental repeats (n = 30). (D) & (E) The kinetics of germination time among Col, Ler and Sha were analyzed with the same concentration of NaCl (100 mM). Germination rates were determined by counting the number of emergenced radicles (D) and green cotyledons (E) at the indicated time points. The values indicated means + SEs of four independent experimental repeats (n = 30).
Effects of salt stress on plant growth of three ecotypes
The survival rate of the Sha ecotype at various concentrations of NaCl was significantly greater relative to the Ler and Col ecotypes (Figure 2A). In the presence of 100 mM NaCl, growth of Sha was less inhibited and 93% of the plants were alive at 14 days after treatment in soil. After 200 mM NaCl treatment, 40% of the Sha plants kept growing while all of the Ler plants died (Figure 2B), resulting in significantly higher dry weight for the Sha ecotype (Figure 2C). The electrolyte leakage test showed that Ler exhibited significantly higher electrolyte leakage than Sha after 10 days salt treatment, indicating Ler sustained less cell membrane stability when compared to Sha (Figure 2D). Col ecotype showed moderate susceptibility to long term salt treatment (Figure 2A–D). Taken together, the enhanced salt tolerance of Sha can be attributed at least in part to increased cell membrane integrity and stability.
Figure 2. Adult phenotypes analysis among Col, Ler and Sha after salt stress treatment.

Salt treatments were initiated at 14 DAS (Day-After-Sowing). (A) 2-week-old seedlings of Col, Ler and Sha were treated with indicated concentrations of NaCl for 14 days. Plants were photographed after 2 weeks treatments. (B) Survival rates were calculated from the results of above three independent experiments (n = 20). The values indicated means + SEs. * indicated significant difference with P<0.05 (t-test) in relative to Ler. (C) Relative dry weight comparison after salt treatment. The values indicated means + SEs of four independent experimental repeats (n = 30). * indicated significant difference with P<0.05 (t-test) in relative to Ler. (D) Plants were grown for 2 weeks under normal condition and exposed to different concentrations of NaCl treatments. At 10 days after treatment, aerial plants were harvested for measurement of relative electrolyte leakage. The values indicated means + SEs of four independent experimental repeats (n = 15). * indicated significant difference with P<0.05 (t-test) in relative to Ler.
Redox response after salt treatment
After 200 mM NaCl treatment, both superoxide radical and hydrogen peroxide accumulated to a relatively higher content in Ler than in Sha (Figure 3A). A quantification assay indicated that hydrogen peroxide levels in Ler were about 2 folds higher than those in Sha under the various salt conditions (Figure 3B). The SOD and CAT activities in Sha were significantly greater than in Ler after 10 days after salt treatments (Figure 3C and D). ROS content and antioxidant enzyme activities in Col ecotype were in between those of Sha and Ler ecotypes.
Figure 3. Quantitative comparison of superoxide contents and antioxidant enzyme activities (SOD and CAT) among Col, Ler and Sha after salt stress treatment.

Two-week-old plants were started to be treated with the indicated concentrations of NaCl for 10 days before measurement in (B), (C) & (D). The values indicated means + SEs of two independent experimental repeats in (B), (C) & (D) (n = 15). * indicated significant difference with P<0.05 (t-test) in relative to Ler. (A) Visualization of superoxide radical and hydrogen peroxide detected by NBT and DAB staining. Detections have been done on 2-week-old MS-grown plants subjected to subsequent treatment with 200 mM NaCl for the indicated time. Bar = 1 cm. (B) Changes in H2O2 content were analyzed with different salt treatment. (C) Changes in SOD activity were analyzed with different salt treatment. (D) Changes in CAT activity were analyzed with different salt treatment.
General transcriptomic responses by salinity effect and ecotype effect
In total, the expression levels of 7209 genes were significantly changed by either salt stress (referred to salt effect) or between Sha and other two ecotypes (referred to Sha ecotype effect) (Table S1). In the absence of salt, 4353 and 4867 genes showed differential expression levels in the comparisons of Sha vs. Ler and Sha vs. Col, respectively, while in the presence of salt, the differences between Sha vs. Ler and Col were 3536 and 4639, respectively (Figure 4).
Figure 4. Numbers of gene changed by Sha ecotype effect and salt effect.

As reported by many groups, dehydration responsive element binding (DREB)/C-repeat binding factors (CBF), LOW-TEMPERATURE-INDUCED (LTI) genes, DROUGHT-INDUCED (DI) genes, COLD-REGULATED (COR) genes, EARLY RESPONSIVE TO DEHYDRATION (ERD) genes, LATE EMBRYOGEENESIS ABUNDANT (LEA) genes and KIN1 gene were highly induced by abiotic stress treatments [8], [41], [42]. In this study, expression levels of 20 DREB/CBF, LTI, DI, COR, ERD, KIN genes were significantly up-regulated after salt treatment (Figure S2). Moreover, ABA receptor genes (PYR/PYLs) were generally down-regulated after salt stress treatment, while other genes involved in ABA pathways, including PROTEIN PHOSPHATASE 2C (PP2C), ABA RESPONSIVE ELEMENT-BINDING FACTOR (ABF), ABA metabolism and ABA catabolism, were mainly up-regulated in the presence of salt (Figure S3). These data agreed fairly well with those of [41] that abiotic stress changed ABA pathway related genes. These results provide support for the validity of the data obtained by microarray analysis.
Cluster and overlap analyses revealed common and contrasting changes by salinity and among ecotypes
In total, 1368 and 1905 genes were commonly regulated by Sha vs. Ler and Sha vs. Col in the absence and presence of salt, respectively (Figure 5A and B). Cluster analysis revealed that 52–65% of salt stress affected genes was in common in three ecotypes (Figure S4). Among them, 2549 and 2793 differentially expressed genes were co-regulated by salt in all three ecotypes (Figure 5C and D), indicating common changes after salt stress treatment.
Figure 5. Numbers of overlapping transcripts changed between ecotypes and after salt treatment.

Differentially expressed transcripts were those with P<0.05 and fold change >2. Genes commonly regulated between ecotypes or by salt treatment were highlighted in dotted rectangles and the detailed information of these genes was listed as in Table S1.
Many genes associated with cell walls, photosynthesis (PS), auxin (Figure 6A), secondary metabolism, and biotic stress (Figure S5) were significantly down-regulated after salt treatment, but there were no significant changes between Sha and the other two ecotypes (Figure 6A). In addition, salt treatment also extensively up-regulated genes involved in ABA pathway, carbohydrate metabolism (CHO), ethylene and transport for all three ecotypes (Figure S5). In contrast, expression levels of transposable element genes (TE), microRNA and antisense sequence were significantly changed between Sha and other two ecotypes, and only slightly by salinity (Figure 6B; Table S1). F-box genes, heat shock transcription factors and MADS box transcription factors were also extensively changed between Sha and other two ecotypes (Figure 6B).
Figure 6. Cluster analyses of transcripts involved in specific pathway.

Red, increase in transcript abundance (up-regulation); green, decrease in transcript abundance (down-regulation); yellow, no change. The color scales were also indicated. Hierarchical cluster analysis was applied for differentially expressed transcripts (P < 0.05 and log 2 fold change > 1 or < −1) with Cluster 3.0 software. The resulting tree figures were displayed using the software package, Java TreeView.
Pathway enrichment analyses of genes changed by Sha ecotype effect and salt effect
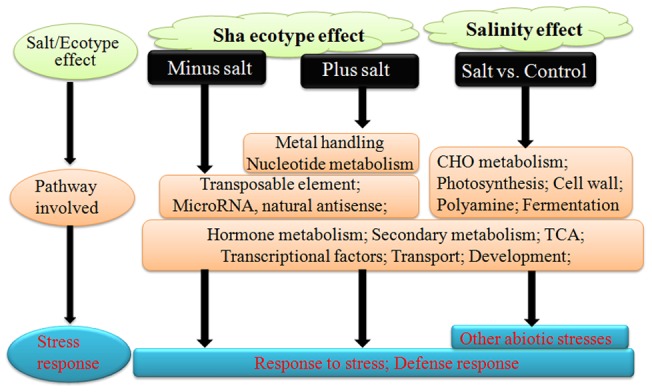
Several metabolic pathways such as hormone metabolism, secondary metabolism, TCA, development, and stress (Table 1, Group 1), and GO terms involved in defense and stress responses (Table 2, Group 1) were enriched by both salt effect and Sha ecotype effect, indicating the preconditioned stress tolerance in Sha ecotype. Salt stress treatment extensively changed expression levels of many other genes, resulting in enrichment of related pathways (fermentation, glyoxylate cycle, polyamine metabolism, metal handling, etc) (Table 1, Group 4) and GO terms (regulation of transport and response to most other abiotic stresses) (Table 2, Group 2-3). Pathways involving in microRNA and natural antisense (Table 1, Group 3) were over-represented between the comparison of Sha and other two ecotypes.
Table 1. Pathway enrichment analysis showed several pathways were enriched by salinity and ecotype effects.
| Groups | MapMan Pathways | Sha vs. Ler/Col | Sha vs. Ler/Col | ||||
| Salt vs. Control | – NaCl | + NaCl | |||||
| NF1 | P-value | NF1 | P-value | NF1 | P-value | ||
| 1 | hormone metabolism | 2.51 | 0.0000 | 1.29 | 0.0320 | 1.50 | 0.0020 |
| secondary metabolism | 2.11 | 0.0000 | 1.74 | 0.0012 | 2.16 | 0.0000 | |
| Misc | 1.87 | 0.0000 | 1.91 | 0.0000 | 1.64 | 0.0000 | |
| transport | 1.72 | 0.0000 | 1.10 | 0.0480 | 1.14 | 0.0270 | |
| development | 1.57 | 0.0000 | 1.39 | 0.0063 | 1.30 | 0.0082 | |
| TCA/org. transformation | 1.40 | 0.0380 | 3.21 | 0.0008 | 3.04 | 0.0002 | |
| Stress | 1.36 | 0.0000 | 2.22 | 0.0000 | 2.28 | 0.0000 | |
| 2 | metal handling | 2.00 | 0.0001 | – | – | 2.52 | 0.0018 |
| nucleotide metabolism | 0.73 | 0.0270 | – | – | 1.66 | 0.0160 | |
| 3 | not assigned | 0.87 | 0.0000 | 1.04 | 0.0098 | 1.01 | 0.0190 |
| micro RNA, natural antisense etc | 0.56 | 0.0000 | 1.70 | 0.0023 | 1.24 | 0.0410 | |
| signalling | 1.32 | 0.0000 | 1.12 | 0.0340 | 0.97 | 0.0480 | |
| RNA | 1.05 | 0.0072 | 0.78 | 0.0015 | 0.85 | 0.0048 | |
| 4 | fermentation | 4.71 | 0.0000 | – | – | – | – |
| gluconeogenese/glyoxylate cycle | 4.05 | 0.0002 | – | – | – | – | |
| polyamine metabolism | 3.70 | 0.0002 | – | – | – | – | |
| Biodegradation of Xenobiotics | 2.82 | 0.0003 | – | – | – | – | |
| C1-metabolism | 1.97 | 0.0082 | – | – | – | – | |
| amino acid metabolism | 1.81 | 0.0000 | – | – | – | – | |
| minor CHO metabolism | 1.70 | 0.0007 | – | – | – | – | |
| tetrapyrrole synthesis | 1.51 | 0.0500 | – | – | – | – | |
| lipid metabolism | 1.27 | 0.0038 | – | – | – | – | |
| PS | 2.68 | 0.0000 | 0.12 | 0.0025 | 0.27 | 0.0034 | |
| major CHO metabolism | 2.13 | 0.0000 | – | – | 0.00 | 0.0037 | |
| cell wall | 1.89 | 0.0000 | 0.62 | 0.0180 | – | – | |
| cell | 0.96 | 0.0350 | – | – | – | – | |
| mitochondrial electron transport/ATP synthesis | 0.58 | 0.0072 | – | – | – | – | |
| Co-factor and vitamine metabolism | 0.24 | 0.0008 | – | – | – | – | |
| 5 | protein | 0.58 | 0.0000 | 0.64 | 0.0000 | 0.69 | 0.0000 |
| DNA | 0.17 | 0.0000 | 0.40 | 0.0000 | 0.32 | 0.0000 | |
NF: Normalized frequency = sample frequency of each category in this experiment/background frequency of each category in the Arabidopsis genome.
Genes with P-value <0.05 and fold change >2.0 were loaded and annotated in the Classification SuperViewer Tool (http://bar.utoronto.ca/ntools/cgi-bin/ntools_classification_superviewer.cgi). MapMan was used as the classification source to assign functional categories for each gene. Group 1: pathways enriched by both salt and ecotype effects; Group 2: pathways enriched by salt effect and ecotype effect in the presence of salt; Group 3: pathways mainly enriched by salt effect; –: no significant enrichment. The color scales indicated different normalized frequencies which were described in Materials and Methods.
Table 2. Stress-related GO term enrichment analysis.
| Groups | GO Terms | Salt vs. Control | minus salt | plus salt | |||
| Sha vs. other ecotypes | Sha vs. other ecotypes | ||||||
| P-value | NF1 | P-value | NF1 | P-value | NF1 | ||
| 1 | GO:0006950response to stress | 0.0000 | 1.59 | 0.0000 | 1.45 | 0.0236 | 1.24 |
| GO:0006952defense response | 0.0000 | 1.57 | 0.0000 | 1.75 | 0.0181 | 1.48 | |
| GO:0050896response to stimulus | 0.0000 | 1.52 | 0.0040 | 1.26 | – | – | |
| GO:0007154cell communication | 0.0000 | 1.67 | 0.0330 | 1.46 | – | – | |
| 2 | GO:0044277cell wall disassembly | 0.0105 | 5.01 | – | – | – | – |
| GO:0006812cation transport | 0.0000 | 2.05 | – | – | – | – | |
| GO:0055080cation homeostasis | 0.0008 | 1.98 | – | – | – | – | |
| GO:0050801ion homeostasis | 0.0006 | 1.92 | – | – | – | – | |
| GO:0051049regulation of transport | 0.0007 | 2.10 | – | – | – | – | |
| GO:0043269regulation of ion transport | 0.0002 | 2.24 | – | – | – | – | |
| GO:0006820anion transport | 0.0000 | 2.49 | – | – | – | – | |
| GO:0010155regulation of proton transport | 0.0139 | 2.54 | – | – | – | – | |
| 3 | GO:0009628response to abiotic stimulus | 0.0000 | 1.51 | – | – | – | – |
| GO:0009607response to biotic stimulus | 0.0000 | 1.68 | – | – | – | – | |
| GO:0009737response to abscisic acid stimulus | 0.0000 | 2.31 | – | – | – | – | |
| GO:0009269response to desiccation | 0.0131 | 3.28 | – | – | – | – | |
| GO:0009414response to water deprivation | 0.0000 | 3.05 | – | – | – | – | |
| GO:0009408response to heat | 0.0000 | 2.17 | – | – | – | – | |
| GO:0006979response to oxidative stress | 0.0000 | 1.79 | – | – | – | – | |
| GO:0009651response to salt stress | 0.0000 | 1.72 | – | – | – | – | |
| GO:0006970response to osmotic stress | 0.0000 | 1.72 | – | – | – | – | |
| GO:0009409response to cold | 0.0000 | 1.72 | – | – | – | – | |
Term enrichment analysis was performed using AmiGO software.
NF: Normalized frequency = sample frequency of each category in this experiment/background frequency of each category in the Arabidopsis genome.
Specific genes regulated by Sha ecotype effect and salt effect
In total, 98 of the 218 genes which were differentially expressed by Sha relative to both Ler and Col also showed significantly expression changes after salt treatment, including 29 up-regulated genes and 69 down-regulated genes (Table 3). This set of genes mainly functions in secondary metabolism, hormone metabolism, regulation of transcription, protein metabolism, and signaling (Table 3A, B). There were several genes with increased or decreased expression in Sha relative to Ler and Col exhibited the opposite trend in response to salt (Table 3C and D). For example, one extensin gene (AT1G26250), one oxidase gene (AT5G23980), and one methyltransferase (AT1G77530) were down-regulated under salt stress condition, but exhibited 2 to 16-fold increases in transcript abundance in Sha in relative to the other two ecotypes (Table 3C). Meanwhile, several genes with annotated function in secondary metabolism, biotic stress, and transcriptional regulation were up-regulated by salt stress, but down-regulated in Sha. It’s worth mentioning that one oxidoreductase gene (AT5G54190) and one transposase gene (AT3G02515) were up-regulated by salt 2 to 4-fold, but showed up to 1038-fold decreases in Sha in comparison to Ler and Col (Table 3D).
Table 3. List of genes commonly regulated by salt treatment and in Sha ecotype.
| locus | – NaCl | + NaCl | Salt vs. Control | MapMan BIN | GeneName | ||||
| Sha vs. Ler | Sha vs. Col | Sha vs. Ler | Sha vs. Col | Col | Ler | Sha | |||
| A: Up-regulation by Sha effect and salt effect | |||||||||
| AT2G02560 | 2.33 | 1.95 | 2.17 | 2.19 | 0.97 | 1.37 | 1.21 | [17.2.2] hormone metabolism | CAND1 |
| AT5G43570 | 1.89 | 2.44 | 2.38 | 2.85 | 2.25 | 2.19 | 2.67 | [20.1.7.6] stress.biotic | PR protein |
| AT5G57260 | 2.16 | 2.68 | 2.67 | 3.57 | 0.81 | 1.19 | 1.70 | [26.10] misc.cytochrome P450 | CYP71B10 |
| AT1G73010 | 1.14 | 1.31 | 1.00 | 1.28 | 3.49 | 3.60 | 3.45 | [26.13] misc.acid and phosphatases | phosphatase |
| AT4G24890 | 3.99 | 3.70 | 3.52 | 3.75 | 1.02 | 1.54 | 1.07 | [26.13] misc.acid and phosphatases | acid phosphatase |
| AT5G62080 | 1.96 | 2.31 | 1.11 | 1.50 | 2.26 | 2.31 | 1.46 | [26.21] misc.protease inhibitor | protease inhibitor |
| AT2G46880 | 4.25 | 1.68 | 1.33 | 1.94 | 1.60 | 4.79 | 1.86 | [26.27] misc.phosphoesterase | PAP14 |
| AT1G59670 | 2.34 | 2.93 | 3.36 | 3.04 | 3.33 | 2.43 | 3.45 | [26.9] misc.glutathione S transferases | ATGSTU15 |
| AT4G16160 | 1.99 | 2.52 | 1.00 | 2.14 | 3.74 | 4.34 | 3.35 | [29.3.2] protein.targeting.mitochondria | ATOEP16-2 |
| AT1G53080 | 1.73 | 1.87 | 1.29 | 1.20 | 5.91 | 5.69 | 5.25 | [29.4] protein.postranslational mod. | lectin |
| AT3G10510 | 2.89 | 1.71 | 2.19 | 1.55 | 3.21 | 3.74 | 3.05 | [29.5.11.4.3.2] protein.degradation | F-box |
| AT1G67000 | 1.50 | 2.72 | 1.66 | 1.90 | 1.95 | 0.99 | 1.14 | [30.2.20] signalling.receptor kinases | protein kinase |
| AT3G18610 | 1.12 | 1.42 | 1.17 | 2.28 | 1.55 | 2.36 | 2.40 | [30.5] signalling.G-proteins | nucleolin |
| AT2G25340 | 1.56 | 2.64 | 2.01 | 3.14 | 2.83 | 2.88 | 3.32 | [31.4] cell.vesicle transport | ATVAMP712 |
| AT2G41260 | 5.55 | 2.70 | 1.92 | 4.02 | −0.45 | 4.50 | 0.87 | [33.99] development.unspecified | LEA |
| AT1G04560 | 2.31 | 2.55 | 2.31 | 2.67 | 6.06 | 6.17 | 6.17 | [34.99] transport.misc | AWPM-19-like |
| AT5G55070 | 1.30 | 1.22 | 1.42 | 2.11 | 0.81 | 1.57 | 1.69 | [8.1.5] TCA/org. transformation.TCA | dehydrogenase |
| B: Down-regulation by Sha effect and salt effect | |||||||||
| AT2G15050 | −3.34 | −3.97 | −3.63 | −4.07 | −1.13 | −0.94 | −1.23 | [11.6] lipid metabolism | LTP; lipid binding |
| AT4G15340 | −1.01 | −3.37 | −2.40 | −3.05 | −2.60 | −0.88 | −2.27 | [16.1.5.1003] secondary metabolism | ATPEN1 |
| AT1G34060 | −2.50 | −1.45 | −1.25 | −2.38 | −0.44 | −2.63 | −1.38 | [16.5.99.1] secondary metabolism | alliinase |
| AT1G34490 | −3.10 | −1.32 | −3.44 | −2.65 | −2.98 | −3.97 | −4.32 | [16.7.1001] secondary metabolism | wax synthase |
| AT5G18020 | −2.51 | −2.71 | −1.71 | −2.83 | −2.69 | −3.61 | −2.81 | [17.2.3] hormone metabolism.auxin | auxin-responsive |
| AT1G56680 | −1.41 | −1.21 | −2.34 | −2.60 | −2.91 | −3.37 | −4.30 | [20.1.1001] stress.biotic | glycoside hydrolase |
| AT2G15080 | −4.48 | −3.89 | −3.83 | −3.51 | −3.00 | −3.28 | −2.62 | [20.1.7] stress.biotic.PR-proteins | AtRLP19 |
| AT4G19530 | −1.38 | −1.81 | −1.76 | −2.48 | −1.45 | −1.75 | −2.13 | [20.1.7] stress.biotic.PR-proteins | disease resistance |
| AT3G46940 | −1.19 | −1.07 | −2.13 | −1.96 | −1.20 | −1.14 | −2.09 | [23.5.5] nucleotide metabolism | nucleotidohydrolase |
| AT5G03350 | −3.95 | −2.65 | −5.67 | −4.46 | −2.21 | −2.30 | −4.02 | [26.16] misc.myrosinases | lectin |
| AT1G54000 | −1.15 | −1.12 | −1.75 | −1.40 | −1.27 | −0.96 | −1.56 | [26.16] misc.myrosinases | myrosinase |
| AT3G43670 | −1.47 | −1.25 | −1.97 | −2.75 | −0.35 | −1.35 | −1.85 | [26.7] misc.oxidases − copper, flavone | amine oxidase |
| AT1G63100 | −1.73 | −1.46 | −1.59 | −1.48 | −1.46 | −1.62 | −1.48 | [27.3.21] RNA.transcription regulation | scarecrow TF |
| AT3G27920 | −1.06 | −2.00 | −1.82 | −2.00 | −1.75 | −0.99 | −1.75 | [27.3.25] RNA.transcription regulation | MYB |
| AT1G26680 | −1.64 | −2.24 | −1.63 | −2.36 | −1.06 | −1.19 | −1.19 | [27.3.41] RNA.transcription regulation | B3 TF |
| AT5G10570 | −2.39 | −1.21 | −2.09 | −1.38 | −1.86 | −2.34 | −2.03 | [27.3.6] RNA.transcription regulation | Bhlh |
| AT5G44560 | −1.06 | −1.63 | −1.84 | −1.70 | −1.05 | −0.33 | −1.12 | [27.3.71] RNA.transcription regulation | VPS2.2 |
| AT1G03420 | −1.36 | −2.60 | −2.13 | −3.44 | −0.93 | −1.00 | −1.77 | [28.1.1] DNA.transposase | oxidoreductase |
| AT5G44635 | −1.19 | −1.85 | −1.50 | −2.15 | −1.29 | −1.28 | −1.60 | [28.1] DNA.synthesis | MCM protein |
| AT1G56720 | −1.16 | −1.53 | −1.14 | −1.84 | −0.84 | −1.17 | −1.15 | [29.4.1.55] protein.kinase | protein kinase |
| AT3G07070 | −1.66 | −1.53 | −3.23 | −2.78 | −2.57 | −2.24 | −3.82 | [29.4.1.57] protein.kinase | protein kinase |
| AT1G48260 | −3.59 | −4.02 | −4.27 | −3.56 | −1.55 | −0.40 | −1.09 | [29.4] protein.postranslat. modification | CIPK17 |
| AT4G20430 | −1.53 | −1.65 | −1.69 | −2.22 | −0.93 | −1.34 | −1.50 | [29.5.1] protein.degradation.subtilases | subtilase |
| AT3G44120 | −1.73 | −1.43 | −1.15 | −1.82 | −1.07 | −2.03 | −1.45 | [29.5.11] protein.ubiquitin.E3 | F-box |
| AT3G51350 | −1.89 | −1.82 | −2.53 | −2.60 | −3.01 | −3.16 | −3.79 | [29.5.4] protein.degradation | aspartyl protease |
| AT4G39710 | −3.05 | −2.98 | −3.15 | −3.63 | −3.51 | −4.06 | −4.16 | [29.6] protein.folding | immunophilin |
| AT3G50840 | −1.95 | −1.64 | −2.20 | −2.67 | −1.38 | −2.17 | −2.42 | [30.11] signalling.light | NPH3protein |
| AT5G39030 | −3.93 | −3.09 | −3.67 | −2.61 | −1.32 | −1.09 | −0.83 | [30.2.16] signalling.receptor kinases | protein kinase |
| AT1G11280 | −4.18 | −4.19 | −4.34 | −4.74 | −0.73 | −1.12 | −1.28 | [30.2.24] signalling.receptor kinases | protein kinase |
| AT5G49760 | −1.64 | −1.28 | −1.58 | −1.22 | −1.04 | −1.04 | −0.98 | [30.2.8.1] signalling.receptor kinases | protein kinase |
| AT1G51805 | −1.75 | −2.30 | −1.13 | −2.67 | −1.26 | −2.24 | −1.62 | [30.2.99] signalling.receptor kinases | protein kinase |
| AT3G47220 | −1.03 | −1.35 | −3.14 | −3.20 | −1.02 | −0.76 | −2.87 | [30.4.4] signalling.phosphinositides | phospholipase C |
| AT5G02370 | −1.28 | −1.36 | −1.91 | −1.75 | −1.61 | −1.36 | −2.00 | [31.1] cell.organisation | kinesin |
| AT1G73690 | −1.16 | −1.25 | −2.42 | −1.92 | −1.01 | −0.42 | −1.68 | [31.2] cell.division | CDKD1;1 |
| AT3G62030 | −1.64 | −1.52 | −1.14 | −1.24 | −1.03 | −1.25 | −0.75 | [31.3.1] cell.cycle. isomerase | ROC4 |
| AT2G26760 | −1.28 | −1.46 | −1.73 | −1.72 | −1.52 | −1.33 | −1.77 | [31.3] cell.cycle | CYCB1;4 |
| AT3G05480 | −1.51 | −2.34 | −1.80 | −2.51 | −1.18 | −1.06 | −1.35 | [31.3] cell.cycle | RAD9 |
| AT1G66725 | −2.70 | −1.81 | −2.04 | −1.95 | −0.80 | −1.60 | -0.93 | [32] micro RNA, natural antisense etc | miscRNA |
| AT4G22233 | −1.87 | −2.39 | −1.27 | −2.91 | −0.65 | −1.76 | −1.16 | [32] micro RNA, natural antisense etc | miscRNA |
| AT2G21045 | −3.05 | −2.63 | −2.95 | −2.33 | −1.66 | −1.46 | −1.36 | [33.99] development.unspecified | hypothetical protein |
| C: Up-regulation by Sha effect and dow-regulation by salt effect | |||||||||
| AT1G26250 | 1.70 | 1.98 | 1.02 | 1.31 | −3.10 | −3.10 | −3.78 | [10.5.3] cell wall proteins.LRR | extensin |
| AT5G23980 | 4.34 | 1.18 | 3.87 | 2.32 | −4.44 | −2.82 | −3.30 | [15.1] metal handling.acquisition | oxidase |
| AT1G77530 | 1.59 | 1.70 | 1.33 | 1.01 | −3.70 | −4.14 | −4.40 | [16.2] secondary metabolism | methyltransferase |
| AT5G63595 | 1.92 | 2.13 | 1.43 | 1.75 | −1.67 | −1.55 | −2.04 | [16.8.4] secondary metabolism | flavonol synthase |
| AT5G38020 | 2.66 | 1.84 | 2.64 | 1.38 | −0.90 | −1.34 | −1.36 | [17.8] hormone.salicylic acid | methyltransferase |
| AT2G21550 | 2.99 | 1.57 | 3.67 | 1.97 | −1.47 | −1.76 | −1.07 | [25] C1-metabolism | DHFR-TS |
| AT5G38540 | 5.52 | 3.08 | 4.91 | 3.73 | −3.81 | −2.55 | −3.16 | [26.16] misc.myrosinases | jacalin lectin |
| AT2G19910 | 3.03 | 1.56 | 2.66 | 1.36 | −1.47 | −1.30 | −1.67 | [27.2] RNA.transcription | RNA polymerase |
| AT2G19410 | 1.18 | 1.03 | 1.17 | 1.03 | −2.43 | −2.42 | −2.43 | [29.4.1] protein.kinase | protein kinase |
| AT2G03200 | 1.34 | 1.08 | 1.42 | 1.03 | −1.58 | −1.71 | −1.63 | [29.5.4] protein.degradation | aspartyl protease |
| AT5G59670 | 1.17 | 1.82 | 1.96 | 1.35 | −1.97 | −3.24 | −2.44 | [30.2.1] signalling.receptor kinase | protein kinase |
| AT3G45680 | 1.62 | 1.54 | 2.12 | 1.44 | −1.06 | −1.67 | −1.17 | [34.13] transport.peptides | transport |
| D: Down-regulation by Sha effect and up-regulation by salt effect | |||||||||
| AT4G08870 | −2.30 | −2.40 | −2.44 | −2.29 | 1.87 | 2.12 | 1.98 | [13.2] amino acid.degradation | arginase |
| AT1G61120 | −4.23 | −1.45 | −5.14 | −2.52 | 5.12 | 4.96 | 4.05 | [16.1] secondary metabolism | terpene synthase |
| AT1G52040 | −1.49 | −1.84 | −1.88 | −2.50 | 3.32 | 3.04 | 2.66 | [16.5] secondary metabolism | MBP1 |
| AT4G22870 | −1.16 | −2.38 | −1.13 | −1.82 | 2.09 | 2.62 | 2.65 | [16.8] secondary metabolism | dioxygenase |
| AT5G42800 | −2.48 | −2.46 | −2.09 | −1.99 | 2.69 | 2.77 | 3.16 | [16.8] secondary metabolism | DFR |
| AT5G54190 | −7.06 | −4.45 | −7.09 | −3.53 | 1.48 | 2.43 | 2.41 | [19.14] tetrapyrrole synthesis | oxidoreductase |
| AT1G45616 | −4.96 | −6.17 | −3.36 | −4.93 | 3.99 | 3.63 | 5.24 | [20.1.1001] stress.biotic | AtRLP6 |
| AT3G44670 | −3.06 | −4.43 | −1.46 | −3.31 | 1.10 | 0.61 | 2.22 | [20.1.2] stress.biotic.receptors | receptor |
| AT3G59930 | −2.43 | −3.40 | −1.45 | −1.20 | 1.76 | 2.98 | 3.97 | [20.1.7] stress.biotic.PR-proteins | hypothetical protein |
| AT5G33355 | −2.67 | −3.45 | −1.33 | −1.16 | 1.81 | 2.77 | 4.10 | [20.1.7] stress.biotic.PR-proteins | hypothetical protein |
| AT4G15910 | −3.06 | −2.57 | −1.79 | −1.63 | 2.60 | 2.27 | 3.54 | [20.2.3] stress.abiotic.drought/salt | ATDI21 |
| AT4G14090 | −1.25 | −2.04 | −1.34 | −2.02 | 2.47 | 2.58 | 2.49 | [26.2] misc.UDPG transferases | glucosyl transferase |
| AT2G39030 | −3.24 | −2.00 | −1.25 | −1.04 | 8.02 | 6.99 | 8.98 | [26.24] misc.N-acetyltransferase | acetyltransferase |
| AT2G43660 | −1.66 | −3.01 | −1.25 | −1.42 | 2.27 | 3.46 | 3.87 | [26.4] misc.beta 1,3 glucan hydrolases | glycosyl hydrolase |
| AT1G62580 | −4.03 | −3.20 | −4.91 | −5.71 | 4.63 | 3.00 | 2.12 | [26.7] misc.oxidases – copper, flavone | monooxygenase |
| AT2G23620 | −2.85 | −1.17 | −2.75 | −1.34 | 1.21 | 0.95 | 1.04 | [26.8] misc.nitrilases, *nitrile lyase | hydrolase |
| AT3G01540 | −1.48 | −1.61 | −1.77 | −1.49 | 0.89 | 1.31 | 1.02 | [27.1.2] RNA.RNA helicase | DRH1 |
| AT4G12350 | −3.56 | −3.63 | −3.41 | −2.55 | 1.45 | 2.38 | 2.53 | [27.3] RNA.regulation of transcription | MYB42 |
| AT5G46830 | −2.66 | −3.86 | −1.60 | −2.61 | 2.12 | 2.31 | 3.37 | [27.3] RNA.regulation of transcription | bHLH |
| AT4G20970 | −1.75 | −2.13 | −1.04 | −1.55 | 3.25 | 3.14 | 3.84 | [27.3] RNA.regulation of transcription | bHLH |
| AT1G51700 | −1.22 | −1.33 | −1.21 | −1.24 | 1.59 | 1.68 | 1.69 | [27.3] RNA.regulation of transcription | ADOF1 |
| AT3G02515 | ### | −5.22 | −8.26 | −4.02 | 1.00 | 0.44 | 2.20 | [28.1] DNA.transposase | transposase |
| AT5G43580 | −3.89 | −2.56 | −2.52 | −1.77 | 1.74 | 1.16 | 2.53 | [29.5] protein.degradation | peptidase inhibitor |
| AT1G66830 | −1.60 | −1.26 | −1.96 | −1.38 | 2.79 | 3.04 | 2.68 | [30.2.3] signalling.receptor kinases | protein kinase |
| AT1G53160 | −1.14 | −1.89 | −2.32 | −2.27 | 4.47 | 5.27 | 4.09 | [33.3] development.SPL | SPL4 |
| AT3G54150 | −2.74 | −1.48 | −2.29 | −1.02 | 1.74 | 1.75 | 2.20 | [33.99] development.unspecified | embryo-abundant |
| AT3G49620 | −1.20 | −1.10 | −4.38 | −1.36 | 2.02 | 4.94 | 1.76 | [33.99] development.unspecified | DIN11 |
| AT4G18210 | −2.28 | −1.65 | −2.63 | −2.21 | 1.60 | 1.39 | 1.05 | [34.10] transport.nucleotides | ATPUP10 |
| AT2G04070 | −4.29 | −2.59 | −6.15 | −4.36 | 3.69 | 3.78 | 1.92 | [34.99] transport.misc | antiporter |
Black background means an increase (denoted by up-regulation in the heading) in transcript abundance, and grey background means a decrease (denoted by the heading down-regulation) in transcript abundance. Fold changes are log 2 values.
Discussion
In this work, natural variations in salt tolerance among Sha, Ler and Col ecotypes were analyzed based on their responses to salt treatment in seed germination, root growth, and performance of adult plants in soil (Figure 1–3; Figure S1). All of these results were consistent with previous studies where Ler and Col were observed to be relatively salt-sensitive, but Sha was salt-tolerant [14], [15], [29].
Abiotic stresses cause oxidative stress via rapid and excessive production of reactive oxygen species (ROS), which can lead to oxidative damages [43], [44]. To scavenge the over-production of ROS, plants have developed complex antioxidant defense systems, including antioxidant enzymes like SOD, CAT, and POD. Physiological analyses in this study indicated that salt tolerant Sha ecotype exhibited higher antioxidant enzyme activities and thus less accumulation of ROS than those of other two ecotypes (Figure 3). EL, as one indicator of cell membrane stability, has been widely used to evaluate the extent of cell injury when subjected to various environmental stresses [26]. As the most salt susceptible ecotype, Ler showed highest EL when compared to that in Sha and Col after salt treatment (Figure 2D), indicating that Ler suffered the most severe cell injury. This result was consistent with highest accumulation of ROS and lowest survival in Ler ecotype (Figure 2B).
To date, transcriptional level changes involved in salt tolerant Sha ecotypes were still largely unknown.Our study differs from prior transcriptome analyses in two important ways that are worth considering. First, two salt susceptible Arabidopsis ecotypes (Ler and Col) besides salt tolerant Sha ecotype were used in this study to narrow down the gene list for characterization of salt stress responsive genes in the Sha ecotype. Second, Agilent-021169 Arabidopsis 4 Oligo Microarray were used because many genes were missed in the widely used Affymetrix ATH1 array (like ABA receptors PYL10-13).
The transcriptome data here revealed that half of salinity affected genes were commonly up-regulated or down-regulated in all three ecotypes (Figure 5C). In a previous report, we also observed that the majority of salt affected genes were in common between Wassilewskija (Ws) and Col ecotypes [41]. These stress inducible genes played either protective (positive) role or damaging (negative) role and led to abiotic stress adaptation in plants. To characterize a single protective or damaging gene is difficult because overexpression of several genes increases plant stress tolerance but inhibits plant growth as well [41], [42].
Pathway enrichment analysis is an effective approach to characterize “gene networks” after treatment. We observed that redox related genes encoding thioredoxin, ascorbate and glutathione and glutaredoxins were mainly repressed by salinity (Table S1), in which caused increased ROS levels in tested ecotypes (Figure 3A). In addition, our results indicated that fermentation, photosynthesis, polyamine metabolism, secondary metabolism, hormone metabolism and stress related pathways were over-represented after salinity treatment (Table 1). Many genes involved in light reactions, photorespiration and the Calvin cycle were uniformly down-regulated after salt stress treatments (Table S1). Increase of fermentation related genes (encoding aldehyde dehydrogenase, pyruvate decarboxylase-2, and alcohol dehydrogenase) and inhibition of photosynthesis related genes (encoding PSI and PS II polypeptide subunits, Calvin cycle related proteins) (Table S1) by salt stress might be involved in inhibition of plant growth and development.
Further overlap analysis showed that about 30% genes were commonly regulated by both Sha vs. Ler and Sha vs. Col (Figure 5A and B; Figure S4). These results confirmed that extensive transcriptional diversity exists among Arabidopsis ecotypes. Interestingly, expression levels of many transposable element (TE) and microRNA (miRNA) were significantly changed in the comparisons of Sha vs. Ler and Sha vs. Col for up to 1351-fold increases (AT5G27345) and 1629-fold decreases (AT2G13665) (Figure 6B; Table S2). TEs are referred as “controlling elements” in plants [45] and transposon activation in response to abiotic stress has been reported [46], [47]. miRNAs play essential roles in regulating plant stress responses [48]. Therefore, extensive changes of expression of TEs and miRNAs in the comparisons of Sha vs. Ler and Sha vs. Col here indicated that these genes could be involved in salt tolerance of Sha ecotype.
There also were extensive differences in gene expression between Sha and the other two ecotypes for transcription factors (TFs), including heat shock TFs (HSF) and MADS box TFs (Figure 6B). It has been reported that the HSF function as transcriptional activators and directly regulate the expression of various abiotic stress responsive genes [49], [50]. Arabidopsis with overexpression of AtHSFA2 and transgenic tobacco with sunflower HSFA9 conferred increased tolerance to severe environmental stresses [50], [51]. Plant MADS-box genes were involved in flowering-time control, reproductive organ development, and vegetative growth [52], [53]. In this study, MADS-box genes were mainly down-regulated when comparing Sha to other two ecotypes, indicating these genes might also function in stress responses. Moreover, several F-box genes were changed in the comparisons of Sha vs. Ler and Sha vs. Col (Figure 6B). In plants, many F-box proteins are targets of microRNAs [54] which showed differential expression between Sha and the other two ecotypes (Figure 6B). One F-box protein, TIR1, is actually an auxin receptor [55], [56]. These changes in the Sha ecotype might contribute to enhanced salt tolerance relative to Col and Ler.
Transcript levels commonly or contrastingly changed by both salt and the Sha ecotype were of particular interest (Table 3). Further studies are needed to understand the detailed functions of genes that are differentially expressed between Sha and the other two ecotypes. In summary, the Sha ecotype exhibited increased salt tolerance when compared to Ler and Col. One possible model related to salt tolerance of Sha is depicted in Figure 7. Genes involved in CHO metabolism, photosynthesis, cell wall, polyamine and fermentation were extensively changed by salinity effect, while TEs and miRNA related genes were mainly related to the Sha ecotype effect. Other pathways including hormone metabolism, secondary metabolism, TCA, transcriptional factors, transport and development were changed by both salinity and Sha ecotype effects (Figure 7). Therefore, the Sha ecotype showed increased tolerance to stress and defense response, while salt treatment induced tolerance to other abiotic stresses like heat, cold, drought and salt (Table 2). Our results suggest that the Sha ecotype is possibly preconditioned to abiotic stress when compared to Ler and Col through regulation of signaling pathways and stress responsive gene expression. Further studies about the detailed functions of differentially expressed genes between Sha and other two ecotypes are needed.
Figure 7. Model of salt effect and ecotype effects.
Supporting Information
Effect of salt treatment on root growth of Sha, Col and Ler ecotypes.
(TIF)
Expression changes of stress responsive genes by salt effect and Sha ecotype effect.
(TIF)
Cluster analyses of genes involved in ABA signaling transduction pathway.
(TIF)
Cluster analyses of all differentially expressed genes by salt treatment or among ecotypes.
(TIF)
Cluster analyses of specific pathway related genes.
(TIF)
Total gene lists differentially expressed by salt treatment or among ecotypes.
(XLSX)
Transposable element, miroRNA and histone related transcripts differentially expressed by salt treatment or among ecotypes.
(XLSX)
Acknowledgments
Data accessibility
The normalized microarray data have been submitted to the Gene Expression Omnibus (GEO) database with accession number (GSE40940).
Funding Statement
This research was supported by “the Hundred Talents Program”, the Knowledge Innovative Key Program of Chinese Academy of Sciences (grant number 54Y154761O01076) to Zhulong Chan. The funders had no role in study design, data collection and analysis, decision to publish, or preparation of the manuscript.
References
- 1. Hasegawa P, Bressan R, Zhu J, Bohnert H (2000) Plant cellular and molecular responses to high salinity. Annu Rev Plant Physiol and Plant Mol Biol 51: 463–499. [DOI] [PubMed] [Google Scholar]
- 2. Chan Z, Grumet R, Loescher W (2011) Global gene expression analysis of transgenic, mannitol-producing and salt tolerant Arabidopsis thaliana indicates widespread changes in expression of abiotic- and biotic-stress related genes. J Exp Bot 62: 4787–4803. [DOI] [PMC free article] [PubMed] [Google Scholar]
- 3. Chan Z, Bigelow PJ, Loescher W, Grumet R (2012) Comparison of salt stress resistance genes in transgenic Arabidopsis thaliana indicates that extent of transcriptomic change may not predict secondary phenotypic or fitness effects. Plant Biotechnol J 10: 284–300. [DOI] [PubMed] [Google Scholar]
- 4. Zhu J-K (2001) Plant salt tolerance. Trends Plant Sci 6: 66–71. [DOI] [PubMed] [Google Scholar]
- 5. Loescher W, Chan Z, Grumet R (2011) Options for Developing Salt Tolerant crops. HortScience 46: 1085–1092. [Google Scholar]
- 6. Zhifang G, Loesher W (2003) Expression of a celery mannose 6-phosphate reductase in Arabidopsis thaliana enhances salt tolerance and induces biosynthesis of both mannitol and a mannitol dimer. Plant Cell Environ 26: 275–283. [Google Scholar]
- 7. Shi H, Lee B, Wu S-J, Zhu J-K (2003) Overexpression of a plasma membrane Na+/H+ antiporter gene improves salt tolerance in Arabidopsis. Nat Biotech 21: 81–85. [DOI] [PubMed] [Google Scholar]
- 8. Kasuga M, Liu Q, Miura S, Yamaguchi-Shinozaki K, Shinozaki K (1999) Improving plant drought, salt, and freezing tolerance by gene transfer of a single stress-inducible transcription factor. Nat Biotech 17: 287–291. [DOI] [PubMed] [Google Scholar]
- 9. Vallejo AJ, Yanovsky MJ, Botto J (2010) Germination variation in Arabidopsis thaliana accessions under moderate osmotic and salt stresses. Annal Bot 106: 833–842. [DOI] [PMC free article] [PubMed] [Google Scholar]
- 10. Shi H, Wang Y, Cheng Z, Ye T, Chan Z (2012) Analysis of natural variation in bermudagrass (Cynodon dactylon) reveals physiological responses underlying drought tolerance. PLoS ONE 7: e53422. [DOI] [PMC free article] [PubMed] [Google Scholar]
- 11. Quesada V, Garcia-Martinez S, Piqueras P, Ponce MR, Micol JL (2002) Genetic architecture of NaCl tolerance in Arabidopsis. Plant Physiol 130: 951–963. [DOI] [PMC free article] [PubMed] [Google Scholar]
- 12. Katori T, Ikeda A, Iuchi S, Kobayashi M, Shinozaki K, et al. (2010) Dissecting the genetic control of natural variation in salt tolerance of Arabidopsis thaliana accessions. J Exp Bot 61: 1125–1138. [DOI] [PMC free article] [PubMed] [Google Scholar]
- 13. DeRose-Wilson L, Gaut BS (2011) Mapping Salinity Tolerance during Arabidopsis thaliana germination and seedling growth. PLoS ONE 6: e22832. [DOI] [PMC free article] [PubMed] [Google Scholar]
- 14. Galpaz N, Reymond M (2010) Natural variation in Arabidopsis thaliana revealed a genetic network controlling germination under salt stress. PLoS ONE 5: e15198. [DOI] [PMC free article] [PubMed] [Google Scholar]
- 15. Ren Z, Zheng Z, Chinnusamy V, Zhu J, Cui X, et al. (2010) RAS1, a quantitative trait locus for salt tolerance and ABA sensitivity in Arabidopsis. Proc Nat Acade Sci USA 107: 5669c5674. [DOI] [PMC free article] [PubMed] [Google Scholar]
- 16. Harada H, Leigh RA (2006) Genetic mapping of natural variation in potassium concentrations in shoots of Arabidopsis thaliana . J Exp Bot 57: 953–960. [DOI] [PubMed] [Google Scholar]
- 17. Rus A, Baxter I, Muthukumar B, Gustin J, Lahner B, et al. (2006) Natural variants of AtHKT1 enhance Na+ accumulation in two wild populations of Arabidopsis. PLoS Genetics 2: e210. [DOI] [PMC free article] [PubMed] [Google Scholar]
- 18. Alonso-Blanco C, Koornneef M (2000) Naturally occurring variation in Arabidopsis: an underexploited resource for plant genetics. Trends Plant Sci 5: 22–29. [DOI] [PubMed] [Google Scholar]
- 19. Millenaar F, Cox M, van Berkel Y, Welschen R, Pierik R, et al. (2005) Ethylene-induced differential growth of petioles in Arabidopsis: analyzing natural variation; response kinetics; and regulation. Plant Physiol 137: 998–1008. [DOI] [PMC free article] [PubMed] [Google Scholar]
- 20. Hannah MA, Wiese D, Freund S, Fiehn O, Heyer AG, et al. (2006) Natural genetic variation of freezing tolerance in Arabidopsis. Plant Physiol 142: 98–112. [DOI] [PMC free article] [PubMed] [Google Scholar]
- 21. Van Poecke RMP, Sato M, Lenarz-Wyatt L, Weisberg S, Katagiri F (2007) Natural variation in RPS2-mediated resistance among Arabidopsis genotypes: correlation between gene expression profiles and phenotypic responses. Plant Cell 19: 4046–4060. [DOI] [PMC free article] [PubMed] [Google Scholar]
- 22. Vuylsteke M, van Eeuwijk F, Van Hummelen P, Kuiper M, Zabeau M (2005) Genetic Analyses of Variation in Gene Expression in Arabidopsis thaliana . Genetics 171: 1267–1275. [DOI] [PMC free article] [PubMed] [Google Scholar]
- 23. Van Leeuwen H, Kliebenstein D, West M, Kim K, Van Poecke R, et al. (2007) Natural variation among Arabidopsis thaliana genotypes for transcriptome response to exogenous salicylic acid. Plant Cell 19: 2099–2110. [DOI] [PMC free article] [PubMed] [Google Scholar]
- 24. Delker C, Pöschl Y, Raschke A, Ullrich K, Ettingshausen S, et al. (2010) Natural variation of transcriptional auxin response networks in Arabidopsis thaliana . Plant Cell 22: 2184–2200. [DOI] [PMC free article] [PubMed] [Google Scholar]
- 25. Des Marais DL, McKay JK, Richards JH, Sen S, Wayne T, et al. (2012) Physiological genomics of response to soil drying in diverse Arabidopsis accessions. Plant Cell 24: 893–914. [DOI] [PMC free article] [PubMed] [Google Scholar]
- 26. Bouchabke O, Chang F, Simon M, Voisin R, Pelletier G, et al. (2008) Natural variation in Arabidopsis thaliana as a tool for highlighting differential drought responses. PLoS One 3: e1705. [DOI] [PMC free article] [PubMed] [Google Scholar]
- 27. Kesari R, Lasky JR, Villamor JG, Des Marais DL, Chen YJC, et al. (2012) Intron-mediated alternative splicing of Arabidopsis P5CS1 and its association with natural variation in proline and climate adaptation. Proce Nat Acade Sci USA 109: 9197–9202. [DOI] [PMC free article] [PubMed] [Google Scholar]
- 28. Sharma S, Lin W, Villamor JG, Verslues PE (2013) Divergent low water potential response in Arabidopsis thaliana accessions Landsberg erecta and Shahdara. Plant Cell Environ 36: 994–1008. [DOI] [PubMed] [Google Scholar]
- 29. Clerkx EJM, El-Lithy ME, Vierling E, Ruys GJ, Blankestijn-DeVries H, et al. (2004) Analysis of natural allelic variation of Arabidopsis seed germination and seed longevity traits between the accessions Landsberg erecta and Shakdara, using a new recombinant inbred line population. Plant Physiol 135: 432–443. [DOI] [PMC free article] [PubMed] [Google Scholar]
- 30. Trontin C, Tisne S, Bach L, Loudet O (2011) What does Arabidopsis natural variation teach us (and does not teach us) about adaptation in plants? Curr Opinn Plant Biol 14: 225–231. [DOI] [PubMed] [Google Scholar]
- 31. Wang Y, Li L, Ye T, Zhao S, Liu Z, et al. (2011) Cytokinin antagonizes ABA suppression to seed germination of Arabidopsis by downregulating ABI5 expression. Plant J 68: 249–261. [DOI] [PubMed] [Google Scholar]
- 32. Verslues PE, Agarwal M, Katiyar-Agarwal S, Zhu J, Zhu J-K (2006) Methods and concepts in quantifying resistance to drought, salt and freezing, abiotic stresses that affect plant water status. Plant J 45: 523–539. [DOI] [PubMed] [Google Scholar]
- 33. Ramel F, Sulmon C, Cabello-Hurtado F, Taconnat L, Martin-Magniette ML, et al. (2007) Genome-wide interacting effects of sucrose and herbicide-mediated stress in Arabidopsis thaliana: novel insights into atrazine toxicity and sucrose-induced tolerance. BMC Genomics 8: 450. [DOI] [PMC free article] [PubMed] [Google Scholar]
- 34. Hu L, Li H, Pang H, Fu J (2012) Responses of antioxidant gene, protein and enzymes to salinity stress in two genotypes of perennial ryegrass (Lolium perenne) differing in salt tolerance. J Plant Physiol 169: 149–156. [DOI] [PubMed] [Google Scholar]
- 35. Ukeda H, Shimamura T, Tsubouchi M, Harada Y, Nakai Y, et al. (2002) Spectrophotometric assay of superoxide anion formed in Maillard reaction based on highly water-soluble tetrazolium salt. Analy Sci 18: 1151–1154. [DOI] [PubMed] [Google Scholar]
- 36.Aebi HE (1983) Catalase. In: Bergmeyer HU, ed. Methods of Enzymatic Analysis, Vol. 3. 273-286. Weinheim: Verlag Chemie.
- 37. Provart N, Zhu T (2003) A Browser-based Functional Classification SuperViewer for Arabidopsis Genomics. Curr Compu Mol Biol 2003: 271–272. [Google Scholar]
- 38. Thimm O, Blasing O, Gibon Y, Nagel A, Meyer S, et al. (2004) MAPMAN: a user-driven tool to display genomics data sets onto diagrams of metabolic pathways and other biological processes. Plant J 37: 914–939. [DOI] [PubMed] [Google Scholar]
- 39. Carbon S, Ireland A, Mungall CJ, Shu S, Marshall B, et al. (2009) AmiGO Hub, Web Presence Working Group. AmiGO: Online access to ontology and annotation data. Bioinformatics 25: 288–289. [DOI] [PMC free article] [PubMed] [Google Scholar]
- 40. de Hoon MJL, Imoto S, Nolan J, Miyano S (2004) Open Source Clustering Software. Bioinformatics 20: 1453–1454. [DOI] [PubMed] [Google Scholar]
- 41. Chan Z (2012) Expression profiling of ABA pathway transcripts indicates crosstalk between abiotic and biotic stress responses in Arabidopsis. Genomics 100: 110–115. [DOI] [PubMed] [Google Scholar]
- 42. Gilmour SJ, Sebolt AM, Salazar MP, Everard JD, Thomashow MF (2000) Overexpression of the Arabidopsis CBF3 transcriptional activator mimics multiple biochemical changes associated with cold acclimation. Plant Physiol 124: 1854–1865. [DOI] [PMC free article] [PubMed] [Google Scholar]
- 43. Mittler R (2002) Oxidative stress, antioxidants and stress tolerance. Trends Plant Sci 7: 405–410. [DOI] [PubMed] [Google Scholar]
- 44. Apel K, Hirt H (2004) Reactive oxygen species: metabolism, oxidative stress, and signal transduction. Annu Rev Plant Biol 55: 373–399. [DOI] [PubMed] [Google Scholar]
- 45. McClintock B (1968) The states of a gene locus in maize. Carnegie Institute of Washington Yearbook 66: 20–28. [Google Scholar]
- 46. Whitelaw E, Martin DI (2001) Retrotransposons as epigenetic mediators of phenotypic variation in mammals. Nat Genetics 27: 361–365. [DOI] [PubMed] [Google Scholar]
- 47. Schramke V, Allshire R (2003) Hairpin RNAs and retrotransposon LTRs effect RNAi and chromatin-vased gene silencing. Science 301: 1069–1074. [DOI] [PubMed] [Google Scholar]
- 48. Khraiwesh B, Zhu J-K, Zhu JH (2012) Role of miRNAs and siRNAs in biotic and abiotic stress responses of plants. Biochimica et Biophysica Acta 819: 137–148. [DOI] [PMC free article] [PubMed] [Google Scholar]
- 49. Kotak S, Port M, Ganguli A, Bicker F, Von Koskull-Döring P (2004) Characterization of C-terminal domains of Arabidopsis heat stress transcription factors (Hsfs) and identification of a new signature combination of plant class A Hsfs with AHA and NES motifs essential for activator function and intracellular localization. Plant J 39: 98–112. [DOI] [PubMed] [Google Scholar]
- 50. Nishizawa A, Yabuta Y, Yoshida E, Maruta T, Yoshimura K, et al. (2006) Arabidopsis heat shock transcription factor A2 as a key regulator in response to several types of environmental stress. Plant J 48: 535–547. [DOI] [PubMed] [Google Scholar]
- 51. Prieto-Dapena P, Castaño R, Almoguera C, Jordano J (2008) The ectopic overexpression of a seed-specific transcription factor, HaHSFA9, confers tolerance to severe dehydration in vegetative organs. Plant J 54: 1004–1014. [DOI] [PubMed] [Google Scholar]
- 52. Becker A, Theissen G (2003) The major clades of MADS-box genes and their role in the development and evolution of flowering plants. Mol Phylogenetics Evol 29: 464–489. [DOI] [PubMed] [Google Scholar]
- 53. Lee S, Woo YM, Ryu SI, Shin YD, Kim WT, et al. (2008) Further characterization of a rice AGL12 group MADS-box gene, OsMADS26 . Plant Physiol 147: 156–168. [DOI] [PMC free article] [PubMed] [Google Scholar]
- 54. Jones-Rhoades MW, Bartel DP, Bartel B (2006) “MicroRNAS and their regulatory roles in plants”. Annu Rev Plant Biol 57: 19–53. [DOI] [PubMed] [Google Scholar]
- 55. Dharmasiri N, Dharmasiri S, Estelle M (2005) The F-box protein TIR1 is an auxin receptor. Nature 435: 441–445. [DOI] [PubMed] [Google Scholar]
- 56. Kepinski S, Leyser O (2005) The Arabidopsis F-box protein TIR1 is an auxin receptor. Nature 435: 446–451. [DOI] [PubMed] [Google Scholar]
Associated Data
This section collects any data citations, data availability statements, or supplementary materials included in this article.
Supplementary Materials
Effect of salt treatment on root growth of Sha, Col and Ler ecotypes.
(TIF)
Expression changes of stress responsive genes by salt effect and Sha ecotype effect.
(TIF)
Cluster analyses of genes involved in ABA signaling transduction pathway.
(TIF)
Cluster analyses of all differentially expressed genes by salt treatment or among ecotypes.
(TIF)
Cluster analyses of specific pathway related genes.
(TIF)
Total gene lists differentially expressed by salt treatment or among ecotypes.
(XLSX)
Transposable element, miroRNA and histone related transcripts differentially expressed by salt treatment or among ecotypes.
(XLSX)