Abstract
An efficient mammalian cell system for producing bioproducts should retain high cell viability and efficient use of energy sources rendering the need to understand the effects of various variables on the cell system. In this study, global metabolite (metabolomics) analysis approach was used to try and understand the relationships between types of media used, culture growth behavior and productivity. CHO-KI cells producing IGF-1 were obtained from ATCC and grown in T-flask (37 °C, 5 % CO2) until 70–80 % confluent in RPMI 1640 and Ham’s F12, respectively. Samples were taken at 8-hourly intervals for routine cell counting, biochemical responses, insulin like growth factor—1 (IGF-1) protein concentration and global metabolite analysis (gas chromatography mass spectrometry, GCMS). Conditioned media from each time point were spun down before injection into GCMS. Data from GCMS were then transferred to SIMCA-P + Version 12 for chemometric evaluation using principal component analysis. The results showed that while routine analysis gave only subtle differences between the media, global metabolite analysis was able to clearly separate the culture based on growth media with growth phases as confounding factor. Different types of media also appeared to affect IGF-1 production. Asparagine was found to be indicative of healthiness of cells and production of high IGF-1. Meanwhile identification of ornithine and lysine in death phase was found to be associated with apoptosis and oversupplied nutrient respectively. Using the biomarkers revealed in the study, several bioprocessing strategies including medium improvement and in-time downstream processing can be potentially implemented to achieve efficient CHO culture system.
Keywords: CHO-K1, Metabolomics, Metabolite profile, IGF-1, PCA
Introduction
The natural surroundings of mammalian cells (biochemical, physiological and physiochemical) directly affect the growth of cells, their metabolism and expression of products. Effective control of the system is required to optimize yield and to regularize production so that product quality is maintained and downstream processing steps are optimized. A battery of analyses is routinely performed to provide data for elucidation of cell metabolism which is then used for development of bioprocess strategies in the desire to achieve the ideal. This includes determination of the concentration of target bioproducts, cell counting and other biochemical routine analyses. These analyses require repeated sampling at multiple time points which may lead to high cost and potential contamination. Each type of analysis is very specific and has its own procedure with different consumables and apparatus which also incur cost. The information gained through these analyses is also limited to being descriptive in nature with minimal insights of cell metabolism.
Global metabolite analysis (metabolomics) has been used in a wide range of fields, including diagnostic marker search and etiology analysis in medical treatment, biomarker search for revealing efficacy and toxicity in drug manufacturing, and quality control in food processing (Goodacre et al. 2004). Metabolomics has also being used in plant science (Khoo et al. 2007), yeasts-related research (Pope et al. 2007) and increasingly used in nutrition research (Gibney 2005). Although metabolomics have been applied to the mammalian system in relation to disease diagnosis and therapeutic efficacy, pre-clinical drug safety assessment and pharmacology (Lindon et al. 2006), it has been applied to a lesser extent in the mammalian cell culture/bioreactor area (Khoo et al. 2007; Kuystermans et al. 2007). As the number of therapeutic proteins produced by mammalian cell culture in the pharmaceutical industry continues to increase, the need to improve productivity and ensure consistent product quality during process development activities becomes more significant.
There are various analytical instrument platforms for metabolomics approach, namely nuclear magnetic resonance (NMR) spectroscopy, mass spectrometry, chromatographic and column separation, vibrational spectroscopies such as fourier-transform infrared (FTIR) and hyphenated instruments such as gas chromatography mass spectrometry (GCMS) and liquid chromatography mass spectrometry (LCMS) (Khoo et al. 2007). NMR increases the analytical reproducibility and simplicity of sample preparation but it is relatively insensitive compared to mass spectrometry technique (Bradley et al. 2010 and Griffin 2003). Meanwhile, gas chromatography (GC) coupled to mass spectrometry (MS) offers high chromatic resolution but requires chemical derivatization for many biomolecules. Only volatile chemicals can be analyzed without derivatization. MS is designed to separate gas ions according to their m/z (mass to charge ratio) value. GCMS measures mass of analytes and give information about chemical structures including metabolites. While LCMS requires no derivatization of samples and gives excellent throughput, GCMS covers a wider range of global metabolites compared to LCMS (Silas et al. 2005). Meanwhile, rapid analysis of vibrational spectroscopy like fourier-transform infrared (FTIR) and Raman spectrometry need no derivatization step in sample preparation, but sample heating through the intense laser radiation can destroy the sample or cover the spectrum (Dippel 2011).
GCMS has been proven to be an effective tool for identification and quantification of metabolites in mammalian cell lines due to its excellent resolution, sensitivity, separation capacity, and its ability to generate a mass spectrum for each compound, allowing separation and detection of many metabolites (Fernandez et al. 2008; Takeda et al. 1993; Filipiak et al. 2010). In this study, we use gas chromatography coupled to mass spectrometry together with chemometric tools to investigate whether GCMS-based approach can identify factors affecting growth and behavior of cells cultured in different types of media.
Materials and methods
Media and reagents
Ham’s F-12 and RPMI 1640 media were obtained from Cellgro (Herndon, VA, USA). Other reagents include Fetal Bovine Serum, FBS (GIBCO-Invitrogen, carlsbad, CA, USA); Accutase in Dulbecco’s Phosphate-Buffered Saline, DPBS 0.5 mM EDTA (Innovative Cell Technologies, Inc, San Diego, CA, USA); Phosphate Buffered Saline, PBS (dissolved tablet) (SIGMA-ALDRICH, St, Louis, MO, USA).
Cell line
The CHO-K1 (CCL-61™) cell line was obtained from the American Type Culture Collection (ATCC).
Cell culture and growth assessment
Stocks of CHO-K1 cells were revived in 25 cm2 T-flask in 5 ml Ham’s F-12 and RPMI 1640 media, respectively. After several passages, the cells were subcultured in 75 cm2 T-flask in the respective media (15 ml) for 4 days (96 h) with a seeding density 2.0 × 10⁵ cells ml−1, 37 °C, 5 % CO2. Cells were prepared in separate T-flasks for each time point for three independent experiments. Samples were taken at 8-hourly intervals for routine cell counting (Trypan Blue dye exclusion method), biochemical responses and metabolite analysis.
Biochemical/standard analysis
The samples were spun down and the supernatant collected was divided into three portions. Each portion is dedicated for measurement for glucose, glutamine and lactate respectively. These analyses were carried out at all designated time points (8-hourly intervals) in each condition using biochemical analyzer YSI 2700 using specific membranes.
Concentration of IGF-1 protein
IGF-1 protein was studied using Quantikine Mouse IGF-1 Immunoassay (R&D Systems, Inc., Minneapolis, MN, USA). Briefly, the spent (conditioned) media were first spun down. The resulting supernatant samples were diluted into Calibrator Diluent RD5-38 (twofold dilution). All reagents, standard dilutions, control, and samples were prepared as per manufacturer’s instructions. Calibrator diluents RD5-38 were added to each well and mixed with standard dilutions, control and samples and incubated for 2 h at room temperature on a horizontal orbital microplate shaker. After that, washing step was performed using Wash Buffer for a total of five washes. After the final wash, the remaining Wash Buffer was removed and the plate was inverted and cleaned using clean paper towels. Then, 100 μl of Mouse IGF-1 conjugate was added to each well and incubated for 2 h on the shaker. The wash step was again repeated five times prior to adding substrate solution into each well. The plates were then incubated for 30 min in dark. Stop solution was added to each well and the plate was gently tapped to ensure thorough mixing. Lastly, the optical density of each well was determined using a microplate reader.
Gas chromatography mass spectrometry (GCMS) analysis
Sample preparation
Lyophilised extracellular metabolite extracts were prepared for GC–MS analysis by a two-stage derivatisation procedure. Metabolite pellets were resuspended in methoxyamine hydrochloride in pyridine (40 mg/ml; 10 μl) and incubated at 30 °C for 90 min with gentle shaking. N-methyl-N-trimethylsilyltrifluoroacetamide with 1 % trimethylchorosilane (MSTFA + 1 % TMCS) (90 μl) were added and incubated at 37 °C for 30 min. The samples were cooled to room temperature and transferred into silanized GC vials (National Scientific, Rockwood, TN, USA) for GC-MS.
GCMS analysis
Collection of samples (spent media) from each flask designating an 8-hourly sampling was performed, in parallel with collection of samples for standard analysis to allow comparison between data from standard analysis and metabolomics data. GCMS analysis was performed on a 7890A GC System (Agilent Technologies, Santa Clara, CA, USA) coupled to a 5975C Inert XL MSD using the manufacturer’s software (MSD ChemStation). Samples (1 μl with 10:1 split ratio) were injected onto a HP-5MS (Agilent Technologies; 250 μm × 30 m × 0.50 μm film thickness) using helium (1.2 ml/min) as the carrier gas. Components were separated by isothermal chromatography for 1 min at 80 °C, followed by an increase to 325 °C. Mass spectra were acquired in positive ion mode using electron impact ionisation at 70 eV. The injector, MS source and MS quad temperatures were set at 250, 230 and 150 °C respectively. Mass spectra were scanned from 50 to 800 mass units. Metabolite peaks in the raw chromatograms were identified using MSD ChemStation (Agilent Technologies).
Multivariate data analysis
Multivariate data analysis was conducted in SIMCA-P + V12.0. PCA score plot of GCMS data from the spent media of CHO-K1 was generated. In this study, the principle component analysis was based on the top 80 % library-matching of metabolites, given by the retention time.
Results
All experiments were carried out in three biological replicates for each experimental condition. Cell growth and behaviour were observed under various conditions using standard analyses and GCMS-based metabolomics approach.
CHO-K1 cell growth
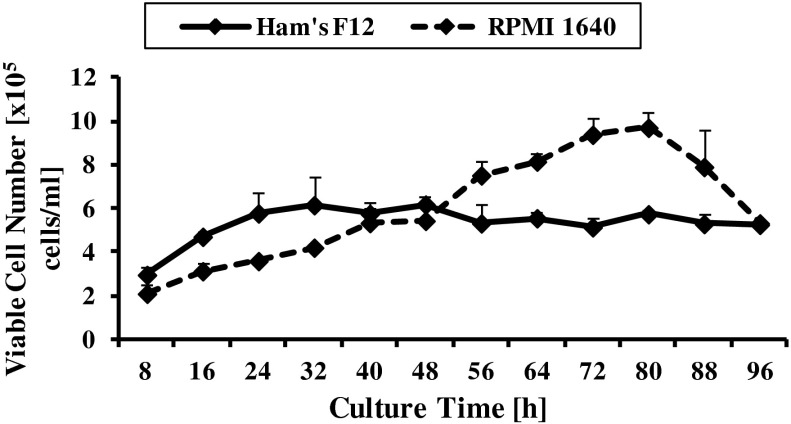
Figure 1 shows that CHO-K1 reached higher viable cell density when cultured in RPMI 1640 (9.70 × 10⁵ cells/ml) as compared to Ham’s F-12 (6.18 × 10⁵cells/ml). However, CHO-K1 cells cultured in Ham’s F12 reached the highest cell density point at 48 h which is earlier than RPMI 1640 (at 80 h). Lag phase was absence in both media. Meanwhile, CHO-K1 cells cultured in RPMI 1640 growth medium entered death phase after it achieved the highest saturation density but cells cultured in Ham’s F12 was maintained at stationary phase as early as 48 h with no apparent death phase.
Fig. 1.
Viable cell density (cells/ml) of CHO-K1 grown in Ham’s F12 and RPMI 1640
Biochemical/standard analysis
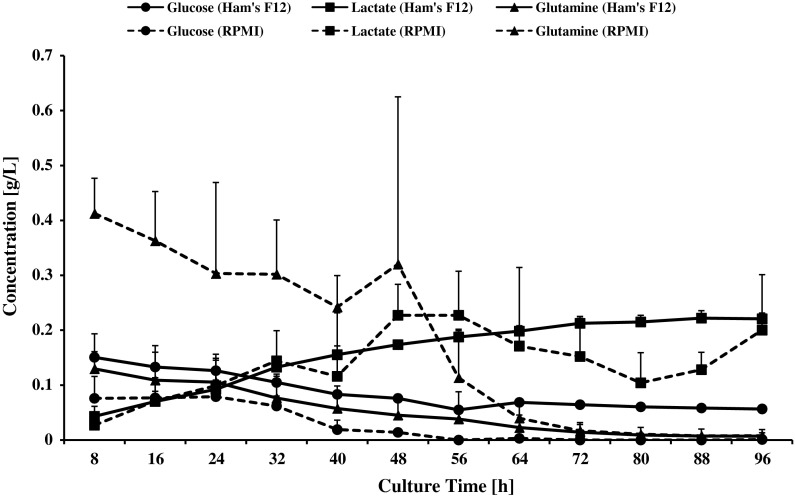
The initial concentration (0 h) of glucose was 1.806 g/l in Ham’s F12 growth medium and 2 g/l in RPMI 1640, respectively (Fig. 2). Meanwhile, the initial concentration (0 h) of glutamine was 0.146 g/l (1 mM) in Ham’s F12 and 0.3 g/l (2 mM) in RPMI 1640. The concentration of glucose and glutamine of CHO-K1 cell culture in both types of media decreased as time progressed. However, at the end of the culture time, there were remaining glucose and glutamine in Ham’s F12. Glucose and glutamine were totally consumed after 72 h in RPMI 1640. Lactate concentration was increased to 0.25 g/l in Ham’s F12 medium and 0.30 g/l in RPMI 1640 medium at the end of cell growth. From Table 1, it can be seen that CHO-K1 cells cultured in RPMI 1640 medium have higher rate of glucose consumption, glutamine consumption and lactate production compared to CHO-K1 cells cultured in Ham’s F12. However, the pattern of glucose consumption was similar for both cultures where the highest consumption was achieved during medium exponential phase (between 24 and 64 h of culture time). The rate of glutamine consumption and lactate production in RPMI 1640 medium were the highest at the mid exponential phase which was between 40 and 64 h.
Fig. 2.
Concentration of glucose, glutamine and lactate [g/l] in Ham’s F12 and RPMI 1640
Table 1.
Biochemical analysis of CHO-K1 cells cultured in Ham’s F12 and RPMI 1640 media, respectively
| Biochemical analysis | Ham’s F12 | RPMI 1640 |
|---|---|---|
| Viable cell density (cells/ml) | 2.0 × 10⁵–6.18 × 10⁵ | 2.0 × 10⁵–9.70 × 10⁵ |
| Specific growth rate (d−1) | 0.713 | 0.681 |
| Doubling time, tD (d) | 0.972 | 1.102 |
| Glucose concentration (g/L) | 0.06–0.15 | 0.00–0.08 |
| Glutamine concentration (g/L) | 0.01–0.13 | 0.01–0.41 |
| Lactate concentration (g/L) | 0.04–0.22 | 0.03–0.23 |
| IGF-1 concentration (pg/ml) | 28.98–29.87 | 29.03–31.56 |
| Biomass concentration (g/L) | 0.40–1.10 | 0.10–1.05 |
| qGlc (g/h) | 0.18 | 0.64 |
| qGln (g/h) | 0.28 | 0.30 |
| qLac (g/h) | 0.21 | 0.54 |
| qIGF-1 (pg/h) | 0.32 | 1.37 |
Concentration of IGF-1 protein
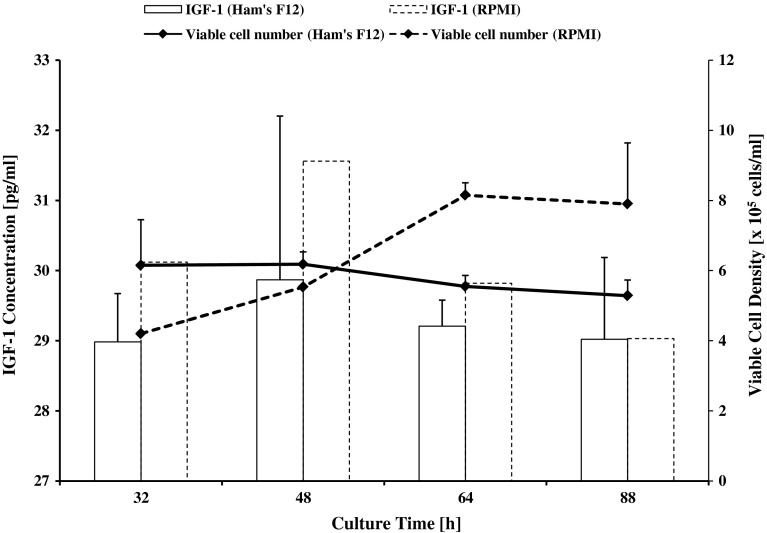
From Fig. 3, the highest expression of IGF-1 protein in RPMI 1640 was 31.56 pg/ml while in Ham's F12, the highest expression was 29.87 pg/ml. For RPMI 1640, IGF-1 protein expression achieved the highest level (at 48 h) even before CHO-K1 achieved the saturation density. The IGF-1 protein concentration then decreased after the saturation density point had been obtained. However, production of IGF-1 at different time points in Ham’s 12 did not differ much. It is noteworthy that the highest production in Ham’s F12 was also achieved at 48 h where cells were in stationary phase.
Fig. 3.
IGF-1 concentration [pg/ml] in Ham’s F12 and RPMI 1640
Gas chromatography mass spectrometry (GCMS) analysis
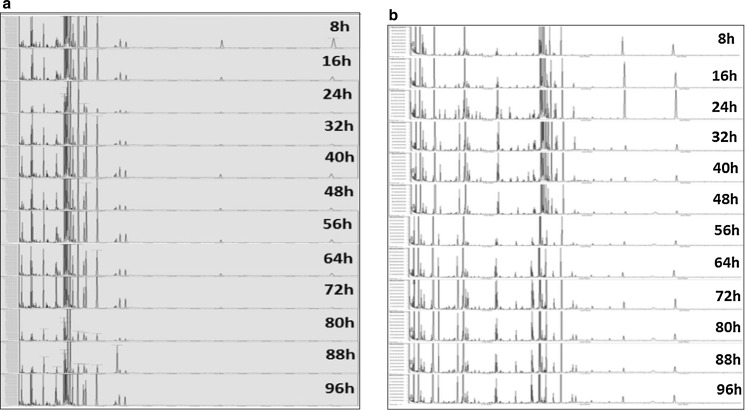
Figure 4 shows the spectra of global metabolite analysis of a representative batch of CHO-K1 cultured in Ham’s F12 (Fig. 4 a) and RPMI 1640 (Fig. 4b) and at different growth phases. According to the respective media used, each phase revealed similar metabolites but with different abundance. The results from our study showed that each phase throughout the growth period revealed similar metabolites but at different abundance whereas the study by Allen et al. (2003) showed that a small number of metabolites was revealed at initial phase of growth but the number of different metabolites increased in the later phase of growth.
Fig. 4.
Mass spectra of a representative batch of CHO-K1 cells cultured in a Ham’s F12 and b RPMI 1640
Multivariate data analysis
Figure 5a is the principle component analysis (PCA) score plot of the CHO-K1 cells cultured in Ham’s F12 and RPMI 1640 media respectively. PCA reduced the dimensionality of data while retaining the characteristics of the dataset that contribute most to its variance. In general, RPMI 1640 samples were more clustered while Ham’s F12 samples were distributed across the quadrants. It was observed that the samples of the early phases of CHO-K1 cells grown in Ham’s F12 (Ham’s008a, Ham’s008b) and RPMI 1640 (RPMI008b, RPMI016b) were in the same quadrant although they are not clustered together (see upper right quadrant of Fig. 5a). Referring to the loading scatter plot (Fig. 5b), it can be suggested that most of the metabolites (Table 2) at this phase came from the growth medium compositions (see upper right quadrant of Fig. 5b). At this early phase of growth, the cells were adapting to their environment and less metabolism occur. Samples from the upper quadrants are those from the exponential phase while the lower quadrants consist of samples from RPMI (death phase) or Ham’s (stationary phase). Based on abundance of metabolites, different metabolites appeared to be separating the different types of growth media with a confounding factor of different phases of growth. As seen in Fig. 5, the first component (PC1) at t[1] (types of media) is the direction of the highest variance of 15 % whereas the second component (PC2) at t[2] (growth phases) is in the direction of highest variance of 8 % from the first component in all orthogonal directions.
Fig. 5.
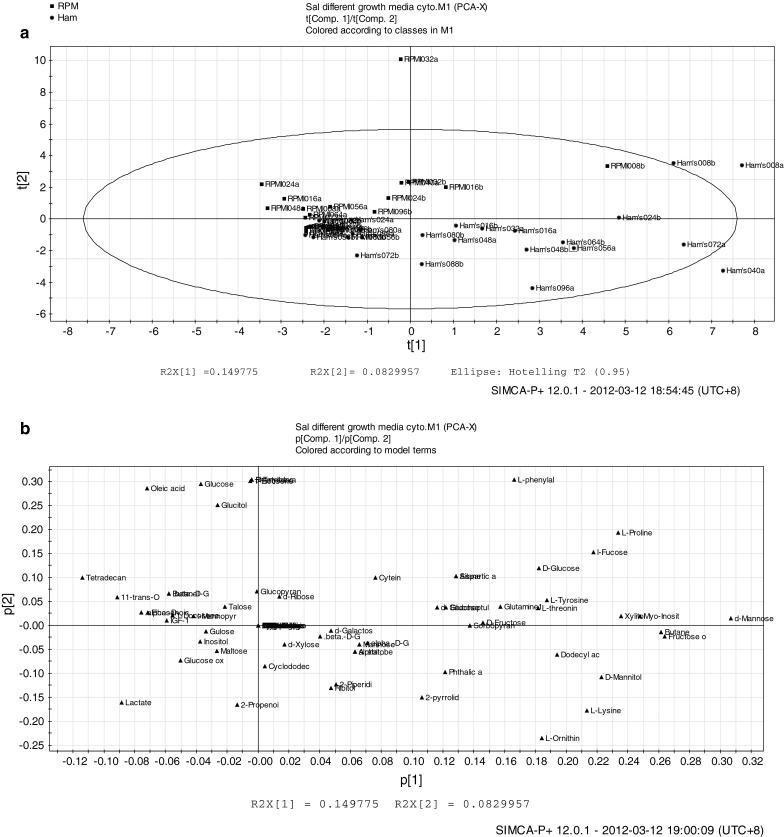
Principal component analysis. (a) The score scatter plot (b) The score loading plot of CHO-K1 cells cultured in Ham’s F12 and RMPI 1640 respectively
Table 2.
List of metabolites of CHO-K1 cells cultured in Ham’s F12 and RPMI 1640 (PCAanalysis)
| Analysis | Upper right quadrant |
Upper left quadrant |
Bottom right quadrant |
Bottom left quadrant |
|
|---|---|---|---|---|---|
| PCA | Types of growth media and phases in quadrant | Ham’s F12: Exponential phase RPMI 1640: |
RPMI 1640: Exponential phase |
Ham’s F12: Stationary phase |
RPMI 1640: Death phase |
| Early exponential phase | |||||
| List of metabolites | Aspartic acid | Asparagine | d-xylose | Gulose | |
| l-phenylalanine | Glucitol | Cyclododecane | Inositol | ||
| l-proline | Oleic acid | 2-piperidine | Maltose | ||
| l-tyrosine | Tetradecan | Ribitol | 2-propenoic acid | ||
| l-threonine | Talose | Phthalic acid | l-lysine | ||
| d-glucose | Glucopyranose | Mannose | Phtalic acid | ||
| d-fructose | l-Mannopyranose | Alpha-d-galactopyranose | D-galactose | ||
| d-mannose | d-ribose | Sorbopyranose | d-Mannitol | ||
| d-ribose | Fructose carboxylic acid | l-Ornithine | |||
| l-fucose | Glucosea | Lactatea | |||
| Cyteine | IGF-1b | ||||
| Xylitol | |||||
| Myo inositol | |||||
| Sedoheptulose | |||||
| Glutaminea |
aMetabolite analyzed by YSI 2700
bMetabolite analyzed by ELISA kit (R&D Systems, Inc.)
Discussion
An efficient mammalian cell culture system for producing bioproducts should retain high cell viability and efficient use of energy sources rendering the need to understand the effects of various variables on the cell system. Since CHO cell line is an important producer cell line, characterization and understanding of the cell line metabolism is crucial to achieve an ideal production system. For instance, Quek et al. (2010) characterized CHO cells as having high rates of glycolysis and glutaminolysis.
Nutritional control is one of the strategies used to achieve high cell viability and culture longevity of producer cells; which are proportional to protein productivity (Kumar et al. 2007). Earlier studies have been focused on substitution of glucose and glutamine with other sources like galactose and glutamate, respectively; as well as other feeding strategies related to these carbon sources (Altamirano et al. 2000, 2001, 2004). While these approaches have aided in understanding and improvement of CHO cell culture system, the more recent metabolomics techniques have increasingly being used to investigate other metabolites (beyond the routine measurement of glucose, glutamine and lactate) potential for better understanding of the culture system. For example, a liquid chromatography mass spectrometry (LCMS) based study found that acetylphenylalanine and dimethylarginine accumulate when CHO fed-batch culture entered stationary phase, which corresponds to their detrimental effect to cell growth (Chong et al. 2009). Later, the same group reported that aspartate supplied in the medium formulation resulted in malate efflux leading to higher cell density and improved product titer of the culture system in study (Chong et al. 2010).
In this study, metabolomics or global metabolite analysis approach is applied to identify metabolite profiles or bio-signatures that can be used to characterize metabolic processes in a simple batch culture of CHO-K1 cells grown in different types of media. Spent media were collected and analyzed using gas chromatography mass spectrometry at designated time points. The spent media contain extracellular metabolites which may exist into the media supplied as well as released by cells in culture as growth progressed. Based on the results, it can be seen that using cell counting and common biochemical measurement, CHO-K1 cells cultured in different media showed different behaviour. Cells appeared to use more glucose and glutamine when cultured in RPMI as compared to Ham’s F12 medium. The cells in the former medium finished consuming these sources which became exhausted between 56 to 72 h (late exponential phase) although the medium contains higher glutamine than Ham’s F12 medium (see Fig. 2). Specific rates and yields calculated for these metabolites (Table 1) also showed differences between the two culture systems. However, to this end, these common analyses can only provide descriptive information with a tendency for speculative explanation. Although the data are vital for preliminary information for the system in study, they are very limited in terms of giving insights of CHO metabolism when cultured in different media.
In comparison, using PCA it can be seen that the culture was clearly separated based on growth media with growth phases as confounding factor (Fig. 5). In relation to protein production, RPMI gave higher Insulin like growth factor-1 (IGF-1) protein levels as compared to Ham’s F12 medium. In the RPMI medium, IGF-1 reached the highest production at 48 h (exponential phase). Although the highest production in Ham’s medium was also reached at 48 h, cells were already in the stationary phase. To this end, it can be suggested that nutrients in RPMI, particularly glutamine has a positive interaction with the CHO-K1 system to produce higher IGF-1 concentration. RPMI 1640 is a standard basal formulation enriched with additional nutrients that are normal constituents of serum, enabling reduction in fetal bovine serum (FBS) supplementation by 50–90 %, with little or no change in cell growth, promotion, morphology, or function (Hinger et al. 1989).
In the RPMI culture, cells actively consumed glutamine starting from the early exponential phase indicating high glutaminolysis activities of CHO cells as suggested by Quek et al. (2010). The active glutaminolysis activity during this phase may correlate with the channeling of energy for production of protein of interest as well as being indicative for healthiness of cells. In particular, asparagine was found to be clustered with IGF-1 in the RPMI exponential phase of the RPMI cultures, indicating the metabolite as a potential cue to the IGF-1 production as well as indicator for healthiness of cells. Asparagine can be derived from glutamine catalyzed by asparagine synthethase enzyme (Wishart et al. 2009).
A group of sugars (glucitol, talose, glucopyranose, mannopyranose, ribose and fructose) were also found to be clustered with IGF-1 during the exponential phase of RPMI culture. This showed that while glucose was diminishing, the system still have other alternatives of substrates to be used in glycolysis. CHO cells possess the glutamine-synthethase gene (GS gene), thus are able to produce its own glutamine (Zhang et al. 2006). However, this may not be sufficient to sustain the culture for production of IGF-1, hence a fed-batch system may be recommended for production of IGF-1 protein where medium is directly replenished with glutamine just after harvesting the IGF-1.
Meanwhile, several metabolites found in the death phase (of RPMI culture) were found to be associated with apoptosis and excess of nutrients in the supplied medium. Ornithine, an amino acid produced in the urea cycle by splitting of urea from arginine (Wishart et al. 2009) has been reported to have apoptotic properties (Tobias and Kahana 1995). Previously, arginine has also been reported to be in excess supply in culture media leading to accumulation of apoptosis induction by dimethylyarginine (Chong et al. 2009). In this study, lysine was also found in the death phase, suggesting an over-supply of this essential amino acid. Lysine is a product of glutamic acid, which is also supplied in the RPMI formulation. As such, the information from metabolomics study combined with data from common biochemical analysis and existing literature illustrates the usefulness of the former technique as complementary for improvement of medium formulation by omitting unncessary nutrients leading to cost reduction.
Conclusion
Cellular metabolism has been reported to affect specific product yield, generation of undesirable by-products and the correctness of post-translational modification (Cartwright 1994). In this study, metabolomics analysis has shown that different growth media have different effects on growth behavior even with the presence of different growth phases as confounding factor. Different types of media also appeared to affect IGF-1 production. Using the biomarkers revealed in the study, several bioprocessing strategies including medium improvement and in time downstream processing can be potentially implemented to achieve efficient CHO culture system. Nevertheless, more detailed studies are warranted to confirm and complement the existing information.
Acknowledgments
This research was funded by IIUM Research Matching Grant Scheme (RMGS). We would like to thank everyone who contributed to the research on effects of different types of growth media on metabolites profile of CHO-K1 cells.
References
- Allen J, Davey HM, Broadhurst D, Heald JK, Rowland JJ, Oliver SG, Kell DB. High- throughput classification of yeast mutants for functional genomics using metabolic footprinting. Nat Biotech. 2003;21:692–696. doi: 10.1038/nbt823. [DOI] [PubMed] [Google Scholar]
- Altamirano C, Paredes C, Cairo JJ, Godia FF. Improvement of CHO cell culture medium formulation: simultaneous substitution of glucose and glutamine. Biotechnol Prog. 2000;16:69–75. doi: 10.1021/bp990124j. [DOI] [PubMed] [Google Scholar]
- Altamirano C, Cairo JJ, Godia F. Decoupling growth and product formation in Chinese hamster ovary cells through metabolic control. Biotechnol Bioeng. 2001;76:351–360. doi: 10.1002/bit.10096. [DOI] [PubMed] [Google Scholar]
- Altamirano C, Paredes C, Illanes A, Cairo JJ, Godia F. Strategies for fed-batch cultivation of t-PA producing CHO cells: substitution of glucose and glutamine and rational design of culture medium. J Biotechnol. 2004;110:171–179. doi: 10.1016/j.jbiotec.2004.02.004. [DOI] [PubMed] [Google Scholar]
- Bradley SA, Ouyang A, Purdie J, Smitka TA, Wang T, Kaerner A. Fermentanomics: monitoring mammalian cell cultures with NMR spectroscopy. J Am Chem Soc. 2010;132:9531–9533. doi: 10.1021/ja101962c. [DOI] [PubMed] [Google Scholar]
- Cartwright T. Animal Cells as Bioreactors. Cambridge: Cambridge University Press; 1994. [Google Scholar]
- Chong WPK, Goh LT, Reddy SG, Yusufi FNK, Lee DY, Wong NSC, Chew KH, Yap MGS, Ying SH. Metabolomics profiling of extracellular metabolites in recombinant Chinese Hamster Ovary fed-batch culture. Rapid Commun Mass Spectrometry. 2009;23:3763–3771. doi: 10.1002/rcm.4328. [DOI] [PubMed] [Google Scholar]
- Chong WPK, Reddy ST, Yusufi FNK, Lee D-Y, Wong NSC, Chew KH, Yap MGS, Ying SH. Metabolomics-driven approach for the improvement of Chinese hamster ovary cell growth: overexpression of malate dehydrogenase II. J Biotechnology. 2010;147:116–121. doi: 10.1016/j.jbiotec.2010.03.018. [DOI] [PubMed] [Google Scholar]
- Dippel B (2011) http://www.raman.de/htmlEN/home/advantageEn.html. Accessed 25 September 2012
- Fernandez C, Fransson U, Hallgard E, Spegel P, Holm C, Krogh M, Warell K, James P, Mulder H (2008) Metabolomic and Proteomic Analysis of a Clonal Insulin-Producing β-Cell Line (INS-1 832/13) J Proteome Res 7:400–411 [DOI] [PubMed]
- Filipiak W, Sponring A, Filipiak A, Clemens A, Schubert J, Miekisch W, Amann A, Troppmair J. TD-GC MS analysis of volatile metabolites in human lung cancer and normal cells in vitro. Cancer Epidemiol Biomarkers. 2010;19:182–195. doi: 10.1158/1055-9965.EPI-09-0162. [DOI] [PubMed] [Google Scholar]
- Gibney M. Metabolomics in human nutrition: opportunities and challenges. J Clin Nutr. 2005;82:497–503. doi: 10.1093/ajcn.82.3.497. [DOI] [PubMed] [Google Scholar]
- Goodacre R, Seetharaman V, Dunn WB, Harrigan GG, Kell DB. Metabolomics by numbers: acquiring and understanding global metabolite data. Review. Trends Biotechnol. 2004;22:245–252. doi: 10.1016/j.tibtech.2004.03.007. [DOI] [PubMed] [Google Scholar]
- Griffin JL. Metabonomics: NMR spectroscopy and pattern recognition analysis of body fluids and tissues for characterisation of xenobiotic toxicity and disease diagnosis. Curr Opin Chem Biol. 2003;7:648–654. doi: 10.1016/j.cbpa.2003.08.008. [DOI] [PubMed] [Google Scholar]
- Hinger S, Reiter M, Gaida T, Kral G, Gruber G, Weigang F, Katinger H (1989) Cultivation of hybridomas producing IgG at low serum concentration. Cytotechnology 2(Suppl):78–79
- Khoo SHG, Al-Rubeai M. Metabolomics as a complementary tool in cell culture. Biotechnol App Biochem. 2007;47:71–84. doi: 10.1042/BA20060221. [DOI] [PubMed] [Google Scholar]
- Kumar N, Gammell P, Clynes M. Proliferation control strategies to improve productivity and survival during CHO based production culture. Cytotechnology. 2007;53:33–46. doi: 10.1007/s10616-007-9047-6. [DOI] [PMC free article] [PubMed] [Google Scholar]
- Kuystermans D, Krampe B, Swiderek H, Al-Rubeai M. Using cell engineering and omic tools for the improvement of cell culture processes. Cytotechnology. 2007;53:3–22. doi: 10.1007/s10616-007-9055-6. [DOI] [PMC free article] [PubMed] [Google Scholar]
- Lindon JC, Nicholson JK, Holmes E. The handbook of metabonomics and metabolomics. Amsterdam: Elsevier; 2006. [Google Scholar]
- Pope GA, Mackenzie DA, Defernez M, Aroso MAAM, Fuller LJ, Mellon FA, Dunn WB, Brown M, Goodacre R, Kell DB, Marvin ME, Louis EJ, Roberts IN. Metabolic footprinting as a tool for discriminating between brewing yeasts. Yeast. 2007;24:667–679. doi: 10.1002/yea.1499. [DOI] [PubMed] [Google Scholar]
- Quek LE, Dietmair S, Kromer JO, Nielsen LK. Metabolic flux analysis in mammalian cell culture. Metab Eng. 2010;12:161–171. doi: 10.1016/j.ymben.2009.09.002. [DOI] [PubMed] [Google Scholar]
- Silas GVB, Sandrine M, Mats A, Jorn S, Jens N. Mass spectrometry in metabolome analysis. Mass Spectrometry Rev. 2005;24:613–646. doi: 10.1002/mas.20032. [DOI] [PubMed] [Google Scholar]
- Takeda S, Sim PG, Horrobin DF, Sanford T, Chisholm KA, Simmons V (1993) Mechanism of lipid peroxidation in cancer cells in response to gamma-linolenic acid (GLA) analyzed by GC-MS(I): conjugated dienes with peroxyl (or hydroperoxyl) groups and cell-killing effects. Anticancer Res 13:193–199 [PubMed]
- Tobias KE, Kahana C (1995) Exposure to ornithine results in excessive accumulation putrescine and apoptotic cell death in ornithine decarboxylase overproducing mouse myeloma cells. Cell Growth Differ 6:1279–1285 [PubMed]
- Wishart DS, Knox C, Guo AC, et al. HMDB: a knowledgebase for the human metabolome. Nucleic Acids Res. 2009;37:D603–D610. doi: 10.1093/nar/gkn810. [DOI] [PMC free article] [PubMed] [Google Scholar]
- Zhang F, Sun X, Yi X, Zhang Y. Metabolic characteristics of recombinant Chinese hamster ovary cells expressing glutamine synthetase in presence and absence of glutamine. Cytotechnology. 2006;51:21–28. doi: 10.1007/s10616-006-9010-y. [DOI] [PMC free article] [PubMed] [Google Scholar]


