

Abstract
Purpose
To analyze the structure and visual function of regions bordering the hyperautofluorescent ring/arcs in retinitis pigmentosa (RP).
Methods
Twenty -one RP patients (21 eyes) with rings/arcs and 21 normals (21 eyes) were studied. Visual sensitivity in the central 10° was measured with microperimetry. Retinal structure was evaluated with spectral domain optical coherence tomography (SD-OCT). The distance from the fovea to disruption/loss of the inner outer segment (IS/OS) junction and thicknesses of the total receptor plus retinal pigment epithelial (RPE) complex (R+), and outer segment plus RPE complex (OS+) layers were measured. Results were compared to measurements of the distance from the fovea to the inner and outer borders of the ring/arc seen on fundus autofluorescence (FAF).
Results
Disruption/loss of the IS/OS junction occurred closer to the inner border of the ring/arc and it was closer to the fovea in 8 eyes. For 19 eyes, OS+ and R+ thicknesses were significantly decreased at locations closer to the fovea than the appearance of the inner border of hyperautofluorescence. Mean visual sensitivity was decreased inside, across and outside the ring/arc by 3.5 ± 3.8, 8.9 ± 4.8 and 17.0±2.4 dB respectively.
Conclusions
Structural and functional changes can occur inside the hyperfluorescent ring/arc in RP.
Keywords: retinititis pigmentosa, optical coherence tomography, fundus autofluorescence, microperimetry
Retinitis pigmentosa (RP) is a group of retinal degenerative diseases that are genetically heterogeneous and characterized by an association of progressive loss of visual sensitivity and photoreceptors.1,2 The loss typically starts in the peripheral retina and progresses towards the fovea. With the possibility of future therapeutic interventions for RP, it has become increasingly important to be able to differentiate between “healthy, functional” and “unhealthy, dysfunctional” retinal areas and to understand the changes that occur in structure and function across these areas. Spectral-domain optical coherence tomography (SD-OCT) has recently been used to study changes in retinal structure in vivo in this transition zone.3,4 Fundus autofluorescence (FAF), a non-invasive imaging technique, offers another approach for differentiating between these areas.5,6 Increased FAF in the form of arcs or rings has recently been described in retinal dystrophies.7,8 The arcs or rings are often present in RP patients, but are not apparent on conventional funduscopic examinations. The increased FAF is associated with disruption of the inner/outer segment junction and a decrease in outer retinal thickness on SD-OCT.9 The high-density rings are also reported to be correlated with electrophysiological and psychophysical measures of retinal function.10 It has recently been suggested that there is constriction of ring over time and that the rate of constriction may prove to be a useful surrogate measure of progression for clinical trials.11 The origins of the FAF signal, however, remain uncertain. It was thought that the signal originated from an abnormal accumulation of lipofuscin in the retinal pigment epithelium (RPE) due to an increased outer segment dysgenesis.9,10 But recent studies of a variety of retinal diseases have shown that the pattern of FAF reflects not only lipofuscin distribution in the RPE but also other fluorophores in the photoreceptor layer.12,13 In addition, Sparrow et al.,14 have proposed that photoreceptor cell dysfunction, such as in RP, can lead to impaired handling of vitamin A aldehyde, resulting in excessive production of bisretinoid fluorophores in photoreceptor cells such that these cells become an abnormal, yet chief source of, fundus autofluorescence.
The purpose of this study is to provide a quantitative analysis of the structural basis of the high-density autofluorescent ring or arc and its borders and associated visual function in a genetically heterogeneous group of RP patients. This analysis may increase our understanding of the progression of changes that occurs on going from healthy to unhealthy retinal areas, as well as provide additional insight into the origins of the FAF signal in RP patients.
Methods
Subjects
This cross-sectional study included 21 eyes of 21 patients with a clinical diagnosis of RP and hyperautofluorescent rings or arcs on FAF, and 21 eyes of 21 control subjects. The control subjects ranged in age from 11 to 65 years; had visual acuity of 20/20 or better; and did not have other ocular or systemic diseases. The patients (14 males, 7 females) ranged in age from 10 to 59 years with a mean age of 35.2±16.7 yrs. Their ages were not significantly different from that of the normal controls (39.1±14.4 yrs). The diagnosis of RP was based on the appearance of the fundus, clinical history, visual fields, and full-field electroretinogram results. Best-corrected visual acuity for the patients ranged from 20/20 to 20/40 (logMAR 0.0 to 0.3). All tested eyes had visual field diameters ≥10°. Eyes were excluded if they had a refractive error greater than +/− 6.0 diopters spherical or +/−2.0 diopters cylindrical, evidence of macular cysts, an epiretinal membrane, significant cataract, and evidence or a history of other ocular diseases (e.g. glaucoma, diabetes).
All procedures adhered to the tenets of the Declaration of Helsinki and written informed consent was obtained from all subjects after a full explanation of the procedures was provided. The protocol was approved by the Institutional Review Board of Columbia University.
All patients were screened for genetic mutations. Eight patients had autosomal dominant RP, 9 autosomal recessive RP and 4 had Usher syndrome type II. Patient 1 had the E3088K mutation, patient 6 the G713R mutation, and patient 21 the T3571M mutation in USH2A. Patients 10,11 and 12 had the D190N mutation in RHO (see Table 1 for details).
Table 1.
Clinical Characteristics
| Patient | Inheritance Diagnosis |
Age | VA logMAR |
|---|---|---|---|
| 1 | AR USH2A, E3088K | 59 | 0.0 |
| 2 | AR | 50 | 0.1 |
| 3 | AD | 35 | 0.0 |
| 4 | AR | 52 | 0.0 |
| 5 | Usher syndrome type II | 35 | 0.1 |
| 6 | AR USH2A,G713R | 38 | 0.3 |
| 7 | AR | 55 | 0.1 |
| 8 | Usher syndrome type II | 20 | 0.3 |
| 9 | AR | 29 | 0.1 |
| 10 | AD RHO,D19ON | 50 | 0.0 |
| 11 | AD RHO, D19ON | 14 | 0.0 |
| 12 | AD RHO, D19ON | 10 | 0.0 |
| 13 | AD | 29 | 0.0 |
| 14 | AD | 47 | 0.0 |
| 15 | AD | 48 | 0.1 |
| 16 | AD | 17 | 0.0 |
| 17 | AR | 20 | 0.0 |
| 18 | AR | 59 | 0.0 |
| 19 | Usher syndrome type II | 13 | 0.0 |
| 20 | Usher syndrome type II | 14 | 0.1 |
| 21 | AR USH2A,T3571M | 45 | 0.0 |
Abbreviations: VA, visual acuity; AR: autosomal recessive; AD: autosomal dominant.
Fundus autofluorescence
FAF imaging was performed with a confocal scanning laser ophthalmoscope (HRA2; Heidelberg Engineering, Dossenheim, Germany) after pupil dilation with topical 0.5% tropicamide and 2.5% phenylephrine. Standard procedure was followed for the acquisition of FAF images, including focusing of the retinal image and adjusting the sensitivity at 488 nm before acquiring 9 consecutive 30°×30°(768×768 pixels) FAF images encompassing the entire macular area with at least a portion of the optic disc. The 9 single images were automatically averaged to compute a single frame with improved signal-to-noise ratio.
The external and internal boundaries of the hyperautofluorescent ring, or arc along the horizontal and vertical axes, were defined as the visible limits seen on the FAF images. Using Adobe Photoshop software, two of the authors (VG and TD) independently measured the distance from the fovea along the horizontal and vertical midlines to the internal and external boundaries, after appropriate scaling. These values were expressed in degrees and mm.
Spectral-domain optical coherence tomography
SD-OCT was obtained from all subjects using the Cirrus HD-OCT (Carl Zeiss Meditec Inc., Dublin, CA, USA). The acquisition protocol consisted of horizontal and vertical five-line raster scan patterns 6 mm in length with 0.25mm spacing (4096 A-scans per B-scan), and a macular cube 512×128 scan pattern covering a 6×6 mm region of the retina. After image acquisition, those with a signal strength ≤8 were excluded. The horizontal line scans with the highest signal strength centered on the fovea were chosen for thickness measurements using a previously described computer aided manual segmentation technique.15 The thicknesses of the total receptor plus RPE complex (R+; Bruch’s membrane to the border of the outer plexiform/inner nuclear layer OPL/INL), and outer segment plus RPE complex (OS+; Bruch’s membrane to the photoreceptor inner-outer segment junction IS/OS junction) were measured in all subjects. Figure 1A is a scan of the horizontal meridian of a normal retina showing the borders that were segmented. In addition the distance from the fovea along the horizontal midlines to the location of disorganization and/or disappearance of the hyper reflective band that represents the IS/OS junction on SD-OCT was measured independently by two of the authors (VG and TD) in mm and degrees using Adobe Photoshop software (see Fig. 1B).
Figure 1.
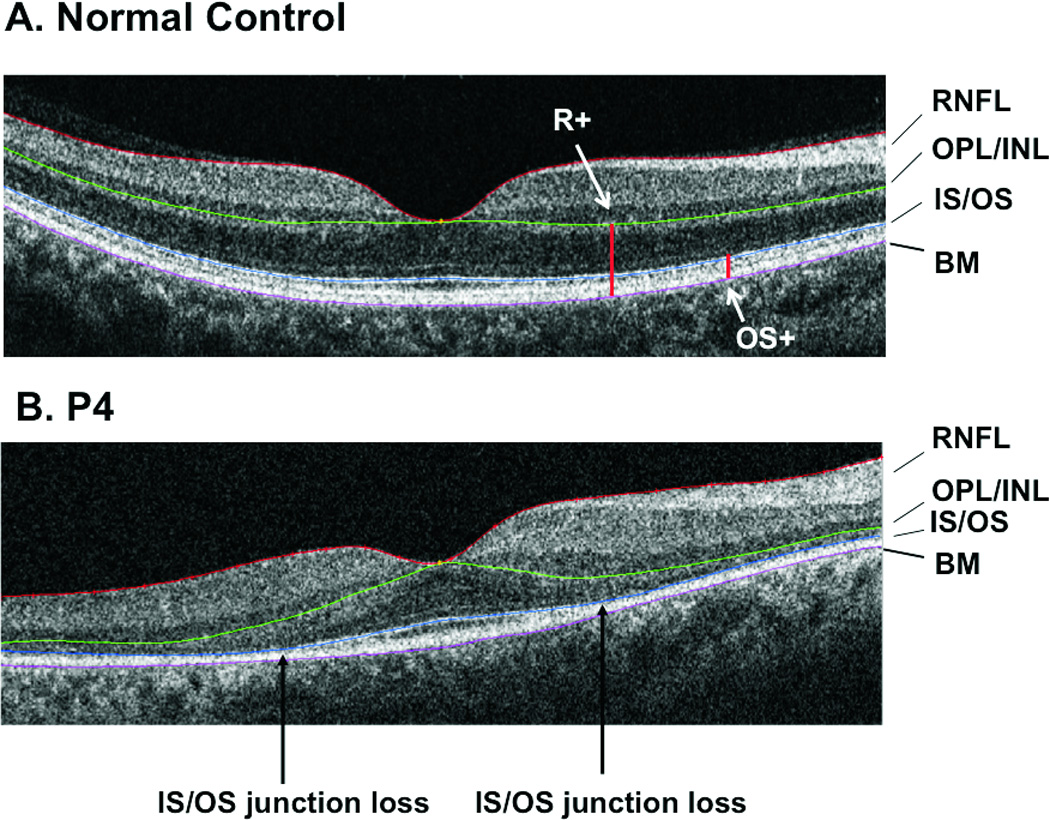
A. A SD-OCT scan of the horizontal meridian of a normal retina. The purple, blue and green lines indicate the borders that were segmented. B. A SD-OCT scan of the horizontal meridian of a retina of a patient with RP. As in 1A, the purple, blue and green lines indicate the borders that were segmented. The black vertical arrows indicate the locations of the IS/OS junction loss.
Microperimetry
Microperimetry was performed with the Nidek MP1 (NAVIS software version 1.7.2; Nidek Technologies, Padua, Italy). The MP-1 combines fundus tracking microperimetry with color fundus photography. All subjects were tested following pupil dilation with 0.5% tropicamide and 2.5% phenylephrine. Because of the low background luminance used for this test (1.27 cd/m2), this procedure was performed before FAF and SD-OCT and following 30 minutes of adaptation to dim room illumination. A 10–2 pattern similar to the Humphrey visual field 10–2 was used. This pattern has 68 test locations covering the central 20° with a grid of points 2° apart. “White” test lights (stimulus size Goldmann III, 200 ms in duration) were presented on a dim “white” background (1.27 cd/m2) using a 4–2 procedure. Subjects were asked to maintain fixation on a red cross (2° in diameter). The non-tested eye was occluded throughout the procedure.
The localized sensitivities for each patient were compared to the density of autofluorescence on his or her FAF image. The 30° AF images were imported from HRAII into the NAVIS software in the Nidek MP1 system and overlaid on the MP1 images using retinal vessel bifurcation as registration landmarks. The MP1 sensitivity values for the 21 eyes at 10 locations along the horizontal midline were calculated for each RP eye. For eyes in which the 10 locations did not fall on the mid-line, the values were interpolated. The differences in these visual sensitivity values compared to mean data for controls at each of the 10 locations were calculated. The means of these total deviation values were calculated for 3 regions: inside, across, and outside the ring or arc.
Results
FAF
All study eyes had a hyperautofluorescent ring/arc in the macular area on FAF. Figure 2 shows examples from 4 of the patients (P1, P4, P8 and P9). For P4 and P8, FAF is apparently normal outside the ring, whereas for P1 and P9 there are patches of decreased FAF. Of the 21 eyes, within a 20° diameter area, 12 had apparently normal FAF outside the ring/arc and 9 had patches of decreased FAF. Inside the ring apparently normal FAF was observed in all 21 eyes.
Figure 2.
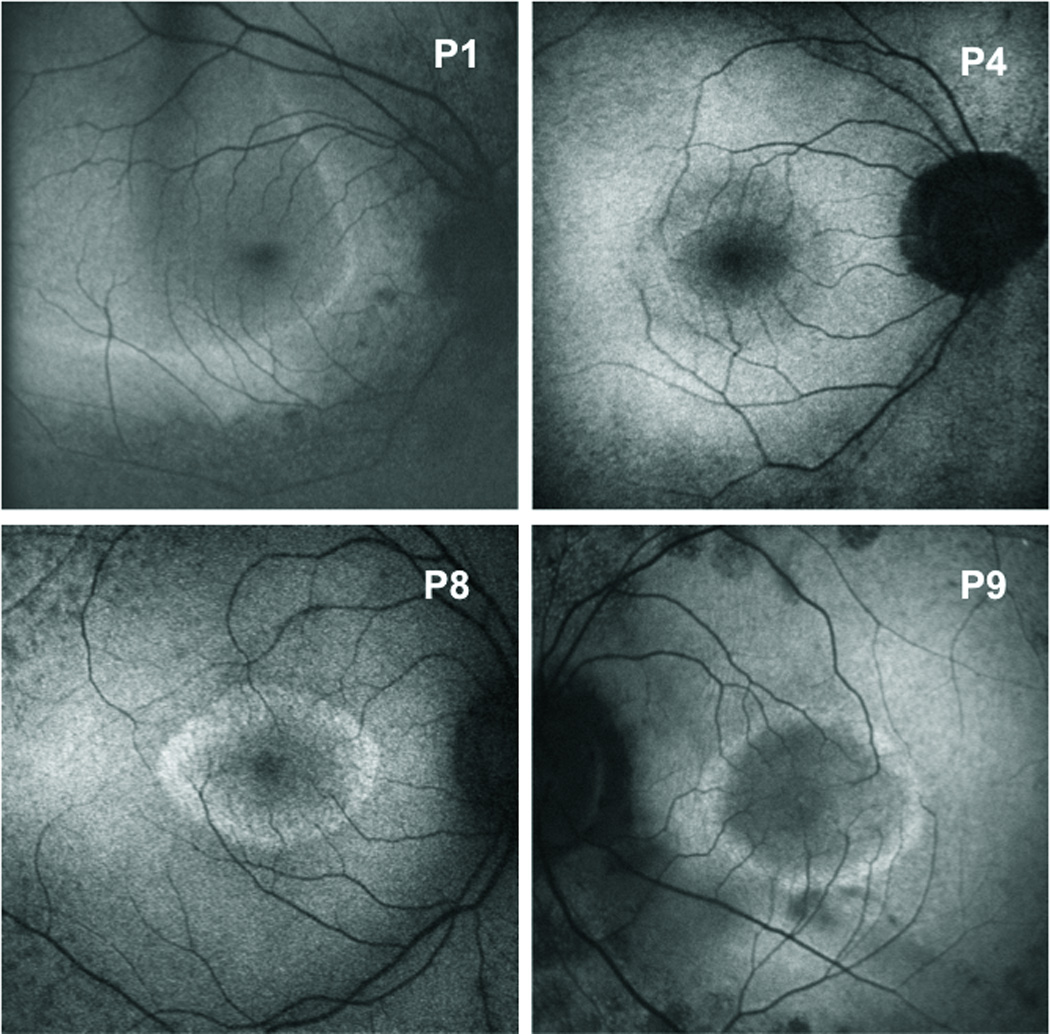
Fundus autofluorescence images showing variably sized perifoveal rings and an arc of hyperautofluorescence for Patients 1, 4, 8, and 9.
Fifteen eyes had rings and 6 had arcs. These rings/arcs varied in dimension and eccentricity from the fovea. The inner and outer borders were identified on the FAF images, and their distances or eccentricities from the fovea were measured along the nasal and temporal axes. The distance from the fovea to the inner border along the nasal axis ranged from 0.64 mm to 2.63 mm (mean 1.47±0.59) and from 0.72 mm to 3.87 mm along the temporal axis (mean 1.90±0.60). The distance from the fovea to the outer border along the nasal axis ranged from 1.34 mm to 2.9 mm (mean 1.65±0.83) and from 1.01 mm to 4.19 mm along the temporal axis (mean 2.42±1.02). Outer borders could not be identified along the nasal axis in 2 eyes or along the temporal axis in another 2 eyes.
SD-OCT and FAF
The hyperreflective band representing the IS/OS junction appeared to be intact across the foveal area in all eyes. At varying eccentricities from the fovea, disruption and/or loss of the IS/OS junction were observed. In 13 eyes a region of disruption preceded the loss of the IS/OS junction, whereas in 8 eyes there was a clearly defined break between preserved and absent IS/OS. The IS/OS junction approached the OS/retinal pigment epithelium (RPE) border and disappeared. Beyond this point, the OS/RPE border appeared to be intact in all eyes along the remainder of the 6 mm horizontal scan.
As our interest is in the retinal structure in the region of the high-density autofluorescent ring/arc, we tested the hypothesis that the IS/OS junction disruption and/or loss occurred closer to the inner, rather than the outer, border of the ring/arc on FAF. The distance from the fovea along the horizontal nasal and temporal axis to the initial appearance of disruption and/or disappearance of the IS/OS junction was measured as shown by the horizontal arrow in Fig. 3. This distance was subtracted from the measurements of the distance to the inner and outer borders (red and green vertical lines in Fig. 3, lower panel) described above. In this case, the difference between the distance to IS/OS junction loss on SD-OCT and to the inner border on FAF was −0.16 mm, and the difference to the outer border was −0.33 mm. (Negative values indicate that the disruption/disappearance occurred before the appearance of the border.) For the nasal horizontal axis, the difference between the distance to disruption/disappearance on SD-OCT and to the inner border on FAF ranged from −0.76 mm to 1.02 mm (mean −0.00 ± 0.47 mm, median −0.06 mm), and to the outer border from −1.71 mm to −0.31 mm (mean −0.62±0.40 mm, median −0.49 mm). For the temporal axis, the difference between the distance to disruption/disappearance on SD-OCT and to the inner border on FAF ranged from −0.93 mm to 0.92 mm (mean 0.01 ± 0.43 mm, median −0.05 mm), and to the outer border from −2.19 mm to 0.76 mm (mean −0.76±0.68 mm, median −0.76 mm). For both nasal and temporal retina there were no significant differences between the means for the inner border on FAF and the SD-OCT measurements, but differences between the means for the nasal and temporal outer border and the SD-OCT measurements were significant (paired t-test P<0.0001, P=0.0005). In summary the changes in IS/OS were associated with the inner rather than the outer border.
Figure 3.
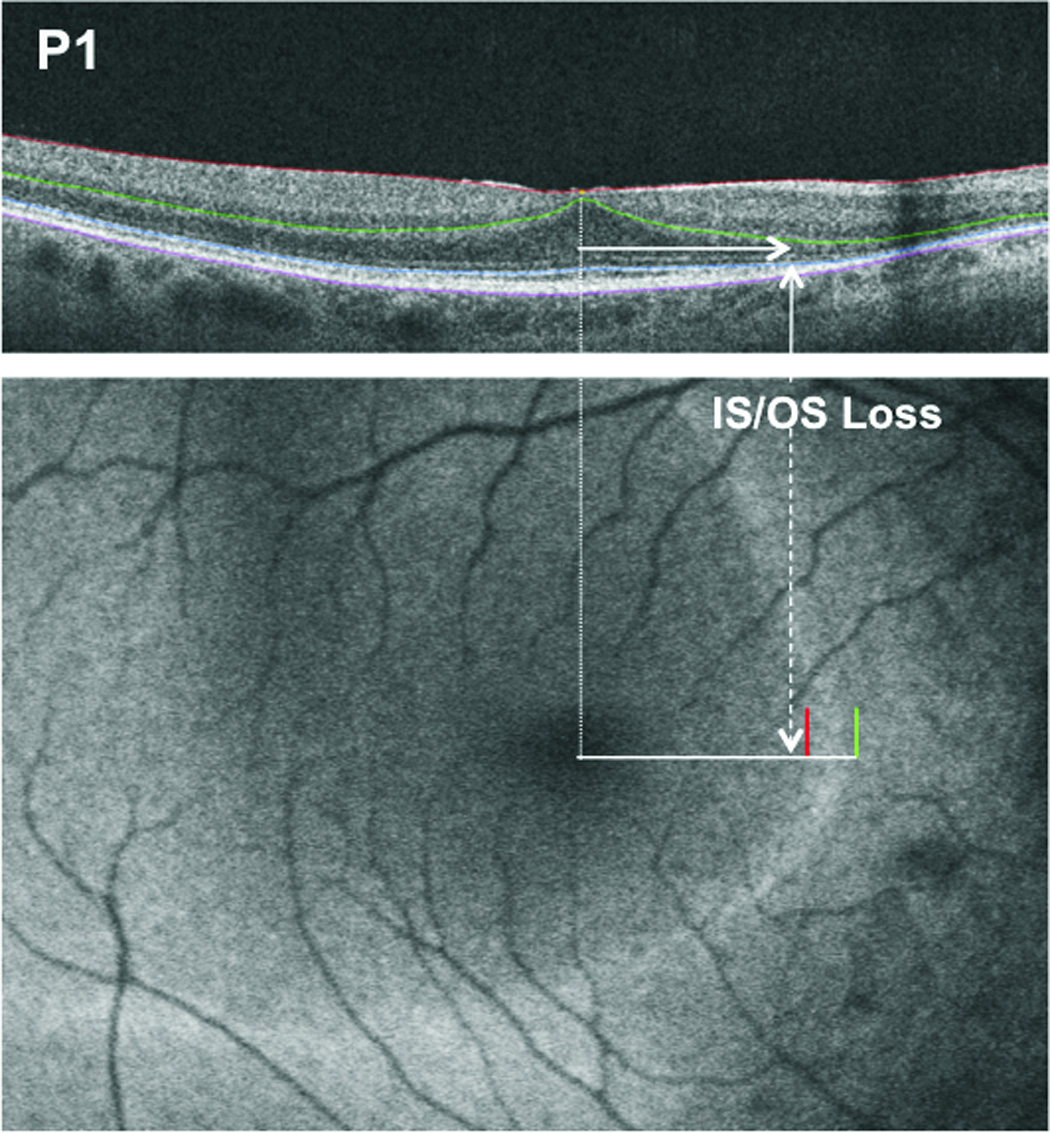
The upper panel shows a SD-OCT scan of the horizontal meridian of the retina for Patient P1. The horizontal arrow indicates the distance from the fovea to IS/OS junction loss. The lower panel shows the fundus autofluorescence image for the patient. The red and green lines indicate the positions of the inner and outer border of the hyperautofluorescent arc relative to the position of the IS/OS junction loss shown by the dashed white vertical arrow.
In addition to the measurements of the IS/OS junction, the thicknesses of the outer segment plus (OS+) and total receptor plus (R+) were measured as a function of distance from the fovea in mm and degrees (0.289 mm/°) along the horizontal meridian in the 21 RP eyes. The R+, and OS+ thickness profiles for the patients were compared to the mean ± 2SDs for normal controls (see Fig. 4A, B). The black curves are the mean (solid) ±2 SDs (dashed) for the group of 21 control eyes. In the foveal area (±1° indicated by the vertical lines in Fig. 4), the R+ and OS+ layer measurements were within normal limits for 17 and 15 patients respectively. Outside this central ±1° region, the values fell below 2SDs at various distances from the fovea depending upon the patient. There were two exceptions, P1 had normal R+ and OS+ measurements from the fovea along the temporal axis and P11 had normal values along the nasal axis.
Figure 4.
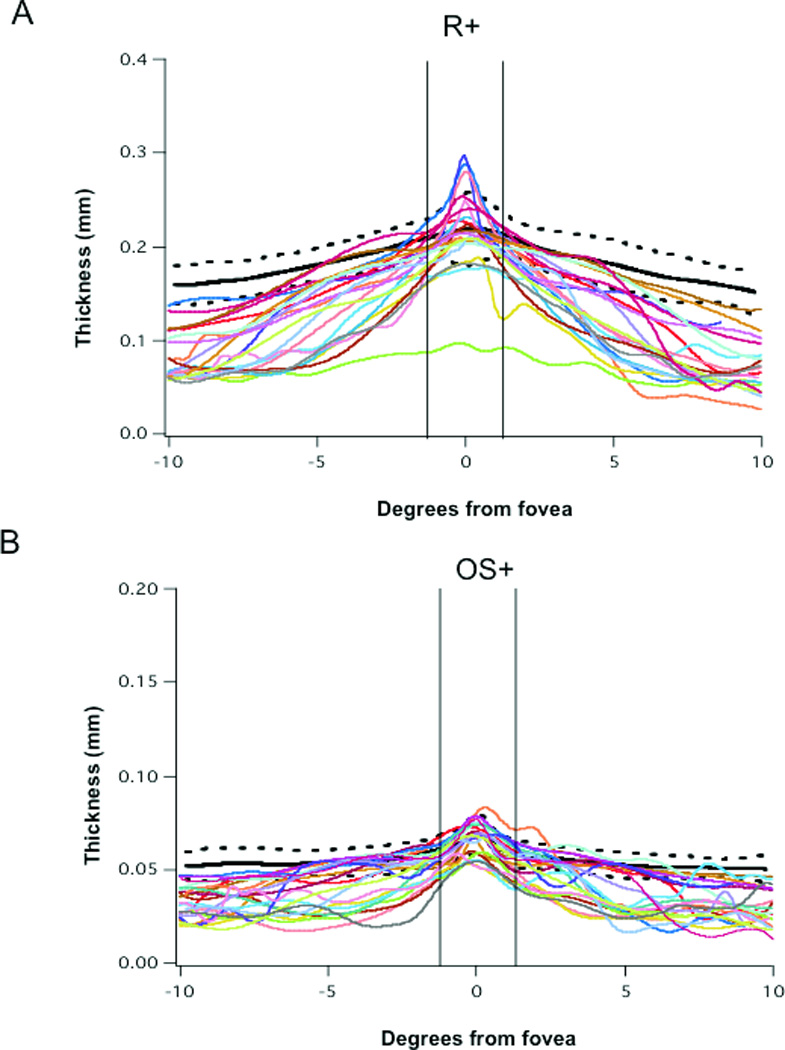
A. R+ thickness profiles across the retina for the scans through the horizontal meridian for 21 RP eyes and for the mean (bold black) and ±2SD (dashed black) of scans from 21 normal controls. B. OS+ thickness profiles of the retina for the scans through the horizontal meridian for 21 RP eyes and for the mean (bold black) and ±2SD (dashed black) of scans from 21 normal controls. The vertical lines represent +/− 1°; negative and positive degree values represent distances temporal and nasal to the fovea respectively.
The R+ and OS+ thickness profiles were then compared to the location of the inner and outer borders of the ring/arcs observed on FAF and to disruption/loss of the IS/OS junction. This is illustrated in Fig. 5A, which shows R+ (solid red) and OS+ (solid blue) thickness profiles for P6 compared to the mean – 2SDs for normal controls. The black curves represent the mean (solid) –2SDs (dashed) for the group of 21 control eyes. The vertical dashed lines indicate the locations of the inner and outer borders of the ring for P6 and the solid green vertical lines the location of IS/OS junction loss. The thickness values for P6 for R+ fall well below 2SDs throughout the entire scan, and the values for OS+ outside the fovea (0°) also fall below 2SDs. Thickness is significantly decreased before the IS/OS border is lost and before the inner border of the ring is seen. Figure 5B shows the 6 mm line scan for P6 and the white arrows indicate the location of IS/OS junction loss. For 19 of the 21 patients, along the horizontal meridian, the OS+ and R+ thickness values fell below 2SDs at distances that were closer to the fovea than the inner border of hyperautofluorescence, the difference ranged from 0.17 to 2.43mm, or approximately 0.6° to 8.4°. There was a significant decrease in thickness of the receptor and its outer segment and this occurred at a distance that was closer to the fovea than the appearance of the inner border of the hyperautofluorescent ring/arc.
Figure 5.
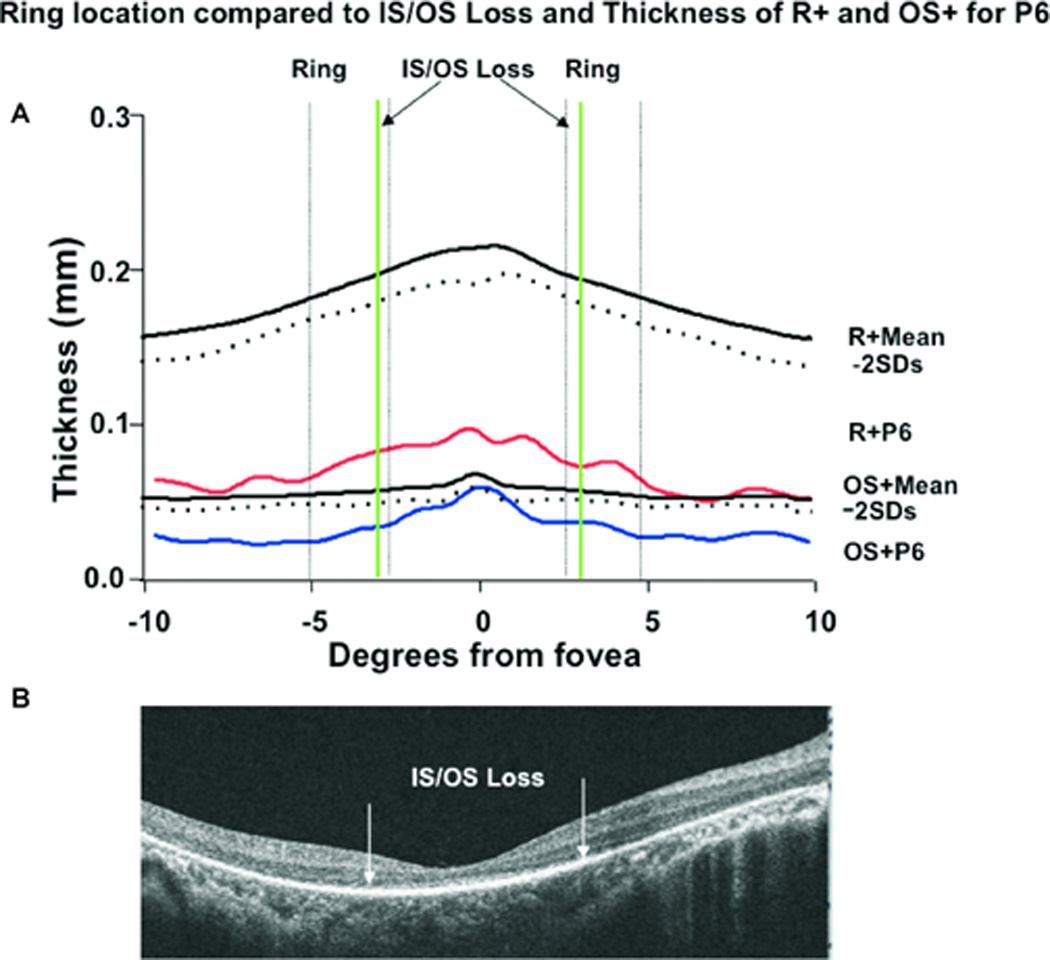
A. R+ (red) and OS+ (blue) thickness profiles for Patient 6, and for the means (bold black) −2SD (dashed black) for 21 normal controls. The dashed vertical lines represent the inner and outer borders of the ring temporal and nasal to the fovea, and the bold green vertical lines the location of the IS/OS junction loss. B. The SD-OCT scan through the horizontal meridian for Patient 6.
MP1 and FAF
To assess the relationship between visual function and hyperautofluorescence, the 10–2 MP1 results were superimposed on the 30° FAF images. Figure 6 shows MP1 results, in dB, superimposed on the 30° FAF images for 5 patients, 3 with rings (P4, P6, P8), and 2 with arcs (P1, P13). A higher dB value corresponds to better sensitivity. The dynamic range of the MP1 is 2 log units therefore the highest value on the MP1 is 20 dB and the lowest is 0 dB. In Fig. 6, P13’s sensitivity is preserved throughout the tested area with the exception of two locations in the inferior retina, at approximately 10° from the fovea, and 4 locations in the superior retina, two at 8° and two at 10° from the fovea. The locations in the inferior retina at 10°coincide with the inner border of the hyperfluorescent arc, and in the superior retina 3 of the locations are within 0.5 to 2° of the inner border of the superior portion of the arc. With the exception of two patients, P6 and P7, visual sensitivity was relatively preserved inside the hyperfluorescent ring/arc. A decrease in sensitivity was observed across the region of hyperfluorescence and outside the outer border of the ring/arc sensitivities were markedly decreased, thresholds were typically non-recordable; i.e. stimuli presented at 0dB were frequently not detected.
Figure 6.
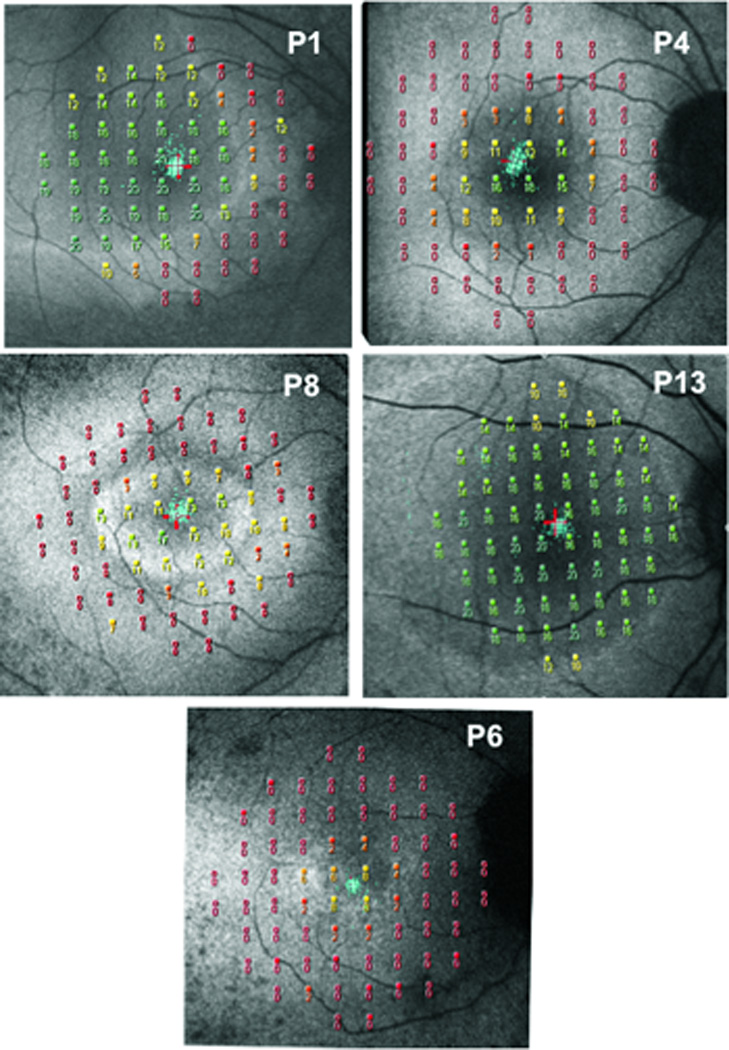
MP1 10–2 results superimposed on fundus autofluorescence images for 5 RP patients P1, P4, P8, P13 and P6.
The MP1 sensitivities for the 21 eyes were compared in 3 regions: inside, across, and outside the ring. The sensitivity values along the horizontal mid-line were calculated. For eyes in which the 10 locations did not fall on the mid-line, the values were interpolated. The difference in visual sensitivity in dB (total deviation values) at the 10 locations for each RP eye from our control data was used in the analysis. Inside the ring/arc, the mean decrease in sensitivity was 3.5 ± 3.8 dB; the decrease ranged from 0.9dB to 12.7dB. Across the ring and temporal to the fovea, it was 8.9 ± 4.8 dB (range 1.5 to 18dB), while across the ring and nasal to the fovea it was 8.9± 4.2 dB (range 1.9 to 17dB). The differences between the mean decrease in sensitivity inside the ring and across the ring both nasally and temporally were significant (P=.000005, P=.0003). The decrease in sensitivity outside the ring, temporal to the fovea was 17.0±2.4 dB (range 11.5 to 18.5 dB) and 17.9±1.4 dB (range 13.5 to 18.7 dB) nasal to the fovea.
The relationship between visual function, normal appearing FAF and the extent of preserved IS/OS junction was assessed by comparing the mean sensitivity for the 10 locations along the horizontal mid-line for the 21 eyes to the horizontal extent of normal appearing FAF inside the ring/arc, and to the length of the preserved IS/OS junction. These correlations were significant (R square=0.6332, p<0.0001; R square=0.6540, p<0.0001).
Discussion
Our aim was to provide a detailed quantitative analysis of the structure and visual function of the regions bordering the high-density autofluorescent rings/arcs seen in patients with RP. We were interested in studying the transition from apparently “healthy” to “unhealthy” retinal areas partly because of recent reports that the dimensions of the ring may reflect this region and may therefore be useful parameters for monitoring disease progression and the response to future therapeutic interventions (see Aizawa et al.,16 Wakabayashi et al.,17 Lima et al.,9,10), and partly because of uncertainties about the origins of the FAF signal in RP patients.
The suggestion that changes in the dimensions of the ring may prove to be useful for monitoring disease progression is based on findings of significant correlations of measurements of ring area with structural and functional measures. For example, the diameter of the ring was reported to be significantly correlated with IS/OS junction length, 9,16,18 and with retinal sensitivity. 10,16,19–21 In the present study, there was a similar finding of a significant correlation between the extent of the normal appearing FAF inside the ring/arc, the preserved IS/OS junction length and the mean sensitivity.
Murakami et al. 18 in their discussion stated that they had the impression that the IS/OS junction often terminated near the inner border of the ring. Further, Holder et al. 22 suggested that the border of the increased AF represented the border of the functional retina. We tested the hypothesis that disruption and/or disappearance of the IS/OS junction occurred closer to the inner rather than the outer border of the ring/arc on FAF and found that it occurred close to the inner border. However not only did we find that it occurred closer to the inner border but more importantly we found that disruption and/or disappearance of the IS/OS junction occurred closer to the fovea than the inner border of the ring/arc for 8 patients, and for two patients there was disruption of the IS/OS junction nasal to the fovea there was no arc i.e. FAF was apparently normal throughout the nasal retina.
Further evidence of structural change occurring closer to the fovea than the appearance of hyperautofluorescence was provided by our analysis of the thickness of the retinal layers. For the majority of patients (19 eyes) the OS+ and R+ thickness values fell below 2SDs at distances that were closer to the fovea than the inner border of hyperautofluorescence by 0.17 to 2.43mm, or approximately 0.6° to 8.4°. According to Hood et al.,3 the structural changes on going from healthy to unhealthy retina follow an orderly progression from thinning of the OS layer, followed by disappearance of the OS layer and then loss of the IS/OS junction. Further, Rangaswany et al.23 found that local field loss decreased from 0 db to −10 dB as OS+ thickness decreased from control values to 0 (IS/OS disappearance). These findings help explain our results of decreased cone system sensitivity inside the ring/arc by >5.0 dB for 7 patients.
It has been proposed that increased FAF indicates dysfunction of the RPE cells,5,6,24 and that the signal originated from an abnormal accumulation of lipofuscin in the retinal pigment epithelium (RPE) due to increased outer segment dysgenesis.9,10 In regions where RPE is no longer viable, AF is reduced or absent. However, we found that FAF appeared to be normal for 12 patients outside the ring/arc (20°diameter area) and that the OS/RPE border appeared to be intact in all eyes along the 6 mm horizontal scan. These findings suggest that the pattern of FAF in RP patients must reflect not only lipofuscin distribution in the RPE, but also other fluorophores in the photoreceptor layer.12, 13 Because RP is a disease primarily of the photoreceptors and with disease progression there is loss of the photoreceptors, we propose that the ring reflects a region of ongoing photoreceptor degeneration with enhanced production of bisretinoid lipofuscin precursors in these cells.14
A limitation of our study is the cross-sectional design. There is recent evidence that the high-density autofluorescent ring constricts over time11 and clearly longitudinal studies are needed to quantify and compare the functional and structural changes that may accompany this constriction. The results will also help determine which are the most sensitive predictors of disease progression in patients with RP.
In summary, our results have shown that structural and functional changes can occur closer to the fovea than the appearance of the high-density autofluorescent ring. Therefore for monitoring progression, as well as the change from healthy to unhealthy retina, in RP patients we suggest that FAF be compared to SD-OCT measures of IS/OS junction length and measures of visual sensitivity.
Acknowledgements
Supported in part by National Eye Institute Grant R01-EY-09076 (VG) and R01EY018213 (SHT); unrestricted funds from Research to Prevent Blindness, New York, NY; the Foundation Fighting Blindness, and The Starr Foundation.
The authors thank Dr. Janet Sparrow for her valuable comments and advice, and Beulah Abrahams for her technical assistance.
Footnotes
Publisher's Disclaimer: This is a PDF file of an unedited manuscript that has been accepted for publication. As a service to our customers we are providing this early version of the manuscript. The manuscript will undergo copyediting, typesetting, and review of the resulting proof before it is published in its final citable form. Please note that during the production process errors may be discovered which could affect the content, and all legal disclaimers that apply to the journal pertain.
Conflict of interest: No conflicting relationship exists for any author.
References
- 1.Hartong DT, Berson EL, Dryja TP. Retinitis pigmentosa. Lancet. 2006;368:1795–1809. doi: 10.1016/S0140-6736(06)69740-7. [DOI] [PubMed] [Google Scholar]
- 2.Bhatti MT. Retinitis pigmentosa, pigmentary retinopathies, and neurologic disease. Curr Neurol Rep. 2006;6:403–413. doi: 10.1007/s11910-996-0021-z. [DOI] [PubMed] [Google Scholar]
- 3.Hood DC, Lazow MA, Locke KG, et al. The transition zone between healthy and affected regions in patients with retinitis pigmentosa. Invest Ophthalmol Vis Sci. 2011;52:101–108. doi: 10.1167/iovs.10-5799. [DOI] [PMC free article] [PubMed] [Google Scholar]
- 4.Jacobson SG, Aleman TS, Sumaroka A, et al. Disease boundaries in the retina of patients with Usher syndrome caused by MYO7A gene mutations. Invest Ophthalmol Vis Sci. 2009;50:1886–1894. doi: 10.1167/iovs.08-3122. [DOI] [PubMed] [Google Scholar]
- 5.Delori FC, Staurenghi G, Arend O, et al. In vivo measurement of lipofuscin in Stargardt’s disease-Fundus flavimaculatus. Invest Ophthalmol Vis Sci. 1995;36:2327–2331. [PubMed] [Google Scholar]
- 6.von Ruckmann A, Fitzke FW, Bird AC. Distribution of fundus autofluorescence with a scanning laser ophthalmoscope. Br J Ophthalmol. 1995;79:407–412. doi: 10.1136/bjo.79.5.407. [DOI] [PMC free article] [PubMed] [Google Scholar]
- 7.Fleckenstein M, Charbel Issa P, Fuchs HA, et al. Discrete arcs of increased fundus autofluorescence in retinal dystrophies and functional correlate on microperimetry. Eye (Lond) 2009;23:567–575. doi: 10.1038/eye.2008.59. [DOI] [PubMed] [Google Scholar]
- 8.Robson AG, Michaelides M, Saihan Z, et al. Functional characteristics of patients with retinal dystrophy that manifest abnormal parafoveal annuli of high density fundus autofluorescence: a review and update. Doc Ophthalmol. 2008;116:79–89. doi: 10.1007/s10633-007-9087-4. [DOI] [PMC free article] [PubMed] [Google Scholar]
- 9.Lima LH, Cella W, Greenstein VC, et al. Structural assessment of hyperautoflurescent ring in patients with retinitis pigmentosa. Retina. 2009;29:1025–1031. doi: 10.1097/IAE.0b013e3181ac2418. [DOI] [PMC free article] [PubMed] [Google Scholar]
- 10.Lima LH, Greenstein VC, Burke T, et al. Progressive constriction of the hyperautofluorescent ring in retinitis pigmentosa. ARVO. 2010 doi: 10.1016/j.ajo.2011.08.043. [DOI] [PMC free article] [PubMed] [Google Scholar]
- 11.Robson AG, Saihan Z, Jenkins SA, et al. Functional characterization and serial imaging of abnormal fundus autofluorescence in patients with retinitis pigmentosa. Br J Ophthalmol. 2006;90:472–479. doi: 10.1136/bjo.2005.082487. [DOI] [PMC free article] [PubMed] [Google Scholar]
- 12.Sawa M, Gomi F, Ohji M, et al. Fundus autofluorescence after full macular translocation surgery for myopic choroidal neovascularization. Graefes Arch Clin Exp Ophthalmol. 2008;246:1087–1095. doi: 10.1007/s00417-008-0835-2. [DOI] [PubMed] [Google Scholar]
- 13.Schmitz-Valckenberg S, Holz FG, Bird AC, Spaide RF. Fundus autofluorescence imaging: review and perspectives. Retina. 2008;28:385–409. doi: 10.1097/IAE.0b013e318164a907. [DOI] [PubMed] [Google Scholar]
- 14.Sparrow JR, Yoon KD, Wu Y, Yamamoto K. Interpretations of fundus autofluorescence from studies of the bisretinoids of the retina. Invest Ophthalmol Vis Sci. 2010;51:4351–4357. doi: 10.1167/iovs.10-5852. [DOI] [PMC free article] [PubMed] [Google Scholar]
- 15.Hood DC, Lin CE, Lazow MA, et al. Thickness of receptor and postreceptor retinal layers in patients with retinitis pigmentosa measured with frequency-domain optical coherence tomography. Invest Ophthalmol Vis Sci. 2009;50:2328–2336. doi: 10.1167/iovs.08-2936. [DOI] [PMC free article] [PubMed] [Google Scholar]
- 16.Aizawa S, Mitamura Y, Hagiwara A, et al. Changes of fundus autofluorescence, photoreceptor inner and outer segment junction line, and visual function in patients with retinitis pigmentosa. Clin Experiment Ophthalmol. 2010;38:597–604. doi: 10.1111/j.1442-9071.2010.02321.x. [DOI] [PubMed] [Google Scholar]
- 17.Wakabayashi T, Sawa M, Gomi F, Tsujikawa M. Correlation of fundus autofluorescence with photoreceptor morphology and functional changes in eyes with retinitis pigmentosa. Acta Ophthalmol. 2010;88:e177–e183. doi: 10.1111/j.1755-3768.2010.01926.x. [DOI] [PubMed] [Google Scholar]
- 18.Murakami T, Akimoto M, Ooto S, et al. Association between abnormal autofluorescence and photoreceptor disorganization in retinitis pigmentosa. Am J Ophthalmol. 2008;145:687–694. doi: 10.1016/j.ajo.2007.11.018. [DOI] [PubMed] [Google Scholar]
- 19.Robson AG, El-Amir A, Bailey C, et al. Pattern ERG correlates of abnormal fundus autofluorescence in patients with retinitis pigmentosa and normal visual acuity. Invest Ophthalmol Vis Sci. 2003;44:3544–3550. doi: 10.1167/iovs.02-1278. [DOI] [PubMed] [Google Scholar]
- 20.Robson AG, Egan CA, Luong VA, et al. Comparison of fundus autofluorescence with photopic and scotopic fine matrix mapping in patients with retinitis pigmentosa and normal visual acuity. Invest Ophthalmol Vis Sci. 2004;45:4119–4125. doi: 10.1167/iovs.04-0211. [DOI] [PubMed] [Google Scholar]
- 21.Popovic P, Jarc-Vidmar M, Hawlina M. Abnormal fundus autofluorescence in relation to retinal function in patients with retinitis pigmentosa. Graefes Arch Clin Exp Ophthalmol. 2005;243:1018–1027. doi: 10.1007/s00417-005-1186-x. [DOI] [PubMed] [Google Scholar]
- 22.Holder GE, Robson AG, Hogg CR, et al. Pattern ERG: clinical overview, and some observations on associated fundus autofluorescence imaging in inherited maculopathy. Doc Ophthalmol. 2003;106:17–23. doi: 10.1023/a:1022471623467. [DOI] [PubMed] [Google Scholar]
- 23.Rangaswamy NV, Patel HM, Locke KG, et al. A comparison of visual field sensitivity to photoreceptor thickness in retinitis pigmentosa. Invest Ophthalmol Vis Sci. 2010;51:4213–4219. doi: 10.1167/iovs.09-4945. [DOI] [PMC free article] [PubMed] [Google Scholar]
- 24.Scholl HP, Chong NH, Robson AG, et al. Fundus autofluorescence in patients with leber congenital amaurosis. Invest Ophthalmol Vis Sci. 2004;45:2747–2752. doi: 10.1167/iovs.03-1208. [DOI] [PubMed] [Google Scholar]