

MR elastography provided the most accurate information about the fibrosis stage, whereas laboratory marker panels such as FIB-4 score and nonalcoholic fatty liver disease fibrosis score were found to have a reasonably high correlation with advanced fibrosis.
Abstract
Purpose:
To evaluate the diagnostic accuracy of magnetic resonance (MR) elastography as a method to help diagnose clinically substantial fibrosis in patients with nonalcoholic fatty liver disease (NAFLD) and, by using MR elastography as a reference standard, to compare various laboratory marker panels in the identification of patients with NAFLD and advanced fibrosis.
Materials and Methods:
This retrospective study was institutional review board approved and HIPAA complaint. Informed consent was waived. This study was conducted in patients with NAFLD, who were identified by imaging characteristics consistent with steatosis in a prospective database that tracks all MR elastographic examinations. Six laboratory-based models of fibrosis were compared with MR elastographic results as well as fibrosis stage from liver biopsy results. The area under the receiver operating characteristic curve (AUROC), sensitivity, specificity, positive predictive value, and negative predictive value of each data set were compared.
Results:
Among 325 patients with NAFLD with MR elastographic data, there were 142 patients who underwent liver biopsy within 1 year of MR elastography. When comparing MR elastography results with liver biopsy results, the best cutoff for advanced fibrosis (stage F3–F4, 46 [32.4%] of 142) was 4.15 kPa (AUROC = 0.954, sensitivity = 0.85, specificity = 0.929). This cutoff value identified 104 patients with advanced fibrosis (32.0% of 325 patients). The FIB-4 score (AUROC = 0.827) and NAFLD fibrosis score (AUROC = 0.821) had the best diagnostic accuracy for advanced fibrosis, with high negative predictive values (NAFLD fibrosis score = 0.90 and FIB-4 score = 0.899).
Conclusion:
MR elastography is a useful diagnostic tool for detecting advanced fibrosis in NAFLD. Of the laboratory-based methods, the NAFLD fibrosis and FIB-4 scores can most reliably detect advanced fibrosis.
© RSNA, 2013
Supplemental material: http://radiology.rsna.org/lookup/suppl/doi:10.1148/radiol.13121193/-/DC1
Introduction
With an estimated prevalence of 20%–30%, nonalcoholic fatty liver disease (NAFLD) is recognized as the most prevalent liver disease worldwide (1). It represents a wide spectrum of pathologic findings, from simple steatosis to nonalcoholic steatohepatitis, fibrosis, cirrhosis, and hepatocellular carcinoma (2). In light of the rapidly increasing prevalence of obesity, it has been predicted that complications of NAFLD may become the most common reason for liver transplantation (3).
Traditionally, the diagnosis of NAFLD depended on liver biopsy results to verify the existence of steatosis and to assess the severity of liver fibrosis. Differentiation between simple steatosis and nonalcoholic steatohepatitis with fibrosis is clinically important for prognosis, for selecting candidates to screen for future complications, and for therapeutic interventions (2,4). Limitations of liver biopsy are increasingly recognized in terms not only of discomfort, risk, and costs but also in terms of reliability in the assessment of fibrosis secondary to sampling variability (5–8). Moreover, interobserver variability in the interpretation of fibrosis, even among expert pathologists, may be as high as 20% (9).
These drawbacks of liver biopsy have led to development of an increasing number of noninvasive markers of liver fibrosis. These include elastography to measure liver stiffness (10–12), as well as panels of laboratory markers (13). Of these, magnetic resonance (MR) elastography has a strong appeal based on the ability to assess the entire liver rather than a small sample of the organ, operator independence, and the ability to image the liver and other abdominal organs. The purpose of this study was to evaluate the diagnostic accuracy of MR elastography as a method to help diagnose clinically substantial fibrosis in patients with NAFLD and, by using MR elastography as a reference standard, to compare various laboratory marker panels in the identification of patients with NAFLD and advanced fibrosis.
Materials and Methods
Sources of Data
This retrospective study was approved by the Institutional Review Board of the Mayo Foundation, and informed consent was waived given the minimal risk involved in the study. The study was compliant with the Health Insurance Portability and Accountability Act. The Mayo Clinic and one author (R.L.E.) have intellectual property rights and a financial interest in MR elastography. This study was conducted under the oversight of the Mayo Clinic Conflict of Interest Review Board. The funding organizations played no role in the design and conduct of the study; in the collection, management, analysis, and interpretation of data; or in the preparation, review, or approval of the manuscript.
Since MR elastography was introduced in the practice at the Mayo Clinic Rochester, a prospective database was used to track all patients undergoing the procedure. From this database, all adults (>18 years) who underwent cross-sectional imaging to identify hepatic steatosis MR characteristics consistent with steatosis of the liver were identified between January 2007 and September 2010. We excluded patients with the following characteristics: (a) evidence of a specific cause for liver disease such as viral hepatitis B or C, hemochromatosis, autoimmune and cholestatic liver disease, and alcoholic liver disease; (b) clinical and/or imaging evidence of hepatic decompensation and portal hypertension such as esophageal varices; (c) history of liver resection or transplantation; and (d) hepatic neoplasm such as hepatocellular carcinoma or cholangiocarcinoma. Of the subjects who met these criteria, those who underwent liver biopsy within 1 year of MR elastographic examination were identified.
From the MR elastographic database and medical records, anthropometric, laboratory, and histopathology data, as well as MR elastographic results, were extracted. Laboratory data included aspartate aminotransferase (AST) level, alanine aminotransferase (ALT) level, serum albumin level, complete blood count, total cholesterol level, triglyceride level, high-density lipoprotein cholesterol level, and fasting glucose level. Diabetes mellitus was defined as fasting glucose level of 126 mg/dL (7 mmol/L) or greater or treatment with antidiabetic drugs. Impaired fasting glycemia was defined as fasting glucose level of 110 mg/dL (6.1 mmol/L) or greater but less than 126 mg/dL. Systolic blood pressure of 140 mm Hg or greater or diastolic blood pressure of 90 mm Hg or greater and/or previous use of antihypertensive medication was used to define hypertension.
Assessment of Liver Fibrosis
MR elastography was performed according to the established method as previously published (10,14,15). Briefly, MR elastography was performed with a 1.5-T whole-body imager (Signa; GE Medical System, Milwaukee, Wis) by using a transmit-receiver coil. Continuous longitudinal mechanical waves at 60 Hz were generated by using an acoustic pressure waves–transmitted driver device on the anterior chest wall. A two-dimensional gradient-echo MR elastography sequence was performed to acquire axial wave images with the following parameters: repetition time msec/echo time msec, 50/23; continuous sinusoidal vibration, 60 Hz; field of view, 32–42 cm; matrix size, 256 × 64; flip angle, 30°; section thickness, 10 mm; four evenly spaced phase offsets; and four pairs of 60-Hz trapezoidal motion-encoding gradients with zeroth and first moment nulling along the through-plane direction. All processing steps were applied automatically, without manual intervention, to yield quantitative images of tissue shear stiffness in kilopascals. Interpretation of MR elastographic images was performed by staff abdominal radiologists in the Department of Radiology by following protocols established in the Department as described previously (16). The liver stiffness measurements obtained at the time of examination were entered into the database and extracted for this study.
Liver biopsy slides were examined by dedicated hepatopathologists in the Division of Anatomic Pathology at the Mayo Clinic, who were unaware of MR elastographic results. Fibrosis stage was determined on the basis of the Brunt classification modified by Kleiner et al (17). Briefly, stage 0 represented absence of fibrosis (F0), stage 1 represented perisinusoidal or portal fibrosis (F1), stage 2 represented perisinusoidal and portal or periportal fibrosis (F2), stage 3 represented septal and bridging fibrosis (F3), and stage 4 represented cirrhosis (F4). Advanced fibrosis was defined as F3 or F4 fibrosis. Table E1 (online) summarizes the six laboratory marker panels evaluated in this analysis, including AST-to-platelet ratio index (APRI) (18), AST-to-ALT ratio, the BARD score (19), the FIB-4 score (20), the NAFLD fibrosis score (21), and the simple panel for distinguishing severe fibrosis (2). For each panel, published cutoffs were applied in the evaluation of its diagnostic accuracy.
Statistical Analysis
The first part of this analysis consisted of evaluating the performance characteristics of MR elastography (and the laboratory marker panels) in patients who had both MR elastographic and liver biopsy data. The diagnostic accuracy was assessed by the standard area under the receiver operating characteristic curve (AUROC) and the weighted AUROC. The latter was computed by using the Obuchowski measure (22) to account for spectrum effect and ordinal scale (23,24) by following the established method as previously described (23,25,26). Briefly, this measure is a multinomial analysis of AUROC and can be interpreted as the probability that the test will correctly rank two randomly chosen biopsy samples with different fibrosis stages according to weighting scheme, with a penalty for misclassifying subjects. With N (= 5) categories of the fibrosis stage (reference standard outcome) and AUROCst, the estimate of the AUROC of diagnostic tests for differentiating between categories s and t, this measure is a weighted average of N(N − 1)/2 (= 10) with different AUROCst corresponding to all pairwise comparisons between two of the N categories. Each pairwise comparison has been weighted to take into account the distance between fibrosis stages. A penalty function proportional to the difference between fibrosis stages was defined; it was 0.25 when the difference between stages was one, 0.5 when the difference was two, 0.75 when the difference was three, and 1 when the difference was four. The Obuchowski measure can be interpreted as the probability that the noninvasive laboratory markers will correctly rank two randomly chosen samples from different fibrosis stages according to weighting scheme, with a penalty for misclassifying patients (24). The overall Obuchowski measure is not equivalent to the standard AUROC, because measurements are weighted according to distance between stages (25).
To assess the precision of the AUROC estimates, 95% confidence intervals were calculated by using the bootstrap method (27). Bootstrap sampling was repeated 1000 times, from which the 2.5th and 97.5th percentile values were taken as the 95% confidence intervals (26,28). The AUROC curves were compared according to DeLong et al (29). The AUROC curves and the Youden index were used to determine the best cutoff.
The second part of the study was composed of assessing the diagnostic performance of laboratory marker tests in identifying advanced fibrosis as determined with MR elastography in all patients (ie, including patients without liver biopsy data). The AUROC and its 95% confidence intervals were calculated for each marker panel. Standard definitions were used for calculation of the sensitivity, specificity, positive predictive value, and negative predictive value. Statistical analysis was performed by using software (SPSS, version 17.0, SPSS, Chicago, Ill; MedCalc, version 11.4, MedCalc Software, Mariakerke, Belgium; and R software, 2008, R Development Core Team, Vienna, Austria).
Results
In the MR elastographic database, a total of 408 consecutive patients with NAFLD underwent MR elastography and/or liver biopsy. Twenty-one patients were excluded because of multiple data for MR elastography. MR elastography could be performed in 372 of 387 patients. MR elastography was unsuccessful in nine patients because of technical problems. Six patients refused MR elastographic examination. Forty-seven patients underwent biopsy more than 1 year before MR elastography (n = 18) or important laboratory data (n = 29) were not collected and were excluded in the final analysis (Fig 1). When the study eligibility was applied, 325 patients were suitable for this analysis, including 142 who underwent liver biopsy within 1 year of MR elastographic examination (median interval, 34 days; interquartile range, 7.5–91.5 days). Table 1 compares patients with and those without liver biopsy data. Although the two were significantly different in several aspects, the most important characteristic in this comparison, namely liver stiffness measured by using MR elastography, was similar, as were other parameters that would correlate with fibrosis, such as platelet count and serum albumin level. The direction in the difference between the two groups was not consistent; for example, body mass index was higher in patients who underwent liver biopsy, whereas fasting blood glucose and triglyceride levels were higher in those who did not undergo biopsy.
Figure 1:
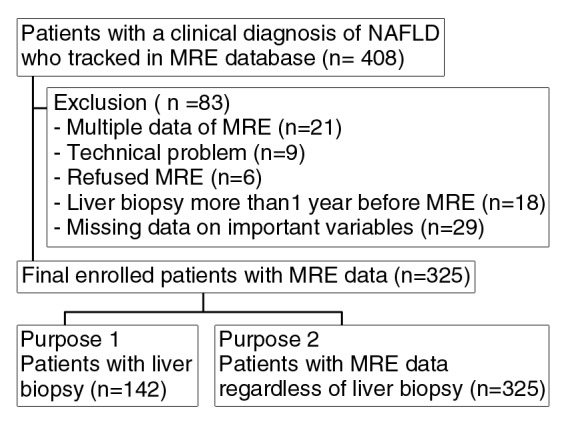
Flow diagram of patient selection and inclusion and exclusion criteria for the study. MRE = MR elastography.
Table 1.
Demographic and Laboratory Characteristics of Study Subjects
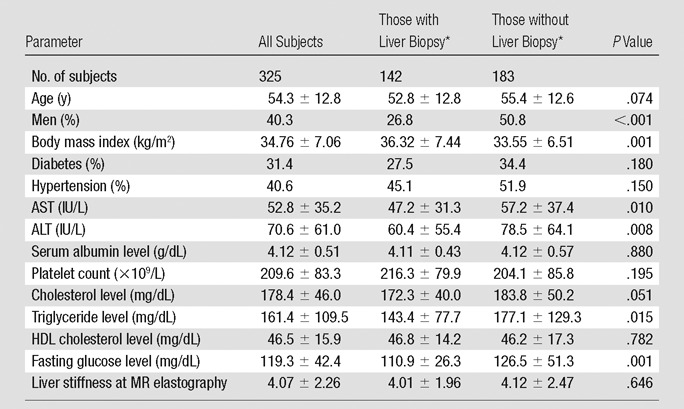
Note.—Unless otherwise indicated, data are means ± standard deviations. To convert from international units per liter to microkatals per liter, multiply by 0.0167. To convert from milligrams per deciliter (for cholesterol levels) to millimoles per liter, multiply by 0.0259. To convert from milligrams per deciliter (for triglyceride level) to millimoles per liter, multiply by 0.0113. To convert from milligrams per deciliter (for glucose level) to millimoles per liter, multiply by 0.0555. HDL = high-density lipoprotein.
Liver biopsy was performed within 12 months of MR elastography.
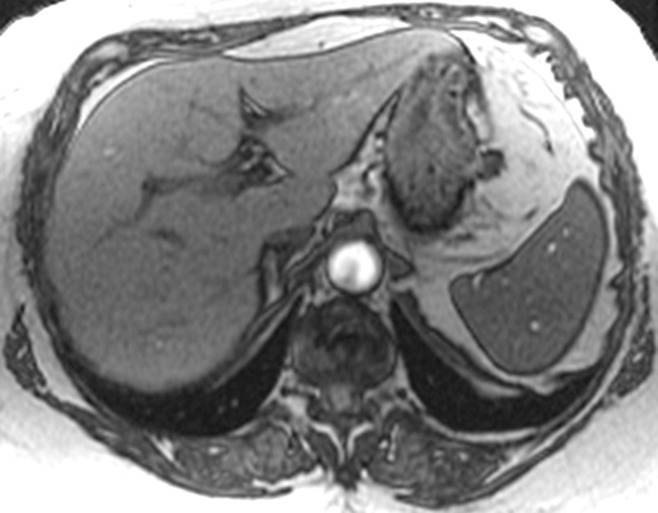
In patients with biopsy data, the distribution of fibrosis stage was as follows: F0 in 35.2% (50 of 142), F1 in 23.9% (34 of 142), F2 in 8.5% (12 of 142), F3 in 7.0% (10 of 142), and F4 in 25.4% (36 of 142). The mean liver stiffness was 2.80 kPa ± 0.60 (standard deviation) (range, 1.97–4.51 kPa) for F0, 3.08 kPa ± 0.79 (range, 1.93–5.10 kPa) for F1, 3.58 kPa ± 0.85 (range, 2.54–5.46 kPa) for F2, 5.31 kPa ± 2.17 (range, 2.80–9.79 kPa) for F3, and 6.35 kPa ± 1.95 (range, 3.46–12.20 kPa) for F4. Figures 2 and 3 show patients with and without advanced fibrosis. Figure 4 compares liver stiffness between patients with advanced fibrosis (F3–F4) and those without (F0–F2). The mean liver stiffness in the former was 2.99 kPa ± 0.73 (median, 2.80 kPa; interquartile range, 2.53–3.37 kPa), and that in the latter was 6.12 kPa ± 2.02 (median, 5.95 kPa; interquartile range, 4.50–7.39 kPa). The best discriminating cutoff value of liver stiffness to diagnose advanced fibrosis was 4.15 kPa. This cutoff was associated with a sensitivity and specificity of MR elastography in detecting advanced fibrosis of 85.0% and 92.9%, respectively.
Figure 2a:
MR elastographic data in a patient with NAFLD without advanced fibrosis. (a) Morphologic MR image as established with biopsy results. (b) MR elastogram (stiffness map) of same section shown in a. The liver outline is shown with a dashed line, and the mean stiffness is 2.1 kPa (within the normal range).
Figure 3a:
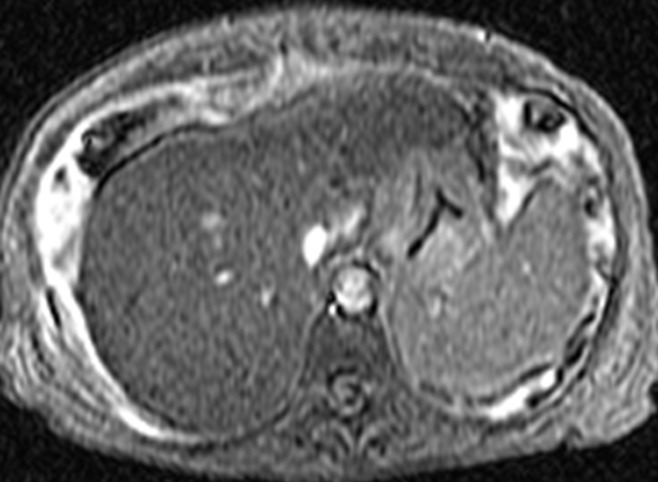
MR elastographic data in patient with NAFLD with advanced fibrosis. (a) Morphologic MR image in patient with stage 3 liver fibrosis as established with biopsy results. Ascites is present. (b) MR elastogram of the same section shown in a shows markedly increased hepatic stiffness, with a mean value of 9.8 kPa.
Figure 4:
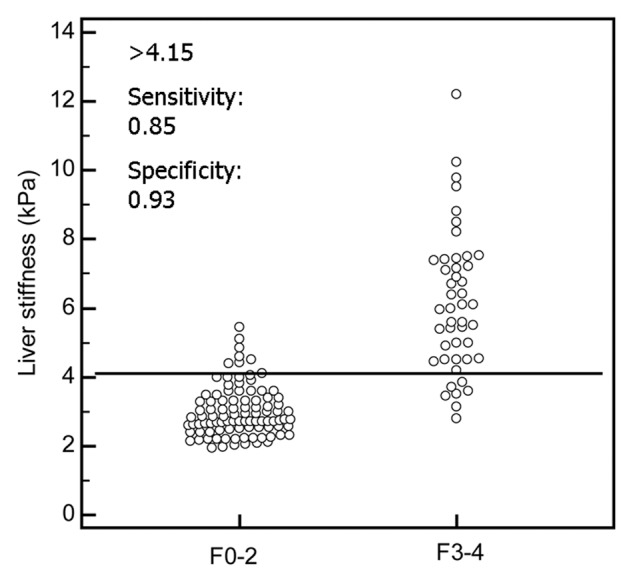
Graph shows liver stiffness measured at MR elastography for early (F0–F2) versus advanced (F3–F4) stages of fibrosis. The best discriminating cutoff of liver stiffness to diagnose advanced fibrosis was 4.15 kPa. This cutoff was associated with a sensitivity and specificity of MR elastography in detecting advanced fibrosis of 85.0% and 92.9%, respectively.
Figure 2b:
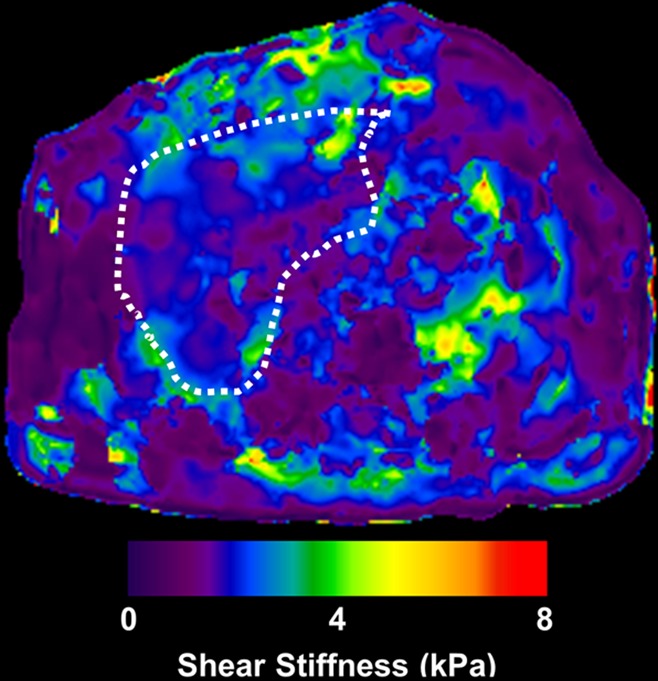
MR elastographic data in a patient with NAFLD without advanced fibrosis. (a) Morphologic MR image as established with biopsy results. (b) MR elastogram (stiffness map) of same section shown in a. The liver outline is shown with a dashed line, and the mean stiffness is 2.1 kPa (within the normal range).
Figure 3b:
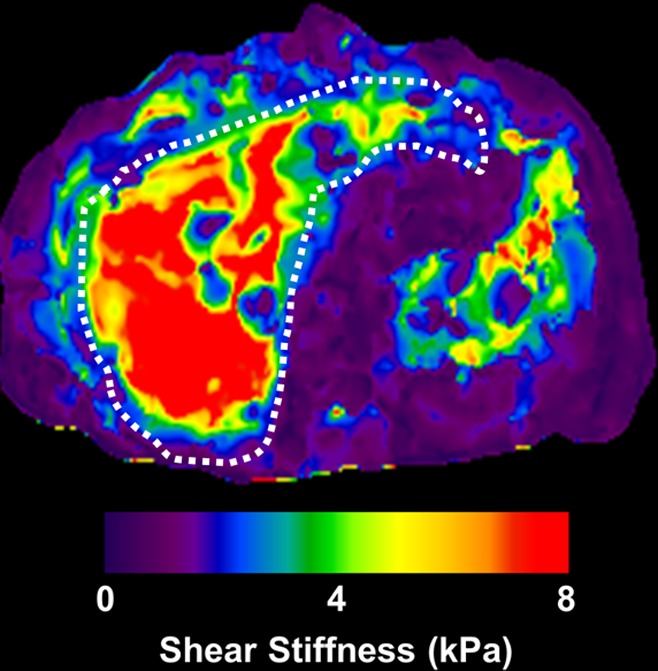
MR elastographic data in patient with NAFLD with advanced fibrosis. (a) Morphologic MR image in patient with stage 3 liver fibrosis as established with biopsy results. Ascites is present. (b) MR elastogram of the same section shown in a shows markedly increased hepatic stiffness, with a mean value of 9.8 kPa.
Table 2 compares the diagnostic accuracy of noninvasive markers for detecting advanced fibrosis. MR elastography was the best in detecting advanced fibrosis with a standard AUROC of 0.954. Of the marker panels, the FIB-4 and NAFLD fibrosis scores performed the best. The results with weighted AUROC were essentially unchanged, with MR elastography being significantly superior to other laboratory marker panels.
Table 2.
Diagnostic Accuracy of Noninvasive Tests by Detecting Histologic Stage F3–F4 and Weighted AUROC Derived from the Obuchowski Measure
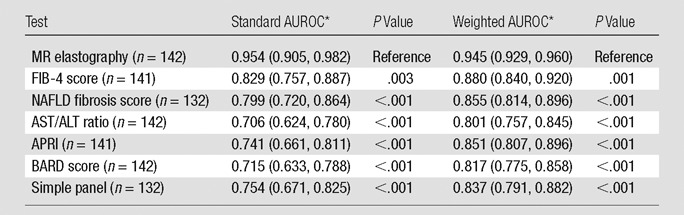
Data in parentheses are 95% confidence intervals.
Table 3 compares patients with and those without advanced fibrosis defined by using MR elastography. Patients with advanced fibrosis were older and more likely to have diabetes, hypertension, lower platelet count, and lower serum albumin level. Serum AST, but not ALT, activities were higher with advanced fibrosis, giving rise to a higher AST/ALT ratio. There was no difference between the two groups for other metabolic parameters, such as body mass index and lipid profile.
Table 3.
Comparison between Patients with and Those without Advanced Fibrosis by Using MR Elastography
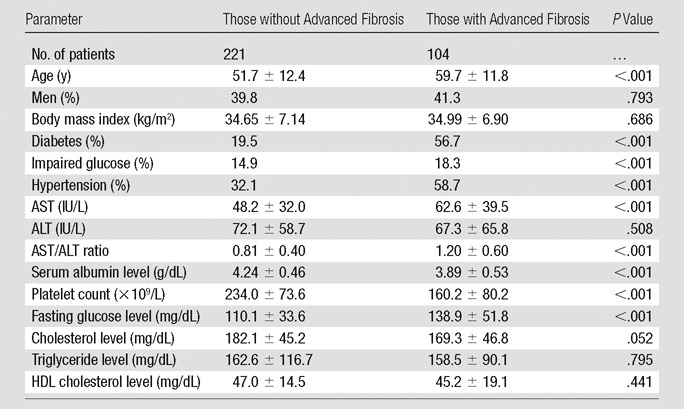
Note.—Unless otherwise indicated, data are means ± standard deviations. Advanced fibrosis was defined as liver stiffness greater than 4.15 kPa. To convert from international units per liter to microkatals per liter, multiply by 0.0167. To convert from milligrams per deciliter (for cholesterol levels) to millimoles per liter, multiply by 0.0259. To convert from milligrams per deciliter (for triglyceride level) to millimoles per liter, multiply by 0.0113. To convert from milligrams per deciliter (for glucose level) to millimoles per liter, multiply by 0.0555. HDL = high-density lipoprotein.
Table E2 (online) and Figure 5 show the laboratory marker panels for detecting advanced fibrosis defined by using MR elastography in all subjects with available data. The mean scores of all six panels were significantly different between patients with and those without advanced fibrosis. The AUROC was highest for FIB-4 at 0.827, followed by the NAFLD fibrosis score and APRI, with the latter two markers not being significantly different from FIB-4. The BARD score, the simple panel, and the AST/ALT ratio were not as accurate and were significantly inferior to FIB-4.
Figure 5:
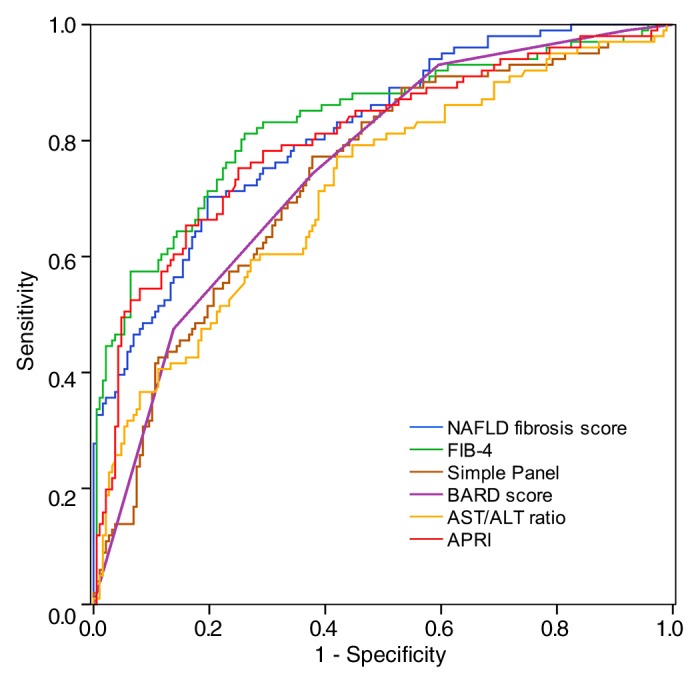
Receiver operating characteristic curves for serum marker panels for a diagnosis of advanced fibrosis (liver stiffness > 4.15 kPa). The mean scores of all six panels were significantly different between patients with and those without advanced fibrosis. The AUROC was highest for FIB-4 at 0.827, followed by the NAFLD fibrosis score and APRI, with the latter two markers not being significantly different from FIB-4.
Table 4 summarizes the sensitivity, specificity, positive predictive value, and negative predictive value of each panel marker by using previously published cutoffs (18–21). The NAFLD fibrosis score (90.0%) and FIB-4 score (89.9%) had the highest negative predictive value by using the lower cutoff, but AST/ALT ratio and BARD score also performed well, with negative predictive values of 84.9% and 84.8%, respectively. The FIB-4 score (76.9%) had the highest positive predictive value by using the higher cutoff, but NAFLD fibrosis score performed modestly, with a positive predictive value of 66.3%.
Table 4.
Diagnostic Performance of Marker Panels at Recommended Cutoff Values in the Diagnosis of Advanced Fibrosis
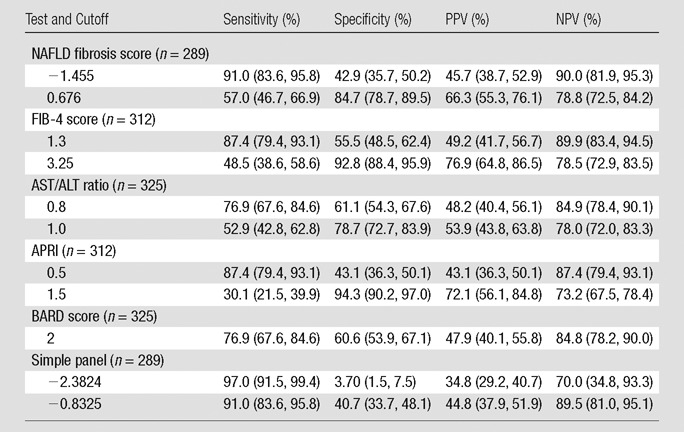
Note.—Data in parentheses are 95% confidence intervals. Advanced fibrosis was defined as liver stiffness greater than 4.15 kPa. NPV = negative predictive value, PPV = positive predictive value.
Discussion
The main findings in this cohort of patients with NAFLD were (a) when liver biopsy was used as the reference standard, MR elastography exhibited the best performance characteristics in assessing fibrosis and (b) when MR elastography was used as the reference standard for liver fibrosis, two noninvasive marker panels, namely, FIB-4 score and NAFLD fibrosis score, performed consistently better than others. These data demonstrate that MR imaging combined with MR elastography is an effective noninvasive means to diagnose hepatic steatosis and fibrosis, and thus nonalcoholic steatohepatitis.
Liver biopsy has been considered the reference standard in the assessment of liver fibrosis, although its limitations are well recognized, which include discomfort, risk of complications, and costs. However, from the standpoint of reliability and reproducibility of the information obtained, liver biopsy is subject to a substantial degree of sampling variability, owing presumably to heterogeneity in the distribution of pathologic lesions in the liver parenchyma (6). In a study that examined paired liver biopsy samples from the left and right lobes simultaneously, a difference of at least one stage was found in 33% of cases (30). Similarly, in a study of patients with NAFLD with paired biopsy specimens, discordance of one stage or more was found in 41% (6).
Liver stiffness measurement by using transient elastography is thought to be less prone to sampling variability, especially with MR elastography and its ability to visualize the entire liver (12,31–33). In this and other studies that evaluated the diagnostic accuracy of various noninvasive markers of liver fibrosis in comparison to histologic staging, the apparent inaccuracy of those markers may in part be attributable to sampling variability and misclassification of the latter (34,35). These data lend support to our approach of using MR elastography (35) as a reference standard in evaluating other markers of liver fibrosis.
This study evaluated various noninvasive diagnostic tools for advanced fibrosis in a homogeneous cohort of patients with NAFLD by using MR elastography. Others have evaluated MR elastography in patients with NAFLD (10,11), but those studies were based on limited sample size. Because MR elastography and other elastography methods have been widely studied, one could surmise that they will work equally well in patients with NAFLD. While some part of hepatic fibrogenesis is shared by all liver disease, the lobular distribution in the accumulation of fibrotic tissue in NAFLD is distinct from that in viral hepatitis or cholestatic liver disease (2). In fact, emerging data suggest that transient elastography may be less accurate in detecting advanced fibrosis in patients with NAFLD than in those with hepatitis C (36). Our data suggest that MR elastography and the laboratory marker panels evaluated in this study, which were commonly developed in patients with viral hepatitis, are quite applicable in patients with NAFLD.
Of the various elastographic techniques, MR elastography may be particularly well suited for evaluation of the patients with NAFLD (11). In a recent prospective study, liver stiffness measured by using ultrasonography (US)-based elastography was difficult to interpret in nearly one in five cases, and this failure was independently associated with a body mass index greater than 30 kg/m2 (37). Indeed, in our study, obese patients (body mass index > 30 kg/m2) represented 72% (234 of 325) of our cohort, reflecting the association between obesity and NAFLD. Although a new XL probe has been reported to reduce scan failure and enhance the reliability of the measurement of fibrosis (38), US-based transient elastography needs to be fully evaluated for application in patients with NAFLD in Western countries with a high prevalence of obesity. Clearly, MR elastography overcomes these limitations of US-based measurement in obese patients, as well as providing other advantages such as higher reproducibility, lack of operator and interoperator variability, and the ability to visualize the entire liver (39,40).
In our study, we used the Obuchowski measure to prevent spectrum bias. The weighted AUROC analysis by the Obuchowski measure captured better information by using all five fibrosis stages. The results with weighted AUROC were essentially unchanged; MR elastography showed significantly superior performance to other laboratory marker panels. In terms of standard AUROC, the evaluation of fibrosis stages does not need to be as exact as the pathologic stage score in clinical practice. In patients with NAFLD, the absolute stage is less important than determining whether patients have advanced fibrosis (F3 or F4) or not.
The clinical utility of fibrosis assessment in patients with NAFLD is less clearly defined than other types of liver disease for which specific interventions are available. It is well recognized that patients with NAFLD with established fibrosis (ie, nonalcoholic steatohepatitis) have a different natural history and prognosis than those with simple steatosis. Because there is no established therapy for nonalcoholic steatohepatitis other than weight loss, the diagnosis of nonalcoholic steatohepatitis itself does not necessarily alter the therapeutic approach in these patients. The rationale for us to focus on patients with advanced (F3–F4) fibrosis is that it identifies candidates for secondary prevention, including endoscopic screening for gastroesophageal varices and surveillance for hepatocellular carcinoma. In addition, the presence of advanced fibrosis may strongly encourage the physician and the patient to make concerted efforts at sustainable weight reduction, such as consideration of a bariatric procedure in selected patients.
Although this study was performed in a large NAFLD cohort, it does have a number of limitations. Notwithstanding the preceding discussion that liver biopsies are an imperfect reference standard, liver biopsy results were not available in all study subjects. Clearly, that is an evitable limitation of an observational study, especially given the likelihood that biopsies were more likely performed in patients; we do believe that those with biopsy results were representative of the entire population. Similarly, not all laboratory data were available to compute the marker panel data in every patient; but compared with liver biopsy data, those data were nearly complete. Another potential concern was referral bias in that our patients at the Mayo Clinic have more complicated and advanced disease. Clearly, inclusion of more patients without advanced fibrosis will affect the positive and negative predictive values, but there is no reason to suspect that patients with advanced fibrosis seen in our practice are somehow fundamentally different from those in the community general population. Because MR elastography has been granted approval by the U.S. Food and Drug Administration, we hope that more generalizable data from patients in the community setting may become available in the future. Last, the diagnostic performance of each noninvasive method for advanced fibrosis has been evaluated by calculation of AUROC, with liver biopsy as the reference standard. Because liver biopsy is an imperfect reference standard, reported diagnostic accuracy might be over- or underestimated for the assessment of advanced fibrosis.
In summary, in this cohort of patients with NAFLD at a tertiary academic center, MR elastography provided the most accurate information about the fibrosis stage, whereas laboratory marker panels such as FIB-4 score and NAFLD fibrosis score were found to have a reasonably high correlation with advanced fibrosis. We conclude that these noninvasive indicators of fibrosis are useful in monitoring, counseling, and, in some cases, making treatment decisions in patients with NAFLD. Given its advantage of being able to depict steatosis and estimate the severity of fibrosis, abdominal MR imaging combined with MR elastography is a powerful clinical tool to help diagnose NAFLD and advanced fibrosis and may facilitate future research as a noninvasive yet accurate end point in therapeutic trials.
Advances in Knowledge.
• When liver biopsy was used as the reference standard, MR elastography exhibited superior performance characteristics (AUROC of 0.954) in assessing fibrosis compared with laboratory noninvasive marker panels (highest AUROC of 0.829 for FIB-4) in patients with nonalcoholic fatty liver disease (NAFLD).
• When MR elastography was used as a reference standard to diagnose advanced liver fibrosis, two noninvasive marker panels, namely, FIB-4 score and NAFLD fibrosis score, performed consistently better than others (negative predictive value: 90.0% for NAFLD fibrosis score, 89.9% for FIB-4; positive predictive value: 76.9% for FIB-4, 66.3% for NAFLD fibrosis score).
• MR imaging combined with MR elastography is an effective noninvasive means to diagnose hepatic steatosis and fibrosis.
Implication for Patient Care.
• Abdominal MR imaging combined with MR elastography is a powerful clinical tool to diagnose NAFLD and advanced fibrosis and may facilitate future research as a noninvasive yet accurate end point in therapeutic trials.
Disclosures of Conflicts of Interest: D.K. No relevant conflicts of interest to disclose. W.R.K. Financial activities related to the present article: none to disclose. Financial activities not related to the present article: author is consultant for Gilead Sciences and Bristol-Myers; institution has grant from Abbott. Other relationships: none to disclose. J.A.T. No relevant conflicts of interest to disclose. H.J.K. No relevant conflicts of interest to disclose. R.L.E. Financial activities related to the present article: none to disclose. Financial activities not related to the present article: author and institution have intellectual property rights related to some of the technology used in this study and a financial interest related to its dissemination; institution receives royalties from GE Healthcare. Other relationships: none to disclose.
Supplementary Material
Received May 31, 2012; revision requested July 30; revision received October 8; accepted October 31; final version accepted January 17, 2013.
Supported by a grant from the GlaxoSmithKline Research Fund of the Korean Association for the Study of the Liver.
Funding: This research was supported by the National Institutes of Health (grants EB010393, EB001981, and UL1 RR024150).
Abbreviations:
- ALT
- alanine aminotransferase
- APRI
- aspartate aminotransferase–to-platelet ratio index
- AST
- aspartate aminotransferase
- AUROC
- area under the receiver operating characteristic
- NAFLD
- nonalcoholic fatty liver disease
References
- 1.Browning JD, Szczepaniak LS, Dobbins R, et al. Prevalence of hepatic steatosis in an urban population in the United States: impact of ethnicity. Hepatology 2004;40(6):1387–1395 [DOI] [PubMed] [Google Scholar]
- 2.Guha IN, Parkes J, Roderick P, et al. Noninvasive markers of fibrosis in nonalcoholic fatty liver disease: validating the European Liver Fibrosis Panel and exploring simple markers. Hepatology 2008;47(2):455–460 [DOI] [PubMed] [Google Scholar]
- 3.Charlton M. Nonalcoholic fatty liver disease: a review of current understanding and future impact. Clin Gastroenterol Hepatol 2004;2(12):1048–1058 [DOI] [PubMed] [Google Scholar]
- 4.Adams LA, Lymp JF, St Sauver J, et al. The natural history of nonalcoholic fatty liver disease: a population-based cohort study. Gastroenterology 2005;129(1):113–121 [DOI] [PubMed] [Google Scholar]
- 5.Piccinino F, Sagnelli E, Pasquale G, Giusti G. Complications following percutaneous liver biopsy: a multicentre retrospective study on 68,276 biopsies. J Hepatol 1986;2(2):165–173 [DOI] [PubMed] [Google Scholar]
- 6.Ratziu V, Charlotte F, Heurtier A, et al. Sampling variability of liver biopsy in nonalcoholic fatty liver disease. Gastroenterology 2005;128(7):1898–1906 [DOI] [PubMed] [Google Scholar]
- 7.Merriman RB, Ferrell LD, Patti MG, et al. Correlation of paired liver biopsies in morbidly obese patients with suspected nonalcoholic fatty liver disease. Hepatology 2006;44(4):874–880 [DOI] [PubMed] [Google Scholar]
- 8.Wieckowska A, Feldstein AE. Diagnosis of nonalcoholic fatty liver disease: invasive versus noninvasive. Semin Liver Dis 2008;28(4):386–395 [DOI] [PubMed] [Google Scholar]
- 9.Bravo AA, Sheth SG, Chopra S. Liver biopsy. N Engl J Med 2001;344(7):495–500 [DOI] [PubMed] [Google Scholar]
- 10.Yin M, Talwalkar JA, Glaser KJ, et al. Assessment of hepatic fibrosis with magnetic resonance elastography. Clin Gastroenterol Hepatol 2007;5(10):1207–1213e2. [DOI] [PMC free article] [PubMed] [Google Scholar]
- 11.Huwart L, Sempoux C, Vicaut E, et al. Magnetic resonance elastography for the noninvasive staging of liver fibrosis. Gastroenterology 2008;135(1):32–40 [DOI] [PubMed] [Google Scholar]
- 12.Muthupillai R, Lomas DJ, Rossman PJ, Greenleaf JF, Manduca A, Ehman RL. Magnetic resonance elastography by direct visualization of propagating acoustic strain waves. Science 1995;269(5232):1854–1857 [DOI] [PubMed] [Google Scholar]
- 13.Rockey DC, Bissell DM. Noninvasive measures of liver fibrosis. Hepatology 2006;43(2 Suppl 1):S113–S120 [DOI] [PubMed] [Google Scholar]
- 14.Shire NJ, Yin M, Chen J, et al. Test-retest repeatability of MR elastography for noninvasive liver fibrosis assessment in hepatitis C. J Magn Reson Imaging 2011;34(4):947–955 [DOI] [PMC free article] [PubMed] [Google Scholar]
- 15.Talwalkar JA, Yin M, Venkatesh S, et al. Feasibility of in vivo MR elastographic splenic stiffness measurements in the assessment of portal hypertension. AJR Am J Roentgenol 2009;193(1):122–127 [DOI] [PMC free article] [PubMed] [Google Scholar]
- 16.Chen J, Talwalkar JA, Yin M, Glaser KJ, Sanderson SO, Ehman RL. Early detection of nonalcoholic steatohepatitis in patients with nonalcoholic fatty liver disease by using MR elastography. Radiology 2011;259(3):749–756 [DOI] [PMC free article] [PubMed] [Google Scholar]
- 17.Kleiner DE, Brunt EM, Van Natta M, et al. Design and validation of a histological scoring system for nonalcoholic fatty liver disease. Hepatology 2005;41(6):1313–1321 [DOI] [PubMed] [Google Scholar]
- 18.Wai CT, Greenson JK, Fontana RJ, et al. A simple noninvasive index can predict both significant fibrosis and cirrhosis in patients with chronic hepatitis C. Hepatology 2003;38(2):518–526 [DOI] [PubMed] [Google Scholar]
- 19.Harrison SA, Oliver D, Arnold HL, Gogia S, Neuschwander-Tetri BA. Development and validation of a simple NAFLD clinical scoring system for identifying patients without advanced disease. Gut 2008;57(10):1441–1447 [DOI] [PubMed] [Google Scholar]
- 20.Sterling RK, Lissen E, Clumeck N, et al. Development of a simple noninvasive index to predict significant fibrosis in patients with HIV/HCV coinfection. Hepatology 2006;43(6):1317–1325 [DOI] [PubMed] [Google Scholar]
- 21.Angulo P, Hui JM, Marchesini G, et al. The NAFLD fibrosis score: a noninvasive system that identifies liver fibrosis in patients with NAFLD. Hepatology 2007;45(4):846–854 [DOI] [PubMed] [Google Scholar]
- 22.Obuchowski NA. Estimating and comparing diagnostic tests’ accuracy when the gold standard is not binary. Acad Radiol 2005;12(9):1198–1204 [DOI] [PubMed] [Google Scholar]
- 23.Lambert J, Halfon P, Penaranda G, Bedossa P, Cacoub P, Carrat F. How to measure the diagnostic accuracy of noninvasive liver fibrosis indices: the area under the ROC curve revisited. Clin Chem 2008;54(8):1372–1378 [DOI] [PubMed] [Google Scholar]
- 24.Poynard T, Halfon P, Castera L, et al. Standardization of ROC curve areas for diagnostic evaluation of liver fibrosis markers based on prevalences of fibrosis stages. Clin Chem 2007;53(9):1615–1622 [DOI] [PubMed] [Google Scholar]
- 25.Lassailly G, Caiazzo R, Hollebecque A, et al. Validation of noninvasive biomarkers (FibroTest, SteatoTest, and NashTest) for prediction of liver injury in patients with morbid obesity. Eur J Gastroenterol Hepatol 2011;23(6):499–506 [DOI] [PubMed] [Google Scholar]
- 26.Sasso M, Tengher-Barna I, Ziol M, et al. Novel controlled attenuation parameter for noninvasive assessment of steatosis using Fibroscan(®): validation in chronic hepatitis C. J Viral Hepat 2012;19(4):244–253 [DOI] [PubMed] [Google Scholar]
- 27.Steyerberg EW, Bleeker SE, Moll HA, Grobbee DE, Moons KG. Internal and external validation of predictive models: a simulation study of bias and precision in small samples. J Clin Epidemiol 2003;56(5):441–447 [DOI] [PubMed] [Google Scholar]
- 28.Steyerberg EW, Harrell FE, Jr, Borsboom GJ, Eijkemans MJ, Vergouwe Y, Habbema JD. Internal validation of predictive models: efficiency of some procedures for logistic regression analysis. J Clin Epidemiol 2001;54(8):774–781 [DOI] [PubMed] [Google Scholar]
- 29.DeLong ER, DeLong DM, Clarke-Pearson DL. Comparing the areas under two or more correlated receiver operating characteristic curves: a nonparametric approach. Biometrics 1988;44(3):837–845 [PubMed] [Google Scholar]
- 30.Regev A, Berho M, Jeffers LJ, et al. Sampling error and intraobserver variation in liver biopsy in patients with chronic HCV infection. Am J Gastroenterol 2002;97(10):2614–2618 [DOI] [PubMed] [Google Scholar]
- 31.Oudry J, Chen J, Glaser KJ, Miette V, Sandrin L, Ehman RL. Cross-validation of magnetic resonance elastography and ultrasound-based transient elastography: a preliminary phantom study. J Magn Reson Imaging 2009;30(5):1145–1150 [DOI] [PMC free article] [PubMed] [Google Scholar]
- 32.Nguyen D, Talwalkar JA. Noninvasive assessment of liver fibrosis. Hepatology 2011;53(6):2107–2110 [DOI] [PubMed] [Google Scholar]
- 33.Motosugi U, Ichikawa T, Amemiya F, et al. Cross-validation of MR elastography and ultrasound transient elastography in liver stiffness measurement: discrepancy in the results of cirrhotic liver. J Magn Reson Imaging 2012;35(3):607–610 [DOI] [PubMed] [Google Scholar]
- 34.Martínez SM, Crespo G, Navasa M, Forns X. Noninvasive assessment of liver fibrosis. Hepatology 2011;53(1):325–335 [DOI] [PubMed] [Google Scholar]
- 35.Poynard T, de Ledinghen V, Zarski JP, et al. Relative performances of FibroTest, Fibroscan, and biopsy for the assessment of the stage of liver fibrosis in patients with chronic hepatitis C: a step toward the truth in the absence of a gold standard. J Hepatol 2012;56(3):541–548 [DOI] [PubMed] [Google Scholar]
- 36.Gaia S, Carenzi S, Barilli AL, et al. Reliability of transient elastography for the detection of fibrosis in non-alcoholic fatty liver disease and chronic viral hepatitis. J Hepatol 2011;54(1):64–71 [DOI] [PubMed] [Google Scholar]
- 37.Castéra L, Foucher J, Bernard PH, et al. Pitfalls of liver stiffness measurement: a 5-year prospective study of 13,369 examinations. Hepatology 2010;51(3):828–835 [DOI] [PubMed] [Google Scholar]
- 38.Myers RP, Pomier-Layrargues G, Kirsch R, et al. Feasibility and diagnostic performance of the FibroScan XL probe for liver stiffness measurement in overweight and obese patients. Hepatology 2012;55(1):199–208 [DOI] [PubMed] [Google Scholar]
- 39.Faria SC, Ganesan K, Mwangi I, et al. MR imaging of liver fibrosis: current state of the art. RadioGraphics 2009;29(6):1615–1635 [DOI] [PMC free article] [PubMed] [Google Scholar]
- 40.Hines CD, Bley TA, Lindstrom MJ, Reeder SB. Repeatability of magnetic resonance elastography for quantification of hepatic stiffness. J Magn Reson Imaging 2010;31(3):725–731 [DOI] [PMC free article] [PubMed] [Google Scholar]
Associated Data
This section collects any data citations, data availability statements, or supplementary materials included in this article.