The agreement of the presented results with the previous understanding of regional differences in lung expansion, lung density measures, regional ventilation, and anatomic orientation strengthens the hypothesis that apparent diffusion coefficients obtained at hyperpolarized helium 3 MR imaging can help measure alveolar size.
Abstract
Purpose:
To evaluate the effects of lung volume differences on apparent diffusion coefficient (ADC) measurements on a regional basis, with breath holds at volumes adjusted for differences in lung size across individuals according to the subject’s vital capacity (VC).
Materials and Methods:
This study was approved by the local institutional review board and was compliant with HIPAA. Informed consent was obtained from all subjects. Imaging was performed under a physician’s Investigational New Drug application from the Food and Drug Administration. ADC changes as a function of inflation levels were evaluated in 24 healthy never-smokers across three lung volumes (20%, 60%, and 100% VC) on the basis of the spirometric data collected from each subject. Response variables based on lung volume and anatomic position were assessed with multifactorial analysis of variance followed by posthoc pair-wise testing. Imaging was performed with a 1.5-T magnetic resonance (MR) unit with use of a two-dimensional gradient-echo fast low-angle shot sequence.
Results:
Significant differences in ADCs between lung volumes were observed for all inflation levels (20%, 60%, and 100% VC; P < .001), along with significant dependent-nondependent vertical gradients at 20% VC (P < .0001) and 60% VC (P < .0001, left lung only). In addition, significant differences between mean values in the left and right lungs with respect to those in the whole lung were observed at the lower lung inflation levels (20% and 60% VC, P < .01), reaching more uniform expansion at 100% VC.
Conclusion:
The results confirm known anatomic differences in patterns of regional inflation and ventilation with corresponding lung volume changes, emphasizing the need for tight control over lung volume when performing hyperpolarized helium 3 (3He) lung studies if 3He MR imaging is to be used to follow up small longitudinal changes in lung abnormalities.
© RSNA, 2013
Introduction
Hyperpolarized helium 3 (3He) magnetic resonance (MR) imaging has emerged as a complex, yet noninvasive, imaging method for the assessment of regional pulmonary structure and function (1–4). Because of the inherent radiation-free nature of this imaging modality, there is considerable interest in applying this technique to study multiple measures at a given encounter or across multiple encounters. Diffusion-weighted 3He MR imaging enables evaluation and probing of the peripheral air spaces at the level of the conducting airways and acini, leading to an assessment of the integrity and size of such structures through the exploitation of the highly diffusive nature of 3He (1,2,5,6). Apparent diffusion coefficients (ADCs) and respective maps of fully inflated lungs of healthy subjects are relatively homogeneous, and this uniformity is a hallmark of the normal lung, demonstrating regional confinement by the lungs’ microstructure (6–9). ADC maps in patients with emphysema have been shown to be nonuniform and to contain larger diffusion values (2,5,10,11), correlating well with the onset and progression of the disease, where the degree and location of destruction varies throughout the lung (8,12–15). Similarly, the choice of variables such as gradient strength, duration, and time between pulses to induce the diffusion sensitization has been shown to induce variability in the observed ADCs (14). It is believed that the wide range of ADCs observed in healthy subjects may be due in part to inconsistencies regarding lung volumes at which imaging has been performed, as well as choice of gradients and b value settings, given the lack of lung volume and imaging protocol standardization between groups.
Quantitative multidetector computed tomography (CT)–based lung density measurements have been shown to significantly vary with changes in inflation levels and posture, thus playing an important role in quantification of disease and disease progression monitoring (16,17). In combination with the nonlinear characteristics of the pressure-volume curve of the lungs, it would seem logical that the same issues will apply to the assessment of the lung with polarized gas MR imaging to ensure standardization of acquisitions and resultant evaluations.
Differences across time, such as a change in lung density as an index of chronic obstructive pulmonary disease progression, can be small (18,19) and on the order of 2 HU per year. Thus, it is important to understand how lung volume during imaging affects the hyperpolarized 3He ADCs if they are to be used to assess regional and longitudinal pathologic changes. The findings by Diaz et al (20) demonstrated the sensitivity of ADC to small (6%–8%) changes in lung volume. The work presented herein builds on that of Diaz et al (20) by evaluating the dependence of ADC measurements on lung inflation levels at carefully controlled lung volumes between 20% and 100% of vital capacity (VC). We performed this study to evaluate effects of lung volume differences on ADC measurements on a regional basis, with breath holds at volumes adjusted for differences in lung size across individuals according to the subject’s VC.
Materials and Methods
This study was approved by the local institutional review board and was compliant with Health Insurance Portability and Accountability Act policies. Informed consent was obtained from all subjects. All imaging examinations were carried out under a physician’s Investigational New Drug application from the U.S. Food and Drug Administration.
Subject Population
Twenty-four healthy never-smokers were recruited for this study and imaged at 20%, 60%, and 100% VC. Subjects ranged in age from 23 to 70 years (Table 1). All subjects underwent pulmonary function testing to verify that they were indeed healthy (forced expiratory volume in 1 second and forced vital capacity, >80% predicted; ratio of forced expiratory volume in 1 second to forced vital capacity, >0.7) and spirometry for lung volume calculations. Subjects also underwent three or four slow VC maneuvers in the supine position on the imager table. Six subjects were studied on the same day for a separate institutional review board–approved study evaluating multidetector CT scans obtained under volumetric control (21) at 100% and 20% VC. These six subjects ranged in age from 23 to 57 years (mean age ± standard deviation, 40.0 years ± 14.1; mean weight, 71.9 kg ± 13.4; mean height, 170.3 cm ± 10).
Table 1.
Summary of Demographic Characteristics
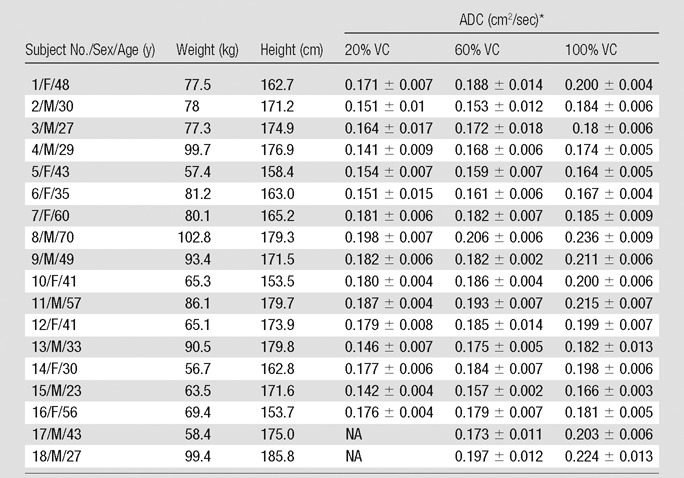
Note.—Six of the 24 subjects were excluded from the study because of lack of complete data. Mean age was 44.2 years ± 10.1 for women and 39.7 years ± 16.9 for men, mean weight was 69.1 kg ± 9.7 for women and 86.4 kg ± 13.0 for men, and mean height was 161.7 cm ± 6.6 for women and 175.6 cm ± 3.8 for men (obtained in only 16 subjects; subjects 17 and 18 were eliminated owing to differences in breath-hold initiation). No adverse side effects were observed for any of the imaged population, including the six subjects who were not included in the analysis. NA = not applicable
Data are means ±standard deviation.
Imaging
Imaging was performed with a clinical, broadband-capable, 1.5-T MR unit (Avanto; Siemens, Erlangen, Germany). A flexible, vestlike coil (Clinical MR Imaging Solutions, Milwaukee, Wis) tuned to the Larmor frequency of 3He (48.4676 MHz) was used to transmit and receive radiofrequency pulses for imaging. Physiologic monitoring consisted of heart rate, noninvasive blood pressure, and pulse oximetry measurements. Imaging breath holds were conducted at three lung volumes (20%, 60%, and 100% VC). A proton localizer image and a hyperpolarized 3He image were obtained for each volume, for a total of six volume-controlled breath holds during a given session.
Axial 3He images were acquired with a two-dimensional fast low-angle shot sequence (repetition time, 86 msec; echo time, 6.92 msec; 15-second breath hold; 128 × 128 acquisition matrix; 7° flip angle; six baseline and diffusion-weighted 15-mm-thick sections; ∼7.5-mm intersection spacing; and 2.5 × 2.5-mm pixels) modified to include a set of bipolar gradients for diffusion sensitization (b value, 1.15 sec/cm2; rise time, 250 μsec; plateau time, 1250 μsec; fall time, 250 μsec; amplitude, 15.8 mT/m). The imaging field of view was set to approximate the same positioning of the acquired ADC maps with respect to the apical-basal (between apex and top of diaphragm) lung coverage for all acquired lung volumes.
Polarization and Doses
3He was polarized with spin-exchange optical pumping by using a polarizer (GE Healthcare, Princeton, NJ), generating 1.0 L at polarization levels of 38%–42%. Administered doses consisted of approximately 300 mL of 3He and 700 mL of medical-grade nitrogen in a 1.0-L Tedlar bag (E.I. DuPont de Nemours, Wilmington, Del) fitted with ½-inch–inner diameter Tygon tubing (Saint-Gobain Performance Plastics, Akron, Ohio), allowing for the conduction of three 3He breath-hold maneuvers.
Volume Control
The desired lung inflation levels were achieved with use of a single 7.0–8.0-L Tedlar bag connected to a mouthpiece and prefilled with the desired inflation volume (percentage VC) of air by using a calibration syringe (Hans Rudolph, Shawnee, Kan), thus acting as an inspiratory reserve. A bacterial filter and an MR imaging–compatible spirometer were placed between the mouthpiece and Tedlar bag to help eliminate any harmful bacteria and calculate delivered volumes, respectively. In the case of a proton localizer image, the Tedlar bag used to deliver an inspiratory volume needed to achieve a given percentage VC was filled with a volume of room air to achieve the desired lung inflation level (20%, 60%, or 100% VC; 20% VC approximates functional residual capacity [FRC], and 100% VC is, by definition, equal to total lung capacity). Subjects performed a series of breathing maneuvers with expiration down to residual volume (RV) and at the last expiration were instructed to completely inspire the volume within the inspiratory bag and hold their breath for the duration of image acquisition. In the case of a 3He image, the volume within the inspiratory bag necessary to reach the proper inflation level was 1.0 L less to allow room for the addition of the 3He dose. Once the volume within the inspiratory bag was completely inspired, the subjects were instructed to hold their breath, release the mouthpiece, and then complete the inspiratory process by inhaling the 1.0-L 3He dose. Two subjects were instructed to initiate breathing maneuvers from FRC rather than RV and were imaged at 60% and 100% of their respective VC to illustrate differences in regional expansion with breath-hold initiation. With three breath holds in each of the 22 subjects and two breath holds in two others, a total of 70 breath-hold maneuvers were evaluated with our volume control method.
Image Analysis
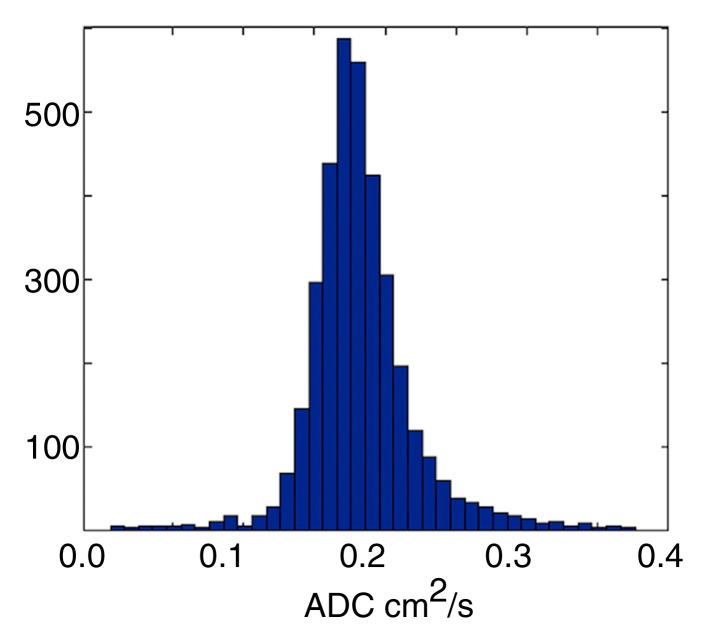
All analyses were carried out with automated in-house scripts written in MATLAB (Mathworks, Natick, Mass). Gravitationally dependent (posterior) and nondependent (anterior) regions were determined by equally dividing the lung along the anteroposterior (front-back) axis, whereas apical and basal regions were determined by splitting the field of view along the superior-inferior (craniocaudal) axis, such that the first three sections represent the apical regions and the last three represent the basal ones. Given the unitless nature of the acquired signals and the dependence on the actual signal intensities collected, all calculations were based on the offline reconstructed raw data sections instead of their Digital Imaging and Communications in Medicine equivalents. Assuming a monoexponential model of diffusion, ADC calculations were achieved on a pixel-by-pixel basis by using a b value of 0 and 1.15 sec/cm2 for the baseline and diffusion-weighted images, respectively. Pixels with signal intensities less than three times the standard deviation of the background noise were excluded by means of thresholding. Manual segmentation was performed on all sections to ensure proper determination of the lung field of view and to eliminate the influence of the trachea and major airways from the evaluated regions. The process and a sample ADC map along with corresponding histogram are illustrated in Figure 1.
Figure 1a:
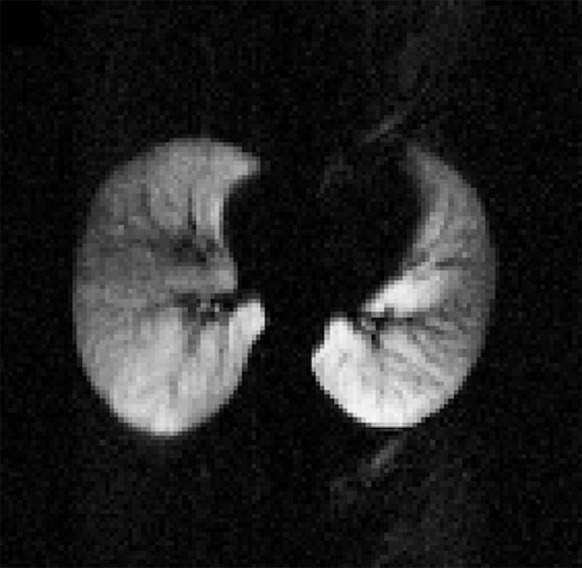
(a) Sample diffusion-weighted 3He image, (b) image mask, (c) resultant ADC map, and (d) histogram representation of ADC distribution within generated map, excluding airways. Numbers on vertical axis of histogram are numbers of occurrences.
Figure 1b:

(a) Sample diffusion-weighted 3He image, (b) image mask, (c) resultant ADC map, and (d) histogram representation of ADC distribution within generated map, excluding airways. Numbers on vertical axis of histogram are numbers of occurrences.
Figure 1c:
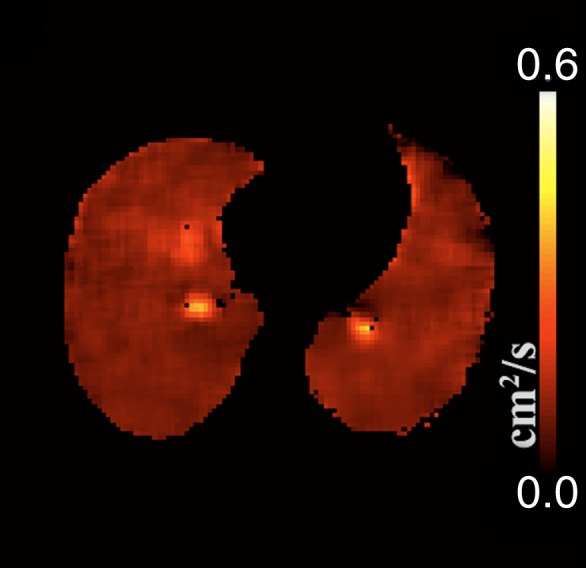
(a) Sample diffusion-weighted 3He image, (b) image mask, (c) resultant ADC map, and (d) histogram representation of ADC distribution within generated map, excluding airways. Numbers on vertical axis of histogram are numbers of occurrences.
Figure 1d:
(a) Sample diffusion-weighted 3He image, (b) image mask, (c) resultant ADC map, and (d) histogram representation of ADC distribution within generated map, excluding airways. Numbers on vertical axis of histogram are numbers of occurrences.
Verification of Lung Volume and Breath-hold Protocols
Postinspiration lung volumes were verified by performing manual segmentation of the corresponding proton MR images (20% and 100% VC) in the six test subjects with corresponding multidetector CT studies. Lungs were automatically segmented from within the multidetector CT image data sets by using an in-house software package (Pulmonary Analysis Software Suite or PASS) (22), and the resultant lung volumes were compared with the MR imaging–derived lung volumes, matching appropriate VC levels.
Statistical Analysis
Response variables based on percentage VC, apical-basal, left-right, and dependent-nondependent mean ADCs were examined by means of analysis of variance, with use of percentage VC plus apical-basal location, percentage VC plus left-right location, and percentage VC plus left-right and dependent-nondependent locations as factors. Posthoc pair-wise Tukey honestly significant difference testing was performed to establish significance of individual factors. Gravitational mean differences in the two subjects assessed from FRC were evaluated with two-sided paired t tests. All analyses were performed in JMP (SAS Institute, Cary, NC) and R (version CRAN v2.9.2; http://www.r-project.org/). Results were considered statistically significant when the probability of making a type I error (false-positive finding) was less than 5% (P < .05).
Results
Lung Volume and Breath-hold Verification
With a measure of total lung volume, defined as the sum of all voxel volumes within the generated segmentation masks, the segmentation-based volumes from MR imaging were consistently lower than their multidetector CT counterparts (mean difference in FRC difference, 193 mL ± 230 [8.13% ± 10.57]; mean difference in total lung capacity [100% VC], 145 mL ± 130 [2.85% ± 2.61]) in the six subjects for whom both MR imaging and multidetector CT data were available. Lung volumes differences measured at 20% VC were higher than those measured at 100% VC.
ADC versus Lung Volume
In eight of the 70 breath holds (11%), there was a study failure related to one or more causes, including failure of the subject to remain apneic during imaging or to comply with breathing instructions. As a result of these failures, six subjects were excluded from the study because of lack of complete data. The main analysis inclusion criterion was the successful completion of all three lung inflation level breath holds to facilitate an unbiased assessment of the ADC differences observed as a function of varying lung inflation levels. Therefore, analysis was limited to 18 of the 24 subjects (Table 1). No adverse side effects or unexpected physiologic changes of clinical consequence were observed.
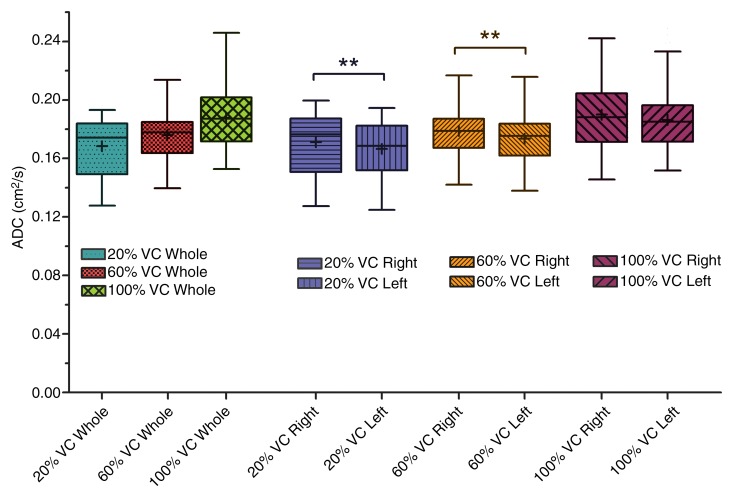
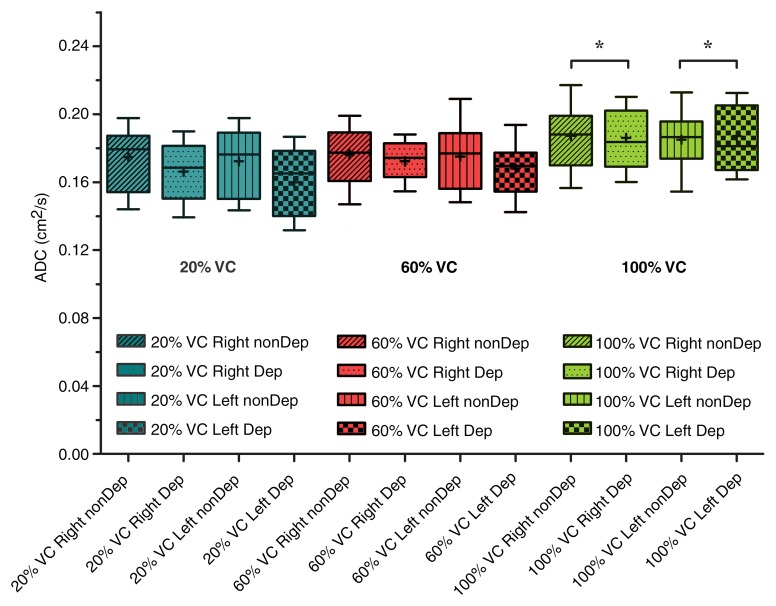
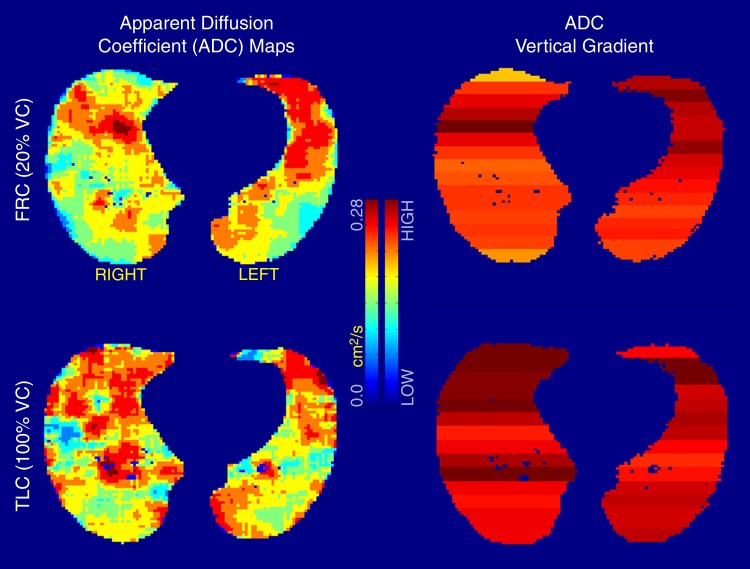
Analysis of variance illustrated statistically significant differences in mean ADCs between lung inflation levels (20%, 60%, and 100% VC) (P < .001), left-right lungs (P < .01), and gravitational dependence (P < .001). Summary statistics of the observed differences with posthoc pairwise testing are shown in Table 2. Whole-lung mean ADCs were significantly smaller at 20% VC compared with 60% and 100% VC (P < .01 and P < .001, respectively; Fig 2). In addition, the values at 60% VC were significantly smaller than those at 100% VC (P < .001). Significant differences in left-right lung mean ADCs were observed only for the 20% and 60% VC volumes, where the mean ADCs in the right lung were significantly larger than those in the left lung. This difference was eliminated at the 100% VC volume. Furthermore, gravitationally dependent regions had significantly smaller mean ADCs compared with nondependent regions at the 20% and 60% VC volumes (Fig 3). This difference was not seen at 100% VC, signifying a more homogeneous distribution of lung expansion in line with previous reports (16,17,23). The presence of vertical ADC gradients at 20% VC and their significant reduction at 100% VC are visually demonstrated in Figure 4. The left panel shows maps in which the raw voxel-by-voxel ADCs are color coded, and the right panel shows maps in which the ADCs are color coded as a mean value for a given vertical lung height. Clustering of the data was achieved by using five bins, encompassing the minimum and maximum ADCs apparent within (24). With respect to apical-basal lung regions, no differences in mean ADCs were observed at any lung volume. In the two subjects who underwent imaging at 60% and 100% VC following inspiration of 3He from FRC as opposed to RV, an opposite vertical (nondependent-dependent) trend in expansion was observed, where mean ADCs in the dependent regions were larger than their nondependent counterparts (P < .05).
Table 2.
Regional Mean ADC Differences as a Function of Anatomic Location and Percentage VC
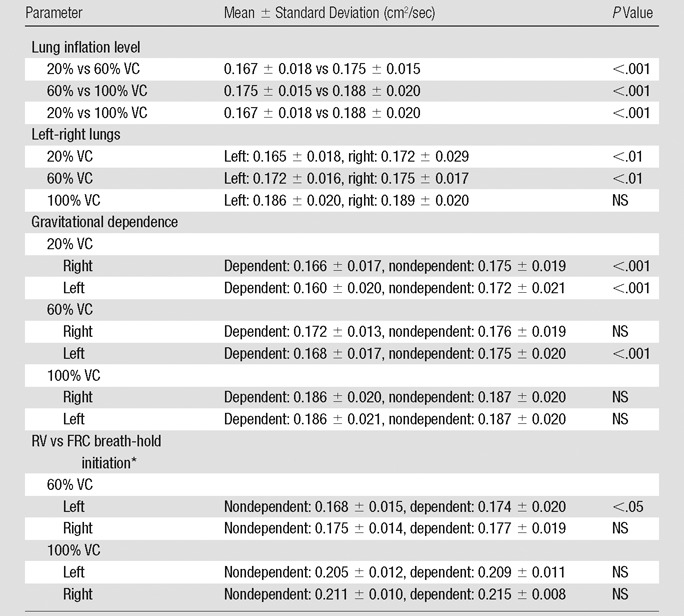
Note.—With respect to apical-basal lung regions, no differences in mean ADCs were observed at any lung volume. NS = not significant.
Data were obtained in the two subjects who underwent imaging at 60% and 100% VC following inspiration of 3He from FRC as opposed to RV.
Figure 2:
Aggregate mean ADCs of whole, left, and right lungs for all 16 subjects as a function of percentage VC. For whole lung, ADCs significantly increased with each inflation step from 20% VC to 60% VC to 100% VC. There was a significant difference (**) between right and left lung ADCs at both 20% VC and 60% VC lung inflation steps. At the 100% VC lung inflation step, lung was uniformly expanded and there were no right versus left lung ADC differences. Boundaries of box are maximum and minimum (top and bottom, respectively), whiskers are 10th and 90th percentiles (top and bottom, respectively), line within box is median, and + within box is mean.
Figure 3:
Box plots demonstrate dependent (Dep) versus nondependent (nonDep) difference in ADCs as a function of anatomic lung position. Differences for both right and left lungs are significant at both 20% and 60% VC lung inflation levels. There was loss of significance (*) at full lung inflation (100% VC). Boundaries of box are maximum and minimum (top and bottom, respectively), whiskers are 10th and 90th percentiles (top and bottom, respectively), line within box is median, and + within box is mean.
Figure 4:
ADC maps (clustered with a k-means filtering technique) at 20% VC (top) and 100% VC (bottom) in the same subject at similar anatomic locations. Observable differences are apparent between gravitationally dependent and nondependent regions in 20% VC ADC map, whereas a more homogeneous distribution of ADCs is observed at 100% VC. ADC scale ranges from 0 to 0.28 cm2/sec. TLC = total lung capacity.
Discussion
ADCs significantly increase with increasing lung inflation levels, whereas differences between the different gravitational lung regions decrease owing to a trend toward more uniform alveolar expansion at higher inflations, as previously reported with volumetric CT (16,17). ADCs throughout both lungs become more homogeneous at 100% VC. This is in agreement with findings by Chevalier et al (23), who observed that the lung is fully expanded at total lung capacity with biplanar radiography and implanted metallic markers. Although not unexpected, these data demonstrate the importance of adhering to a consistent well-controlled lung inflation protocol when tracking changes in ADCs over time.
Milic-Emili et al (25) demonstrated that the relationship between regional lung expansion with respect to overall lung expansion is nonuniform, where the nondependent lung regions were relatively more expanded than their dependent counterparts at all lung inflation levels except at 100% VC. Furthermore, for lung inflation levels between 20% and 100% VC (FRC and total lung capacity), the dependent lung region was found to receive a larger proportion of the inspired volume with respect to nondependent regions. Similar to the observations in the current study, this relationship is reversed for lung inflation levels between 0% and 20% VC (RV and FRC), where nondependent lung regions received a higher proportion of the inspired volume (25,26). Again, data in the current study, in agreement with previous physiologic findings, demonstrate the importance of a precisely defined inhalation protocol when seeking to track small changes over time.
The differences between gravitationally dependent and nondependent mean ADCs as a function of lung inflation levels are consistent with the findings of Hoffman (16) and Hoffman and Ritman (17) in supine anesthetized canines. In those studies, a dependent to nondependent gradient in CT lung air content that diminished with increasing lung inflation levels was observed. Furthermore, with use of proton MR imaging, Hatabu et al (27) illustrated a greater relative proton density in dependent regions in healthy subjects in the supine position. In a recent study evaluating ADCs in a cohort of healthy subjects and patients with chronic obstructive pulmonary disease with use of hyperpolarized xenon 129 (28), prominent gravitationally based gradients were observed in the healthy subjects, in agreement with our observations with hyperpolarized 3He ADC. The use of a standardized breath-hold protocol in healthy subjects and patients with chronic obstructive pulmonary disease resulted in the elimination of the gravitationally based gradients in the latter group (28).
Hoffman and Ritman (17) demonstrated that support of the heart by the lung may serve to alter regional lung expansion at low lung volumes and, thus, the distribution of an inspired gas; this support is altered with body posture. The left-right differences are small; however, when one is following disease progression longitudinally, the changes of interest are small. Thus, care must be taken to ensure similar lung volume and posture so as not to confound measurements of abnormality with differences due to varying lung volumes. Albert and Hubmayr (29) have also demonstrated that a shift in body posture alters compression of the lung by the heart, and this postural effect has been confirmed by Fichele et al (11) with use of ADC as a tool. It is likely that the left-right lung differences found in our study at 20% and 60% VC are an index of the variable effect of the heart on the lung. Similarly, computational fluid dynamics simulations have suggested increased flow patterns in the right lung airway geometries with respect to the left equivalents, possibly owing to differences in airway geometries between the two main branches (30).
In this study, we present a standardized lung volume approach that can maximize the sensitivity of the ADC protocol in the detection of yearly disease progression. Although a limitation of this study was that some subjects had difficulties adhering to the breathing protocol, recent experience in our laboratory with healthy smokers and subjects with chronic obstructive pulmonary disease has shown that these issues can be minimized with proper coaching, including a preimaging practice session, and sufficient rest periods between breathing maneuvers. Despite its complex nature, the breath-hold protocol presented herein was designed as an inexpensive measure of controlling lung volumes. When conducting ADC examinations and/or evaluating the distribution of an exogenous gaseous agent in the lungs, the desired breath-hold volume at which imaging is performed should be determined before imaging. If one is to evaluate air trapping as an index of peripheral airway disease, volumes at the lower end of the VC are of interest. Conversely, if a peripheral lung structure is of interest, then volumes at the upper end of the VC are of interest. A practical solution for obtaining the desired lung volume is to mix the desired hyperpolarized 3He doses in an anoxic nitrogen mixture such that the desired VC is reached upon inhalation of a predetermined volume from RV or FRC. It should be noted that inhalation from RV or FRC will result in different gravitational distribution of the gas (25). The choice of b value during imaging is a determining factor in the resultant diffusion sensitization and signal attenuation (31,32). In this study, the choice of a slightly lower b value than that presented in the literature resulted in an overall larger ADC throughout.
In summary, the agreement of the presented results with the previous understanding of regional differences in lung expansion, lung density measures, regional ventilation, and anatomic orientation strengthens the hypothesis that ADCs obtained at hyperpolarized 3He MR imaging help measure alveolar size. As illustrated, volumetric control of lung inflation levels is essential to the hyperpolarized 3He ADC method if it is to be used to monitor subjects and disease progression over time, and similar care should be taken into consideration for functional imaging protocols in which exogenous contrast material is used to image lung function and structure. Careful consideration of the lung inflation levels during all MR imaging–based lung structure and function assessments performed with exogenous and endogenous contrast material must be integrated into imaging protocols if imaging is to offer an outcome measure that reduces the time to evaluate new interventions, compared with the current reliance on pulmonary function tests.
Advances in Knowledge.
• A positive semilinear relationship exists between apparent diffusion coefficients (ADCs) at hyperpolarized helium 3 (3He) MR imaging and lung inflations, where gravitationally dependent-nondependent vertical gradients are eliminated as a function of increasing lung inflation levels (20% vital capacity [VC], P < .001; 60% VC, P <.001 [left lung only]; 100% VC, P > .05), reaching uniform alveolar expansion at total lung capacity.
• ADC changes as a function of lung inflation levels adhere to previously demonstrated lung ventilation and expansion criterion (mean ADC: 0.167 cm2/sec at 20% VC, 0.175 cm2/sec at 60% VC, and 0.188 cm2/sec at 100% VC), strengthening the hypothesis that hyperpolarized 3He ADC MR imaging with a single b value can help measure alveolar size.
• Lung inflation levels with the hyperpolarized 3He method and other exogenously enhanced functional lung imaging techniques should be taken into consideration if they are to be used to monitor regional and longitudinal pathologic changes (whole mean values, P < .001; left-right mean values, P < .01 [20% and 60% VC only]; gravitationally dependent-nondependent mean values, P < .001 [20% VC in left and right lungs and 60% VC in left lung]).
Implication for Patient Care.
• Volumetric control and standardization of lung inflation levels at hyperpolarized gas imaging are important for properly assessing regional lung structure; this should be taken into consideration at the time of imaging to standardize measurements across individuals and ensure sensitivity of changes measured within an individual across time.
Disclosures of Conflicts of Interest: A.F.H. No relevant conflicts of interest to disclose. E.A.H. Financial activities related to the present article: none to disclose. Financial activities not related to the present article: owns stock/stock options in VIDA Diagnostics. Other relationships: none to disclose. D.R.T. No relevant conflicts of interest to disclose. M.K.F. No relevant conflicts of interest to disclose. J.P.S. No relevant conflicts of interest to disclose. E.J.R.v.B. Financial activities related to the present article: none to disclose. Financial activities not related to the present article: is employed by QCTIS. Other relationships: none to disclose.
Acknowledgments
We thank Siemens Medical for their continued MR support, GE Healthcare for their polarization support, and Linde Gases (formerly Spectra Gases) for the 3He gas supply. We also thank Joanie Wilson, BA, and John H. Morgan. BA, for their efforts in subject recruitment, pulmonary function testing, and training of subjects before and during imaging sessions.
Current address: Clinical Research Imaging Centre, Queen’s Medical Research Institute, University of Edinburgh, Edinburgh, Scotland.
Received January 2, 2012; revision requested January 22; revision received June 17; accepted September 5; final version accepted January 10, 2013.
Funding: This research was supported by the National Institutes of Health (grant RO1-HL-064368).
Abbreviations
- ADC
- apparent diffusion coefficient
- FRC
- functional residual capacity
- RV
- residual volume
- VC
- vital capacity
References
- 1.Fain SB, Korosec FR, Holmes JH, O’Halloran R, Sorkness RL, Grist TM. Functional lung imaging using hyperpolarized gas MRI. J Magn Reson Imaging 2007;25(5):910–923 [DOI] [PubMed] [Google Scholar]
- 2.Kauczor HU, Chen XJ, van Beek EJ, Schreiber WG. Pulmonary ventilation imaged by magnetic resonance: at the doorstep of clinical application. Eur Respir J 2001;17(5):1008–1023 [DOI] [PubMed] [Google Scholar]
- 3.Salerno M, Altes TA, Mugler JP, III, Nakatsu M, Hatabu H, de Lange EE. Hyperpolarized noble gas MR imaging of the lung: potential clinical applications. Eur Radiol 2001;40(1):33–44 [DOI] [PubMed] [Google Scholar]
- 4.MacFall JR, Charles HC, Black RD, et al. Human lung air spaces: potential for MR imaging with hyperpolarized He-3. Radiology 1996;200(2):553–558 [DOI] [PubMed] [Google Scholar]
- 5.Schreiber WG, Morbach AE, Stavngaard T, et al. Assessment of lung microstructure with magnetic resonance imaging of hyperpolarized helium-3. Respir Physiol Neurobiol 2005;148(1-2):23–42 [DOI] [PubMed] [Google Scholar]
- 6.Conradi MS, Yablonskiy DA, Woods JC, et al. 3He diffusion MRI of the lung. Acad Radiol 2005;12(11):1406–1413 [DOI] [PMC free article] [PubMed] [Google Scholar]
- 7.Evans A, McCormack D, Ouriadov A, Etemad-Rezai R, Santyr G, Parraga G. Anatomical distribution of 3He apparent diffusion coefficients in severe chronic obstructive pulmonary disease. J Magn Reson Imaging 2007;26(6):1537–1547 [DOI] [PubMed] [Google Scholar]
- 8.Morbach AE, Gast KK, Schmiedeskamp J, et al. Diffusion-weighted MRI of the lung with hyperpolarized helium-3: a study of reproducibility. J Magn Reson Imaging 2005;21(6):765–774 [DOI] [PubMed] [Google Scholar]
- 9.Morbach AE, Gast KK, Schmiedeskamp J, et al. Microstructure of the lung: diffusion measurement of hyperpolarized 3Helium [in German]. Z Med Phys 2006;16(2):114–122 [DOI] [PubMed] [Google Scholar]
- 10.Bink A, Hanisch G, Karg A, et al. Clinical aspects of the apparent diffusion coefficient in 3He MRI: results in healthy volunteers and patients after lung transplantation. J Magn Reson Imaging 2007;25(6):1152–1158 [DOI] [PubMed] [Google Scholar]
- 11.Fichele S, Woodhouse N, Swift AJ, et al. MRI of helium-3 gas in healthy lungs: posture related variations of alveolar size. J Magn Reson Imaging 2004;20(2):331–335 [DOI] [PubMed] [Google Scholar]
- 12.van Beek EJ, Dahmen AM, Stavngaard T, et al. Hyperpolarised 3He MRI versus HRCT in COPD and normal volunteers: PHIL trial. Eur Respir J 2009;34(6):1311–1321 [DOI] [PubMed] [Google Scholar]
- 13.Salerno M, de Lange EE, Altes TA, Truwit JD, Brookeman JR, Mugler JP., III Emphysema: hyperpolarized helium 3 diffusion MR imaging of the lungs compared with spirometric indexes—initial experience. Radiology 2002;222(1):252–260 [DOI] [PubMed] [Google Scholar]
- 14.Yablonskiy DA, Sukstanskii AL, Leawoods JC, et al. Quantitative in vivo assessment of lung microstructure at the alveolar level with hyperpolarized 3He diffusion MRI. Proc Natl Acad Sci U S A 2002;99(5):3111–3116 [DOI] [PMC free article] [PubMed] [Google Scholar]
- 15.Stavngaard T, Søgaard LV, Batz M, Schreiber LM, Dirksen A. Progression of emphysema evaluated by MRI using hyperpolarized (3) He (HP (3)He) measurements in patients with alpha-1-antitrypsin (A1AT) deficiency compared with CT and lung function tests. Acta Radiol 2009;50(9):1019–1026 [DOI] [PubMed] [Google Scholar]
- 16.Hoffman EA. Effect of body orientation on regional lung expansion: a computed tomographic approach. J Appl Physiol 1985;59(2):468–480 [DOI] [PubMed] [Google Scholar]
- 17.Hoffman EA, Ritman EL. Effect of body orientation on regional lung expansion in dog and sloth. J Appl Physiol 1985;59(2):481–491 [DOI] [PubMed] [Google Scholar]
- 18.Stolk J, Putter H, Bakker EM, et al. Progression parameters for emphysema: a clinical investigation. Respir Med 2007;101(9):1924–1930 [DOI] [PubMed] [Google Scholar]
- 19.Bakker ME, Putter H, Stolk J, et al. Assessment of regional progression of pulmonary emphysema with CT densitometry. Chest 2008;134(5):931–937 [DOI] [PubMed] [Google Scholar]
- 20.Diaz S, Casselbrant I, Piitulainen E, et al. Hyperpolarized 3He apparent diffusion coefficient MRI of the lung: reproducibility and volume dependency in healthy volunteers and patients with emphysema. J Magn Reson Imaging 2008;27(4):763–770 [DOI] [PubMed] [Google Scholar]
- 21.Fuld MK, Grout RW, Guo J, Morgan JH, Hoffman EA. Systems for lung volume standardization during static and dynamic MDCT-based quantitative assessment of pulmonary structure and function. Acad Radiol 2012;19(8):930–940 [DOI] [PMC free article] [PubMed] [Google Scholar]
- 22.Guo J, Fuld MK, Alford SK, Reinhardt JM, Hoffman EA. Pulmonary analysis software suite 9.0: integrating quantitative measures of function with structural analyses. First International Workshop on Pulmonary Image Processing; New York, NY, 2008; 283–292 [Google Scholar]
- 23.Chevalier PA, Rodarte JR, Harris LD. Regional lung expansion at total lung capacity in intact vs. excised canine lungs. J Appl Physiol 1978;45(3):363–369 [DOI] [PubMed] [Google Scholar]
- 24.Kirby M, Heydarian M, Svenningsen S, et al. Hyperpolarized 3He magnetic resonance functional imaging semiautomated segmentation. Acad Radiol 2012;19(2):141–152 [DOI] [PubMed] [Google Scholar]
- 25.Milic-Emili J, Henderson JA, Dolovich MB, Trop D, Kaneko K. Regional distribution of inspired gas in the lung. J Appl Physiol 1966;21(3):749–759 [DOI] [PubMed] [Google Scholar]
- 26.Milic-Emili J. Regional distribution of gas in the lung. Can Respir J 2000;7(1):71–76 [DOI] [PubMed] [Google Scholar]
- 27.Hatabu H, Alsop DC, Listerud J, Bonnet M, Gefter WB. T2* and proton density measurement of normal human lung parenchyma using submillisecond echo time gradient echo magnetic resonance imaging. Eur J Radiol 1999;29(3):245–252 [DOI] [PubMed] [Google Scholar]
- 28.Kaushik SS, Cleveland ZI, Cofer GP, et al. Diffusion-weighted hyperpolarized 129Xe MRI in healthy volunteers and subjects with chronic obstructive pulmonary disease. Magn Reson Med 2011;65(4):1154–1165 [DOI] [PMC free article] [PubMed] [Google Scholar]
- 29.Albert RK, Hubmayr RD. The prone position eliminates compression of the lungs by the heart. Am J Respir Crit Care Med 2000;161(5):1660–1665 [DOI] [PubMed] [Google Scholar]
- 30.Lambert AR, O’Shaughnessy PT, Tawhai MH, Hoffman EA, Lin CL. Regional deposition of particles in an image-based airway model: large-eddy simulation and left-right lung ventilation asymmetry. Aerosol Sci Technol 2011;45(1):11–25 [DOI] [PMC free article] [PubMed] [Google Scholar]
- 31.Altes TA, Mata J, de Lange EE, Brookeman JR, Mugler JP., III Assessment of lung development using hyperpolarized helium-3 diffusion MR imaging. J Magn Reson Imaging 2006;24(6):1277–1283 [DOI] [PubMed] [Google Scholar]
- 32.Tanoli TS, Woods JC, Conradi MS, et al. In vivo lung morphometry with hyperpolarized 3He diffusion MRI in canines with induced emphysema: disease progression and comparison with computed tomography. J Appl Physiol 2007;102(1):477–484 [DOI] [PMC free article] [PubMed] [Google Scholar]


