The results of this study show that quantitative sodium MR imaging with fluid suppression by using adiabatic inversion recovery could be a useful biomarker for detecting osteoarthritis (loss of glycosaminoglycan) in articular cartilage in vivo at 7.0 T.
Abstract
Purpose:
To assess the potential use of sodium magnetic resonance (MR) imaging of cartilage, with and without fluid suppression by using an adiabatic pulse, for classifying subjects with versus subjects without osteoarthritis at 7.0 T.
Materials and Methods:
The study was approved by the institutional review board and was compliant with HIPAA. The knee cartilage of 19 asymptomatic (control subjects) and 28 symptomatic (osteoarthritis patients) subjects underwent 7.0-T sodium MR imaging with use of two different sequences: one without fluid suppression (radial three-dimensional sequence) and one with fluid suppression (inversion recovery [IR] wideband uniform rate and smooth truncation [WURST]). Fluid suppression was obtained by using IR with an adiabatic inversion pulse (WURST pulse). Mean sodium concentrations and their standard deviations were measured in the patellar, femorotibial medial, and lateral cartilage regions over four consecutive sections for each subject. The minimum, maximum, median, and average means and standard deviations were calculated over all measurements for each subject. The utility of these measures in the detection of osteoarthritis was evaluated by using logistic regression and the area under the receiver operating characteristic curve (AUC). Bonferroni correction was applied to the P values obtained with logistic regression.
Results:
Measurements from IR WURST were found to be significant predicators of all osteoarthritis (Kellgren-Lawrence score of 1–4) and early osteoarthritis (Kellgren-Lawrence score of 1 or 2). The minimum standard deviation provided the highest AUC (0.83) with the highest accuracy (>78%), sensitivity (>82%), and specificity (>74%) for both all osteoarthritis and early osteoarthritis groups.
Conclusion:
Quantitative sodium MR imaging at 7.0 T with fluid suppression by using adiabatic IR is a potential biomarker for osteoarthritis.
© RSNA, 2013
Introduction
Osteoarthritis is the most common form of arthritis in synovial joints and a leading cause of chronic disability in the elderly population (1). In 2008, it was estimated that nearly 27 million adults in the United States (∼9% of the population) have clinical osteoarthritis and that $185 billion is spent annually on medical care as a result of this condition (2). It is predicted that by 2030 nearly 67 million adults (∼25% of the adult U.S. population) will be affected by osteoarthritis (3). There are many obstacles to studying osteoarthritis—including heterogeneity in etiology, variability in progression of disease, and the long time required to see morphologic joint changes—and the lack of available noninvasive biochemical markers have impeded the clinical development of potential disease-modifying osteoarthritis drugs (4).
Osteoarthritis is a degenerative disease of the articular cartilage that can be associated with a reduction in glycosaminoglycan (GAG) concentration, changes in the size and organization of collagen fibers, and increased water content (5). Many magnetic resonance (MR) imaging methods for assessing osteoarthritis in cartilage are under development, such as T2 mapping (6), T1ρ mapping (7), GAG chemical exchange saturation transfer (8), delayed gadolinium-enhanced MR imaging of cartilage (9), diffusion-tensor imaging (10), and sodium MR imaging (11). All of these methods have their advantages and weaknesses (12,13), but sodium MR imaging has been shown to strongly correlate with the GAG concentration in the cartilage (5,14–16). Sodium MR imaging is challenging owing to the low sodium-detected signal and its fast relaxation (5). It must be performed with ultrashort echo time sequences and low spatial resolution (≥2 mm) (17). A large partial volume effect must, therefore, be considered when measuring the sodium concentration in cartilage owing to the presence of synovial fluid and/or joint effusion within the voxels.
We performed this study to assess the potential use of sodium MR imaging of cartilage, with and without fluid suppression by using an adiabatic pulse (18), for classifying subjects with versus subjects without osteoarthritis at 7.0 T.
Materials and Methods
Volunteers
We imaged the knee cartilage of 19 asymptomatic volunteers (control subjects) and 28 symptomatic volunteers (patients with osteoarthritis). Subject characteristics are provided in Table 1.
Table 1.
Subject Characteristics
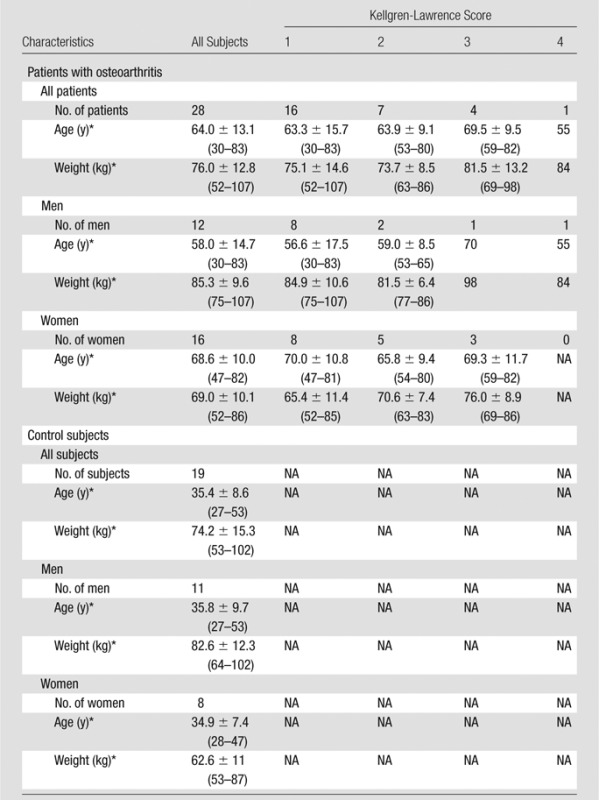
Note.—NA = not applicable.
Data are given as means ± standard deviations when they apply to more than one subject. Numbers in parentheses are ranges.
Asymptomatic subjects were recruited from the general public. The exclusion criteria included knee pain or clinical symptoms, history of osteoarthritis or inflammatory arthritis, previous knee injury, and surgery on either knee. Symptomatic subjects were selected from the New York University–Hospital of Joint Diseases knee osteoarthritis cohort (19). These patients fulfilled the criteria for clinical osteoarthritis symptoms defined by the American College of Rheumatology (20) and had radiographic evidence of tibial-femoral knee osteoarthritis, with a Kellgren-Lawrence grade of 1–4 on standardized weight-bearing fixed-flexion posterior-anterior knee radiographs (21). Patients were excluded if there was any inflammatory arthritis, a history of traumatic knee injury or surgery on either knee, or a history of bilateral knee replacement.
This study was approved by the institutional review board and performed in compliance with the Health Insurance Portability and Accountability Act. All subjects provided written informed consent.
Hardware
Sodium images were acquired with a 7.0-T whole-body MR unit (Siemens Healthcare, Erlangen, Germany) with two different radiofrequency coils. The first coil (coil 1) was a single-tuned sodium birdcage knee coil (Rapid MR International, Columbus, Ohio). The second coil (coil 2) was a homemade double-tuned proton-sodium knee coil. The proton part of the coil was a four-channel transmit-receive coil, whereas the sodium part was a birdcage transmit and eight-channel receive coil (22).
The first eight control subjects and first six patients with osteoarthritis underwent imaging with coil 1; all other subjects underwent imaging with coil 2.
MR Image Acquisition
Proton images.—Anatomic proton images with T1 weighting (gradient-recalled echo sequence) and proton density (turbo spin-echo sequence) were obtained in subjects who underwent imaging with coil 2. Imaging parameters are shown in Table 2.
Table 2.
Proton Sequence Parameters
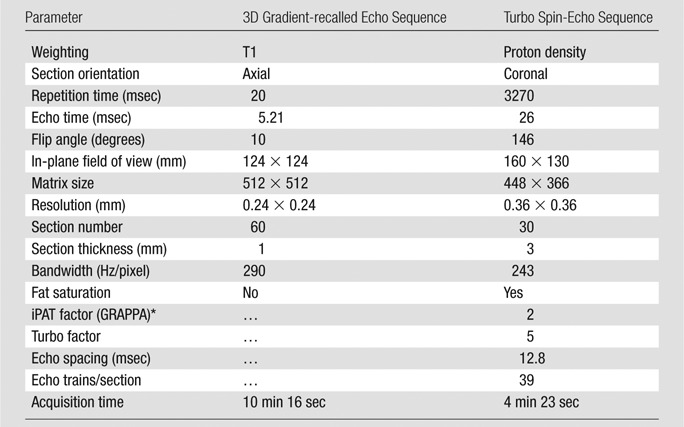
GRAPPA = generalized autocalibrating partially parallel acquisitions, iPAT = integrated parallel acquisition technique.
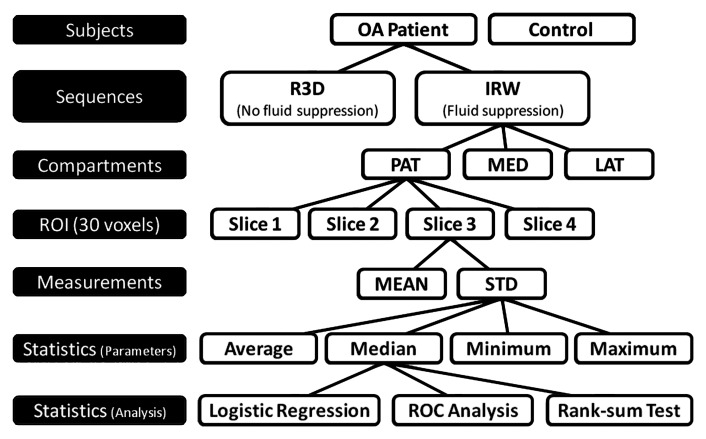
Sodium images.—Sodium images without fluid suppression were acquired by using an ultrashort echo time radial three-dimensional (3D) sequence (23). Fluid suppression was obtained with inversion recovery (IR) by using an adiabatic pulse and appropriate inversion time before the radial 3D sequence. The adiabatic pulse was the wideband uniform rate and smooth truncation (WURST) pulse with a sweep range of 2 kHz (24); this sequence is referred to as IR WURST. The two sequences (radial 3D and IR WURST) were written in SequenceTree 4.2.2 (25) and compiled with Siemens software (IDEA VB15A). Images were reconstructed offline in Matlab (Mathworks, Natick, Mass) by using a nonuniform fast Fourier transform algorithm (26). The sequence and reconstruction parameters are presented in Table 3. The complete image acquisition and data analysis protocol is shown in Figure 1.
Table 3.
Sodium Sequence and Reconstruction Parameters
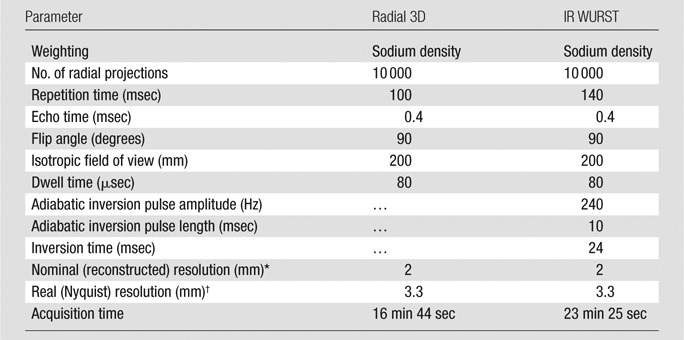
The nominal (reconstructed) resolution is the size of the isotropic voxels chosen in the regridding algorithm for reconstructing the images from the 3D radial k-space trajectory.
The real (Nyquist) resolution is the resolution calculated from the usual resolution equation, as follows: resolution = 1/(2 × kmax), where kmax is the maximal value of the k-space used for reconstructing the images.
Figure 1:
Acquisition and statistical analysis protocol. ROIs of 30 voxels were drawn in cartilage compartments on four consecutive sections. Mean and standard deviation (STD) of sodium concentration were measured for each ROI of each section. Then, average, median, minimum, and maximum mean and standard deviation were calculated over all ROIs (all sections) and from all compartments for each subject. Logistic regression and receiver operating characteristics (ROC) analyses were applied on latter parameters to differentiate patients with osteoarthritis (OA) from control subjects with radial 3D (R3D) and IR WURST (IRW) sequences. Wilcoxon rank sum test was applied to statistics parameters on osteoarthritis data to assess significance of difference of measures between Kellgren-Lawrence grades. LAT = femorotibial lateral, MED = femorotibial medial, PAT = patellar.
Image Postprocessing
Sodium concentration maps.—All images were acquired in the presence of calibration phantoms placed within the field of view. These phantoms were made of 4% agar gel with different sodium concentrations (100, 150, 200, 250, and 300 mmol/L). After T1 and biexponential T2* correction of the signal intensity from the phantoms (T1 = 23 msec, T2*short = 2 msec, T2*long = 12 msec), sodium maps were calculated by using linear regression. The sodium maps were then corrected for the average T1 and biexponential T2* of cartilage in vivo (T1 = 20 msec, T2*short = 1 msec, T2*long = 13 msec) (18,27) to achieve a more accurate quantification of the sodium concentration in cartilage. Because, on average, 25% of the volume in cartilage is made up of solids without any sodium, the values of the voxels of the final sodium maps were divided by a factor of 0.75 (28,29).
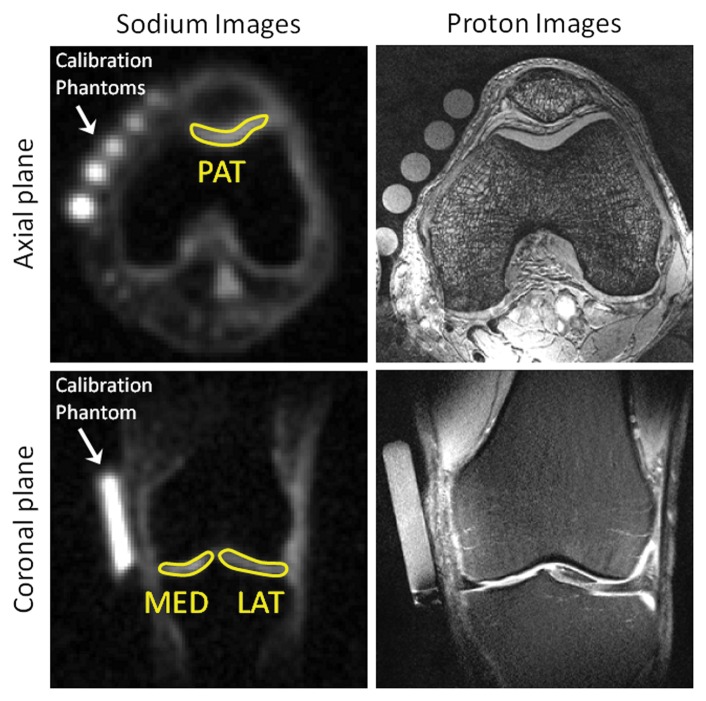
Sodium measurements.—Three regions of interest (ROIs) of 30 pixels were drawn on the patellar, femorotibial lateral, and femorotibial medial cartilage on four consecutives sections of the sodium maps (G.M., with 3 years of experience). The mean sodium concentration and standard deviation over all pixels were then calculated for each ROI (in millimoles per liter). Sodium images with ROIs are presented in Figure 2 alongside proton images.
Figure 2:
Representative sodium maps and proton images. Sodium maps show ROIs drawn on patellar (PAT), femorotibial medial (MED), and femorotibial lateral (LAT) cartilages. Calibration phantoms (4% agar gel) with different sodium concentrations are indicated.
Radiofrequency coil correction.—A signal-to-noise ratio map of each coil was calculated with a standard solution phantom (45 mmol/L of NaCl) that filled the whole volume inside the coil (22). The image was acquired with the radial 3D sequence with 15 000 projections and the parameters given in Table 3. Because the signal-to-noise ratio map from coil 1 was flat over the uniform sample (as expected from a birdcage transmit-receive coil), no correction was applied on the images obtained with this coil. The signal-to-noise ratio map from coil 2 was inhomogeneous (see the article by Brown et al [22] for the map) and therefore was used for correcting the images from all subjects who were imaged with this coil before sodium quantification processing. The correction was performed by normalizing the signal-to-noise ratio map and dividing the magnitude images by this normalized map.
Statistical Analysis
Logistic regression.—Logistic regression was used to assess and compare sequences (radial 3D, IR WURST) and regional measures (means and standard deviations) in terms of their ability to help differentiate patients with osteoarthritis from control subjects. The indicator variable identifying subjects as patients with osteoarthritis or control subjects was used as the dependent variable. Two osteoarthritis groups were tested: all osteoarthritis (Kellgren-Lawrence score of 1–4) and early osteoarthritis (Kellgren-Lawrence score of 1 or 2 only). Because the imaging data are regional, recorded for individual sections within each of three compartments (patellar, femorotibial medial, lateral), whereas the dependent variable is a subject-level factor, the value for each measure (mean and standard deviation) was rendered subject-level by computing the average, median, minimum, and maximum over all sections and compartments. These summary statistics computed for each combination of measure and sequence were used as candidate predictors of osteoarthritis. A Bonferroni multiple comparison correction was applied to the results of the logistic regression. Because there are eight candidate predictors per sequence, significance after Bonferroni correction was defined as P < .05/8 = .0063. Stepwise variable selection in the context of binary logistic regression was used to identify combinations of two or more factors as predictors of osteoarthritis from among the subject-level summary statistics from both IR WURST and radial 3D sequences. Each fitted logistic model computes the predicted probability that a subject has osteoarthritis given the data that the subject contributed to the model. With use of the predicted probability of osteoarthritis as the diagnostic test criterion, the sensitivity, specificity, and accuracy in the detection of osteoarthritis were calculated for all predictor analyses by using the same (default) cutoff probability of 0.5 for the predicted probability of osteoarthritis to define subjects as test-positive or test-negative for osteoarthritis (30). Accuracy was calculated as the number of true-positive findings (patients with osteoarthritis) plus the number of true-negative findings (control subjects) divided by the total number of subjects.
Receiver operating characteristic analysis.—The area under the receiver operating characteristic curve (AUC) was calculated as a measure of overall diagnostic utility for each predictor.
Wilcoxon rank sum test.—The rank sum test was applied to the summary statistics of means and standard deviations in patients with osteoarthritis to assess the significance of the difference of the measures between Kellgren-Lawrence grades.
All statistical tests were conducted at the two-sided 5% significance level by using SAS software (SAS 9.3; SAS Institute, Cary, NC) and Matlab. P < .0063 was indicative of a significant difference after a suitable Bonferroni multiple comparison correction.
Results
Sodium Concentration Maps
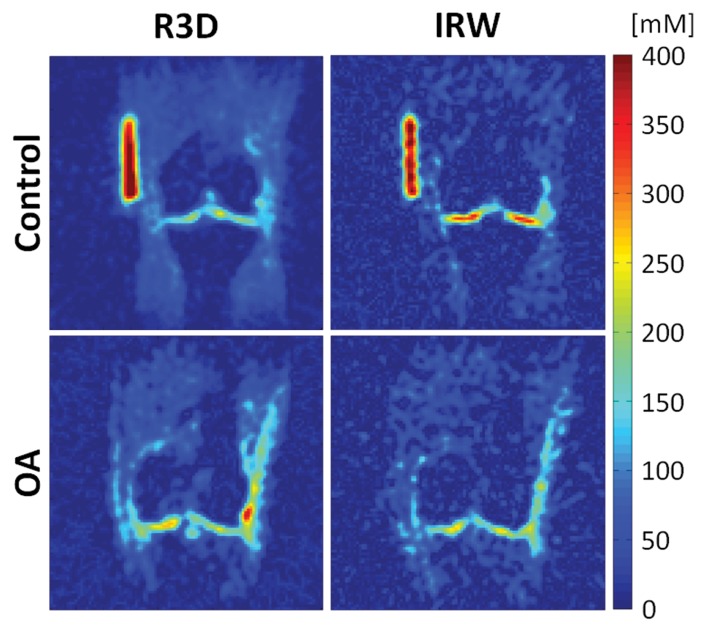
Figure 3 shows sodium maps in the coronal plane acquired with IR WURST and radial 3D sequences in one control subject and one patient with osteoarthritis. The difference in sodium concentration in the femorotibial medial and lateral compartments between healthy and osteoarthritis cartilage increased when synovial fluid was suppressed, as shown with the IR WURST data.
Figure 3:
Sodium maps from one control subject and one patient with osteoarthritis (OA). Maps were reconstructed from data acquired with fluid suppression (IR WURST [IRW] sequence) and without fluid suppression (radial 3D [R3D] sequence). Sodium concentrations with radial 3D sequence are similar for both patients with osteoarthritis and control subjects. Note the higher difference in sodium concentration with IR WURST between femorotibial medial and femorotibial lateral regions of control subject and patient with osteoarthritis compared with radial 3D.
The average means and standard deviations of sodium concentrations over all ROIs and all subjects are presented in Figure 4. The average means measured with radial 3D were almost the same in control subjects (range, 180–210 mmol/L) and in patients with osteoarthritis (range, 170–190 mmol/L), with a mean value over all cartilage of the same order (192 mmol/L ± 42 for control subjects and 174 mmol/L ± 46 for patients with osteoarthritis). When fluid suppression was applied with IR WURST, there was an increase in the difference of the means between control subjects (range, 220–270 mmol/L) and patients with osteoarthritis (range, 170–200 mmol/L) on the order of 50–70 mmol/L (which is the order of the standard deviation of the means = 60 mmol/L).
Figure 4:
Bar charts show, A, average means and, B, standard deviations of sodium concentrations with radial 3D (R3D) and IR WURST (IRW) sequences over all ROIs for different cartilage regions (patellar [PAT], femorotibial medial [MED], femorotibial lateral [LAT]) and for all regions together in control subjects and patients with osteoarthritis (OA).
Average standard deviations with radial 3D showed little difference between control subjects (range, 19–21 mmol/L) and patients with osteoarthritis (range, 19–20 mmol/L), with a mean value over all cartilage of the same order (22 mmol/L ± 10 for control subjects and 19 mmol/L ± 9 for patients with osteoarthritis). The difference was increased with IR WURST between control subjects (range, 31–37 mmol/L; mean, 35 mmol/L ± 8) and patients with osteoarthritis (range, 24–32 mmol/L; mean, 28 mmol/L ± 10). Note also that the average standard deviations at IR WURST were higher than those at radial 3D (by a factor 1.6) for both osteoarthritis and control groups.
Statistical Analysis
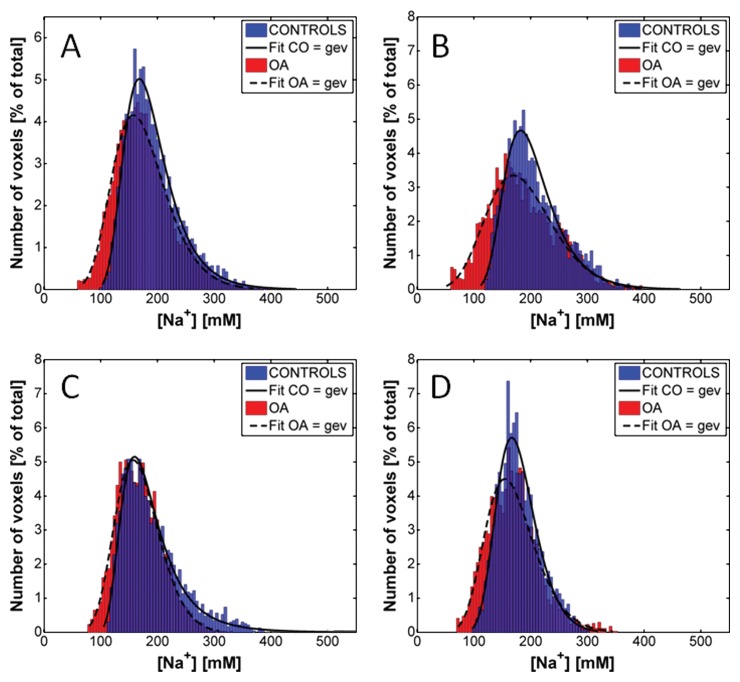
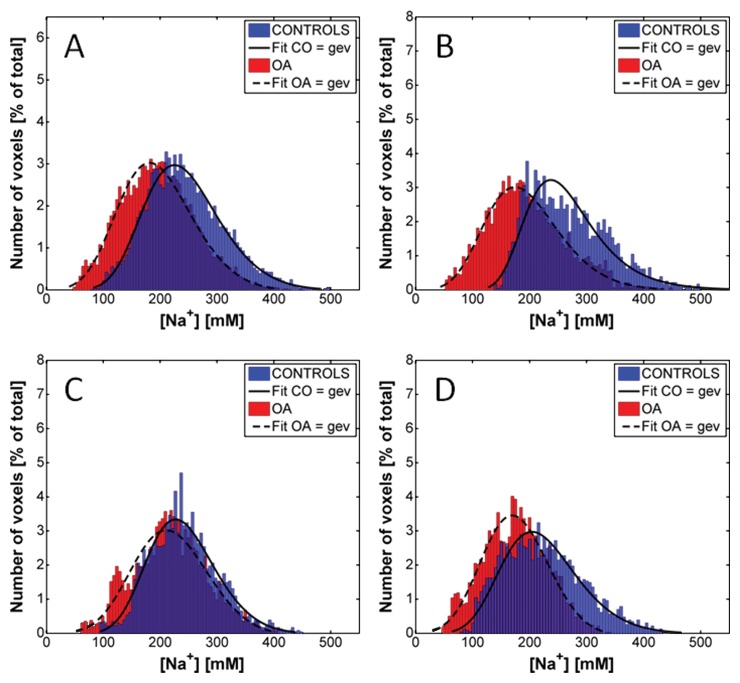
Figures 5 and 6 show the distributions of the sodium concentrations from radial 3D and IR WURST data, respectively, measured for all voxels of all the ROIs of all subjects. Results are given for all compartments together and for individual compartments. In all cases, the distributions were non-Gaussian and the best fit was found when using a generalized extreme value function. The fitting curves are shown as indicators of the shape of the distributions. The distributions with radial 3D are very similar for control subjects and patients with osteoarthritis, whereas the IR WURST method enabled better differentiation between the two populations because the osteoarthritis distribution is shifted to lower sodium concentrations compared with the control distribution.
Figure 5:
Distribution of sodium concentrations in all voxels of all ROIs of all subjects with radial 3D sequence (no fluid suppression), for, A, all cartilage compartments and, B, patellar, C, femorotibial medial, and, D, femorotibial lateral compartments. Distributions were fitted by using a generalized extreme value (gev) function as an indicator of their shape for better visualization. Distributions from both patients with osteoarthritis (OA) and control subjects (CO) have a similar shape over same range of sodium concentrations.
Figure 6:
Distribution of the sodium concentrations in all voxels of all ROIs of all subjects with IR WURST sequence (fluid suppression) for, A, all cartilage compartments and, B, patellar, C, femorotibial medial, and, D, femorotibial lateral compartments. Distributions were fitted by using a generalized extreme value (gev) function as an indicator of their shape for better visualization. Distributions from both patients with osteoarthritis (OA) and control subjects (CO) have a similar shape, but osteoarthritis distribution is shifted to lower sodium concentrations.
The results from logistic regression are summarized in Table 4, which shows the P values from the analysis to assess the utility for the detection of osteoarthritis (all osteoarthritis and early osteoarthritis) of subject-level statistics (average, median, minimum, and maximum) computed for each measure (mean and standard deviation) derived from the sodium maps of each sequence. There was no significant predictor of osteoarthritis (after Bonferroni correction) among all of the measures with use of data from radial 3D (P > .012). With IR WURST, the average, median, and minimum of both means and standard deviations were significant predictors of osteoarthritis when all patients with osteoarthritis were included (P < .0063); however, only the average of the means and the average and minimum of the standard deviations were significant predictors of early osteoarthritis (P < .0058). From the stepwise variable selection of the binary logistic regression analysis, for each sequence, there was no set of two or more factors identified as significant independent predictors of osteoarthritis (all osteoarthritis patients included) or of early osteoarthritis (patients with Kellgren-Lawrence score of 1 or 2 only).
Table 4.
Results of Logistic Regression (P Values)
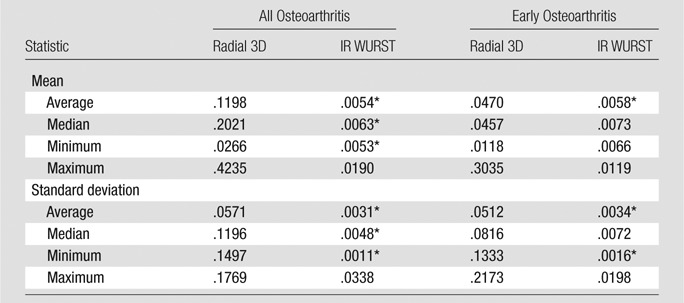
Note.—Data are P values. P < .05 was indicative of a statistically significant difference.
Significant results after Bonferroni correction for eight measurements per sequence per subject (P < .05/8 = .0063).
Table 5 shows the AUC from the receiver operating characteristic analysis, and the sensitivity, specificity, and accuracy of the classification from logistic regression, for all significant predictors from IR WURST after Bonferroni correction. For both osteoarthritis groups (all osteoarthritis and early osteoarthritis), the minimum of the standard deviation from IR WURST provided the highest AUC (0.83) and the highest accuracy (range, 79%–81%), sensitivity (range, 82%–83%), and specificity (range, 74%–79%). The average standard deviation and average mean also provided a reasonable AUC (range, 0.72–0.79) for both osteoarthritis groups, but with lower accuracy, sensitivity, and specificity (<74% for early osteoarthritis, <69% for all osteoarthritis) than the minimum standard deviation.
Table 5.
Performance of IR WURST in the Differentiation between All Osteoarthritis and Early Osteoarthritis Groups versus the Control Group
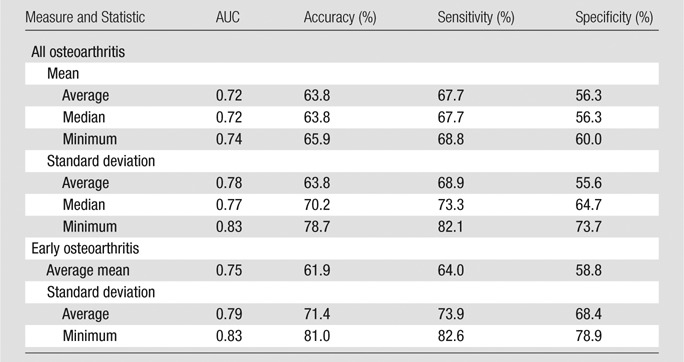
Note.—Accuracy, sensitivity, and specificity were calculated from logistic regression with a cutoff value of 0.5. The Kellgren-Lawrence score was 1–4 for all osteoarthritis and 1 or 2 for early osteoarthritis.
With the Wilcoxon rank sum test, no significant difference was found between the average, median, minimum, and maximum mean or standard deviation with different Kellgren-Lawrence grades, as measured in patients with osteoarthritis by using IR WURST and radial 3D.
Discussion
Owing to the low spatial (Nyquist) resolution of the sodium images (≥3 mm), the presence of synovial fluid, with a sodium concentration of 140–150 mmol/L (16), within the voxels in the images acquired without fluid suppression (radial 3D) led to a decrease in the total sodium quantification measured in the cartilage and significantly reduced the ability of the method to help differentiate healthy cartilage from osteoarthritis cartilage. Because of the suppression of fluid within the voxels with IR WURST, mean sodium concentrations in cartilage in control subjects were generally in the range of 220–270 mmol/L, which corresponds to the usual values for healthy human cartilage (13,16). The values for patients with osteoarthritis were less than 220 mmol/L, corresponding to a decrease of 20%–40% as is generally found in the literature with osteoarthritis (5,11,16).
With logistic regression analysis, sodium quantification with fluid suppression (IR WURST) was the only significant marker of osteoarthritis (all osteoarthritis and early osteoarthritis) when using the mean and standard deviation of the sodium concentrations measured for each patient. As expected from the sodium distributions of all voxels, and because of the presence of synovial fluid within these voxels in the radial 3D data, the sodium maps without fluid suppression were not a significant predictor of osteoarthritis (for both standard deviation and mean). The presence of fluid within voxels containing cartilage results in a weighted average of sodium quantification of both fluid and cartilage owing to partial volume effects. As a result, there is obscuration of the loss of sodium, which occurs within the cartilage only in patients with osteoarthritis.
The minimum standard deviation from IR WURST was the only significant marker, showing high AUC and high accuracy, sensitivity, and specificity for differentiating both osteoarthritis groups (all osteoarthritis and early osteoarthritis) from the control group. In cartilage, the GAG (and therefore sodium) concentration is distributed from the bone interface to the surface of the cartilage (31,32), with a higher concentration in the radial zone (close to the bone interface) and a lower concentration in the tangential zone (near the surface). In addition, we found that the sodium concentration was higher in healthy cartilage than in osteoarthritis cartilage, which therefore increases the range of values of sodium concentration within each measured ROI in healthy subjects compared with patients with osteoarthritis. The minimum standard deviation and average mean had a fairly high correlation coefficient (R = 0.66) to support this claim. Measurement of the minimum standard deviation (ie, the minimum variation of sodium content from all ROIs measured in each volunteer) could therefore possibly help differentiate subjects with a “normal” high range of GAG (or sodium) content in their cartilage from those with loss of GAG and therefore significantly less variation of sodium within at least one ROI. This explanation is limited because this is a preliminary study, and more subjects with and without osteoarthritis must be included to confirm our findings.
A limitation of these results is that standard deviation is more difficult to interpret than the mean for detecting osteoarthritis, and some patients with osteoarthritis might have very localized loss of sodium content within a region of cartilage and, therefore, a higher standard deviation in some ROI measurements, which can be confounded with the standard deviation from healthy cartilage. Owing to the low nuclear MR signal from sodium ions in cartilage and very short T2* relaxation times, sodium MR imaging is a challenging imaging method that necessitates high magnetic fields, special radiofrequency coils, optimized ultrashort echo time sequences with long acquisitions (15–25 minutes), and low spatial resolution (>3 mm). Sodium MR imaging could be combined with other noninvasive proton MR imaging, such as T2 mapping, T1ρ mapping, or diffusion-tensor imaging, to assess many different aspects of osteoarthritis (eg, loss of GAG, increase in water content, or degradation of collagen matrix), but acquisition times must be greatly reduced to apply a complete imaging protocol in a reasonable time for the subject (<1 hour). Applications of compressed sensing to accelerate the sodium MR imaging acquisition with undersampling are now under investigation (33,34).
Another limitation of the present technique is that we used average T1 and T2* relaxation times measured in vivo without fluid suppression (with radial 3D) in healthy control subjects (27) to correct the sodium maps from all subjects. Further improvements of the method will be to measure the relaxation times for each subject with fluid suppression for a better correction of the individual sodium maps because T1 and T2 (and T2*) are expected to change from healthy to osteoarthritis cartilage (35). These measurements should be acquired quickly by using undersampling and compressed sensing reconstruction to include them in the imaging protocol. Moreover, we expect that the knowledge of these relaxation times combined with mean and standard deviation measurements would also greatly improve the sensitivity and specificity of the method in the detection of early stages of osteoarthritis or the differentiation of Kellgren-Lawrence grades.
In the present study, age, sex, and weight were not taken into account in the logistic regression analysis. Sex and weight have been found to be nonsignificant predictors and therefore were not used. Because the subjects from the osteoarthritis and control groups were not age-matched in this study, age was found to be a significant confounding predictor that could shadow the detection of GAG concentrations and variations in cartilage with sodium MR imaging.
This study was performed at a very high field strength (7.0 T) with use of a research-only unit to assess the feasibility and utility of sodium MR imaging in the detection of loss of GAG in cartilage, but further studies should be performed with clinical MR units (3.0 T) to assess the potential translation to clinical use of the method.
A last concern is that sodium maps are corrected for an average water content of 75%, but this content can change with osteoarthritis. Measurement of this content (36) would improve the accuracy of the method for measuring the sodium content in cartilage.
In conclusion, the results of this study show that quantitative sodium MR imaging with fluid suppression by using adiabatic inversion recovery could be a useful biomarker for detecting osteoarthritis (loss of GAG) in articular cartilage in vivo at 7.0 T.
Advance in Knowledge.
• This study shows that fluid suppression with adiabatic inversion recovery can be applied to quantitative sodium MR imaging of articular cartilage in vivo; its accuracy (78%), sensitivity (82%), and specificity (74%) for measuring the loss of glycosaminoglycan associated with osteoarthritis are improved when compared to conventional (non–fluid suppressed) sodium MR imaging.
Implication for Patient Care.
• Quantitative fluid-suppressed sodium MR imaging in vivo is a potential biomarker for osteoarthritis.
Disclosures of Conflicts of Interest: G.M. No relevant conflicts of interest to disclose. J.B. No relevant conflicts of interest to disclose. D.X. No relevant conflicts of interest to disclose. G.C. No relevant conflicts of interest to disclose. S.K. No relevant conflicts of interest to disclose. S.B.A. No relevant conflicts of interest to disclose. A.J. No relevant conflicts of interest to disclose. R.R.R. No relevant conflicts of interest to disclose.
Received July 9, 2012; revision requested August 31; revision received December 7; accepted January 7, 2013; final version accepted January 10.
Funding: Supported by the National Institutes of Health (grant nos. 1R01AR053133, 1R01AR056260, and 1R01AR060238).
Abbreviations:
- AUC
- area under the receiver operating characteristic curve
- GAG
- glycosaminoglycan
- IR
- inversion recovery
- ROI
- region of interest
- 3D
- three-dimensional
- WURST
- wideband uniform rate and smooth truncation
References
- 1.Lawrence RC, Felson DT, Helmick CG, et al. Estimates of the prevalence of arthritis and other rheumatic conditions in the United States: part II. Arthritis Rheum 2008;58(1):26–35 [DOI] [PMC free article] [PubMed] [Google Scholar]
- 2.Kotlarz H, Gunnarsson CL, Fang H, Rizzo JA. Insurer and out-of-pocket costs of osteoarthritis in the US: evidence from national survey data. Arthritis Rheum 2009;60(12):3546–3553 [DOI] [PubMed] [Google Scholar]
- 3.Hootman JM, Helmick CG. Projections of US prevalence of arthritis and associated activity limitations. Arthritis Rheum 2006;54(1):226–229 [DOI] [PubMed] [Google Scholar]
- 4.Qvist P, Bay-Jensen AC, Christiansen C, Dam EB, Pastoureau P, Karsdal MA. The disease modifying osteoarthritis drug (DMOAD): is it in the horizon? Pharmacol Res 2008;58(1):1–7 [DOI] [PubMed] [Google Scholar]
- 5.Borthakur A, Mellon E, Niyogi S, Witschey W, Kneeland JB, Reddy R. Sodium and T1rho MRI for molecular and diagnostic imaging of articular cartilage. NMR Biomed 2006;19(7):781–821 [DOI] [PMC free article] [PubMed] [Google Scholar]
- 6.Smith HE, Mosher TJ, Dardzinski BJ, et al. Spatial variation in cartilage T2 of the knee. J Magn Reson Imaging 2001;14(1):50–55 [DOI] [PubMed] [Google Scholar]
- 7.Regatte RR, Akella SV, Borthakur A, Kneeland JB, Reddy R. In vivo proton MR three-dimensional T1rho mapping of human articular cartilage: initial experience. Radiology 2003;229(1):269–274 [DOI] [PubMed] [Google Scholar]
- 8.Ling W, Regatte RR, Navon G, Jerschow A. Assessment of glycosaminoglycan concentration in vivo by chemical exchange-dependent saturation transfer (gagCEST). Proc Natl Acad Sci U S A 2008;105(7):2266–2270 [DOI] [PMC free article] [PubMed] [Google Scholar]
- 9.Bashir A, Gray ML, Burstein D. Gd-DTPA2- as a measure of cartilage degradation. Magn Reson Med 1996;36(5):665–673 [DOI] [PubMed] [Google Scholar]
- 10.Filidoro L, Dietrich O, Weber J, et al. High-resolution diffusion tensor imaging of human patellar cartilage: feasibility and preliminary findings. Magn Reson Med 2005;53(5):993–998 [DOI] [PubMed] [Google Scholar]
- 11.Reddy R, Insko EK, Noyszewski EA, Dandora R, Kneeland JB, Leigh JS. Sodium MRI of human articular cartilage in vivo. Magn Reson Med 1998;39(5):697–701 [DOI] [PubMed] [Google Scholar]
- 12.Gold GE, Chen CA, Koo S, Hargreaves BA, Bangerter NK. Recent advances in MRI of articular cartilage. AJR Am J Roentgenol 2009;193(3):628–638 [DOI] [PMC free article] [PubMed] [Google Scholar]
- 13.Regatte RR, Schweitzer ME. Novel contrast mechanisms at 3 Tesla and 7 Tesla. Semin Musculoskelet Radiol 2008;12(3):266–280 [DOI] [PMC free article] [PubMed] [Google Scholar]
- 14.Lesperance LM, Gray ML, Burstein D. Determination of fixed charge density in cartilage using nuclear magnetic resonance. J Orthop Res 1992;10(1):1–13 [DOI] [PubMed] [Google Scholar]
- 15.Shapiro EM, Borthakur A, Dandora R, Kriss A, Leigh JS, Reddy R. Sodium visibility and quantitation in intact bovine articular cartilage using high field (23)Na MRI and MRS. J Magn Reson 2000;142(1):24–31 [DOI] [PubMed] [Google Scholar]
- 16.Shapiro EM, Borthakur A, Gougoutas A, Reddy R. 23Na MRI accurately measures fixed charge density in articular cartilage. Magn Reson Med 2002;47(2):284–291 [DOI] [PMC free article] [PubMed] [Google Scholar]
- 17.Madelin G, Regatte R, Jerschow A. Sodium MRI with fluid suppression: will it improve early detection of osteoarthritis? Imaging Med 2011;3(1):1–4 [Google Scholar]
- 18.Madelin G, Lee JS, Inati S, Jerschow A, Regatte RR. Sodium inversion recovery MRI of the knee joint in vivo at 7T. J Magn Reson 2010;207(1):42–52 [DOI] [PMC free article] [PubMed] [Google Scholar]
- 19.Attur M, Wang HY, Kraus VB, et al. Radiographic severity of knee osteoarthritis is conditional on interleukin 1 receptor antagonist gene variations. Ann Rheum Dis 2010;69(5):856–861 [DOI] [PMC free article] [PubMed] [Google Scholar]
- 20.Altman R, Asch E, Bloch D, et al. Development of criteria for the classification and reporting of osteoarthritis: classification of osteoarthritis of the knee. Diagnostic and Therapeutic Criteria Committee of the American Rheumatism Association. Arthritis Rheum 1986;29(8):1039–1049 [DOI] [PubMed] [Google Scholar]
- 21.Kellgren JH, Lawrence JS. Radiological assessment of osteo-arthrosis. Ann Rheum Dis 1957;16(4):494–502 [DOI] [PMC free article] [PubMed] [Google Scholar]
- 22.Brown R, Madelin G, Lattanzi R, et al. Design of a nested eight-channel sodium and four-channel proton coil for 7T knee imaging. Magn Reson Med doi: 10.1002/mrm.24432. Published online August 8, 2012. Accessed December 7, 2012 [DOI] [PMC free article] [PubMed] [Google Scholar]
- 23.Nielles-Vallespin S, Weber MA, Bock M, et al. 3D radial projection technique with ultrashort echo times for sodium MRI: clinical applications in human brain and skeletal muscle. Magn Reson Med 2007;57(1):74–81 [DOI] [PubMed] [Google Scholar]
- 24.Kupce E, Freeman R. Adiabatic pulses for wide-band inversion and broadband pulse. J Magn Reson A 1995;115(2):273–276 [Google Scholar]
- 25.Magland J, Wehrli FW. Pulse sequence programming in a dynamic visual environment [abstr]. In: Proceedings of the Fourteenth Meeting of the International Society for Magnetic Resonance in Medicine. Berkeley, Calif: International Society for Magnetic Resonance in Medicine, 2006; 3032 [Google Scholar]
- 26.Greengard L, Lee JY. Accelerating the nonuniform fast Fourier transform. SIAM Rev 2004;46(3):443–454 [Google Scholar]
- 27.Madelin G, Jerschow A, Regatte RR. Sodium relaxation times in the knee joint in vivo at 7T. NMR Biomed 2012;25(4):530–537 [DOI] [PMC free article] [PubMed] [Google Scholar]
- 28.Borthakur A, Shapiro EM, Akella SV, Gougoutas A, Kneeland JB, Reddy R. Quantifying sodium in the human wrist in vivo by using MR imaging. Radiology 2002;224(2):598–602 [DOI] [PubMed] [Google Scholar]
- 29.Wheaton AJ, Borthakur A, Shapiro EM, et al. Proteoglycan loss in human knee cartilage: quantitation with sodium MR imaging—feasibility study. Radiology 2004;231(3):900–905 [DOI] [PubMed] [Google Scholar]
- 30.Peng CYJ, Lee KL, Ingersoll GM. An introduction to logistic regression analysis and reporting. J Educ Res 2002;96(1):3–14 [Google Scholar]
- 31.Kiviranta I, Jurvelin J, Tammi M, Säämänen AM, Helminen HJ. Microspectrophotometric quantitation of glycosaminoglycans in articular cartilage sections stained with safranin O. Histochemistry 1985;82(3):249–255 [DOI] [PubMed] [Google Scholar]
- 32.Raya JG, Arnoldi AP, Weber DL, et al. Ultra-high field diffusion tensor imaging of articular cartilage correlated with histology and scanning electron microscopy. MAGMA 2011;24(4):247–258 [DOI] [PubMed] [Google Scholar]
- 33.Lustig M, Donoho D, Pauly JM. Sparse MRI: the application of compressed sensing for rapid MR imaging. Magn Reson Med 2007;58(6):1182–1195 [DOI] [PubMed] [Google Scholar]
- 34.Madelin G, Chang G, Otazo R, Jerschow A, Regatte RR. Compressed sensing sodium MRI of cartilage at 7T: preliminary study. J Magn Reson 2012;214(1):360–365 [DOI] [PMC free article] [PubMed] [Google Scholar]
- 35.Insko EK, Kaufman JH, Leigh JS, Reddy R. Sodium NMR evaluation of articular cartilage degradation. Magn Reson Med 1999;41(1):30–34 [DOI] [PubMed] [Google Scholar]
- 36.Liess C, Lusse S, Karger N, Heller M, Gluer CC. Detection of changes in cartilage water content using MRI T2-mapping in vivo. Osteoarthritis Cartilage 2002;10(12):907–913 [DOI] [PubMed] [Google Scholar]


