An apparent diffusion coefficient increase of more than 25% and a decrease of venous enhancement of 65% enabled good stratification of patients into responders and nonresponders and were associated with improved overall survival in patients with unresectable hepatocellular carcinoma.
Abstract
Purpose:
To identify and validate the optimal thresholds for volumetric functional MR imaging response criteria to predict overall survival after intraarterial treatment (IAT) in patients with unresectable hepatocellular carcinoma (HCC).
Materials and Methods:
Institutional review board approval and waiver of informed consent were obtained. A total of 143 patients who had undergone MR imaging before and 3–4 weeks after the first cycle of IAT were included. MR imaging analysis of one representative HCC index lesion was performed with proprietary software after initial treatment. Subjects were randomly divided into training (n = 114 [79.7%]) and validation (n = 29 [20.3%]) data sets. Uni- and multivariate Cox models were used to determine the best cutoffs, as well as survival differences, between response groups in the validation data set.
Results:
Optimal cutoffs in the training data set were 23% increase in apparent diffusion coefficient (ADC) and 65% decrease in volumetric enhancement in the portal venous phase (VE). Subsequently, 25% increase in ADC and 65% decrease in VE were used to stratify patients in the validation data set. Comparison of ADC responders (n = 12 [58.6%]) with nonresponders (n = 17 [34.5%]) showed significant differences in survival (25th percentile survival, 11.2 vs 4.9 months, respectively; P = .008), as did VE responders (n = 9 [31.0%]) compared with nonresponders (n = 20 [69.0%]; 25th percentile survival, 11.5 vs 5.1 months, respectively; P = .01). Stratification of patients with a combination of the criteria resulted in significant differences in survival between patients with lesions that fulfilled both criteria (n = 6 [20.7%]; too few cases to determine 25th percentile), one criterion (n = 9 [31.0%]; 25th percentile survival, 6.0 months), and neither criterion (n = 14 [48.3%]; 25th percentile survival, 5.1 months; P = .01). The association between the two criteria and overall survival remained significant in a multivariate analysis that included age, sex, Barcelona Clinic for Liver Cancer stage, and number of follow-up treatments.
Conclusion:
After IAT for unresectable HCC, patients can be stratified into significantly different survival categories based on responder versus nonresponder status according to MR imaging ADC and VE cutoffs.
© RSNA, 2013
Introduction
Hepatocellular carcinoma (HCC) is one of the most common malignancies worldwide and is associated with a very low 5-year survival rate (1). Only a few patients with HCC qualify for surgical resection or liver transplantation, as more than 50% of all HCCs are diagnosed at an advanced stage of disease (2). Intraarterial therapy (IAT), specifically transarterial chemoembolization (TACE), is considered the standard of care in patients with unresectable HCC (3,4).
Although overall survival is considered the optimal endpoint in the assessment of treatment response, prognostic modeling in patients with HCC is complicated by the influence of tumor stage and liver function, both of which affect survival and tolerance of IATs (5,6). As a surrogate endpoint, cross-sectional imaging was adopted for lesion measurement by the World Health Organization in 1979. It was generally accepted that a decrease in tumor size correlated with treatment effect (7). However, there is no evidence that currently used anatomic response criteria are adequate surrogate endpoints for overall survival because tumor shrinkage is rarely observed in patients with unresectable HCC after IAT (8,9). Furthermore, new antineoplastic cytostatic agents tend to stabilize, not decrease, tumor size (9).
To overcome this limitation, the European Association for the Study of Liver Disease (EASL) suggested that quantification of enhancement on axial contrast material–enhanced images could be used to assess changes in viable tumor burden (10). However, both the EASL guidelines and the subsequent modified Response Evaluation Criteria in Solid Tumors (RECIST) guidelines (11) measure reduction in viable tumor burden in one axial plane (12,13). Recent studies have shown poor correlation between the clinical benefit of systemic or locoregional treatment and RECIST, modified RECIST, or EASL guidelines as methods of response assessment (9,14).
Volumetric assessment of tumor anatomy and function is now possible (15–19). In particular, functional volumetric assessment of diffusion-weighted magnetic resonance (MR) imaging with apparent diffusion coefficient (ADC) mapping and contrast-enhanced MR imaging have been applied successfully in the brain and liver (20,21). The aim of this study was to identify and validate the optimal thresholds for volumetric functional MR imaging response criteria to predict overall survival after IAT in patients with unresectable HCC.
Materials and Methods
This single-institution study was performed in compliance with the Health Insurance Portability and Accountability Act after we obtained a waiver for informed patient consent from our institutional review board. The study was performed with financial support from Siemens Medical Solutions (Erlangen, Germany) and with software (MR Oncotreat; Siemens Corporate Research, Princeton, NJ) that was developed in cooperation with Siemens Medical Solutions (15). Authors who did not receive funding from and who were not employed by Siemens Medical Solutions (V.G.H., Z.L., C.P.C.) had full control of the data and its analysis throughout the study.
Patient Selection and Data Collection
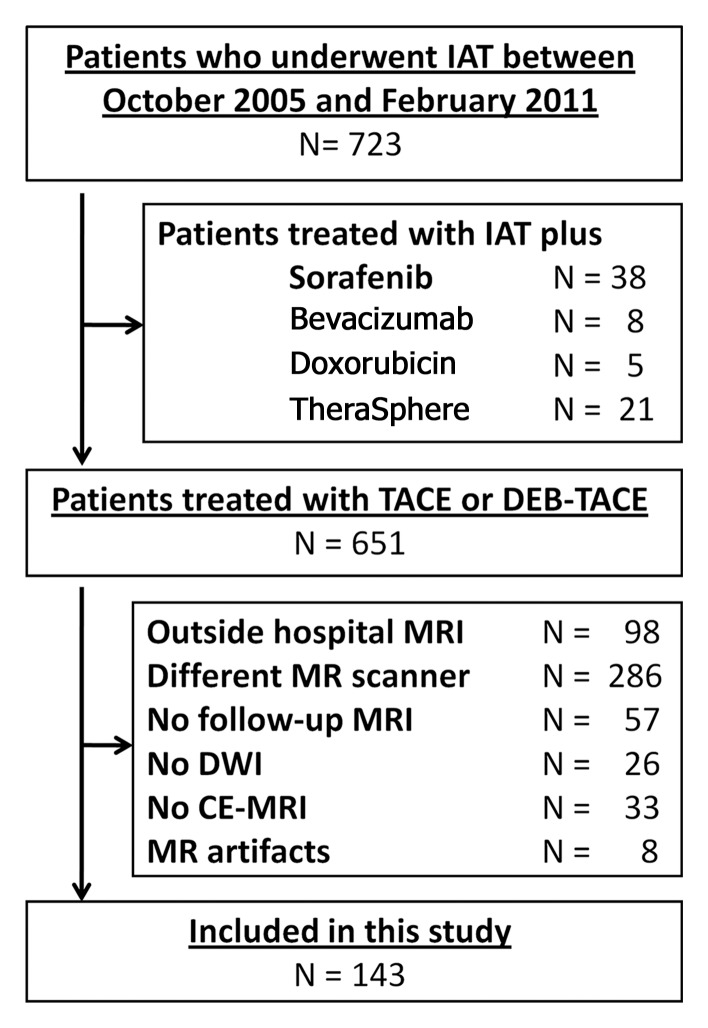
Between October 2005 and February 2011, 723 patients with HCC underwent a first cycle of IAT at our institution. To create the study population for this analysis, we included all patients who had undergone the first cycle of TACE and baseline MR imaging within 3–4 weeks before IAT and who had undergone follow-up MR imaging 3–4 weeks after treatment at our institution. We excluded patients if they (a) had undergone treatment at an outside hospital, (b) had an incomplete MR imaging examination before or after treatment, (c) had undergone MR imaging performed with a different imager at any time point, (d) had severe image artifacts, or (e) had undergone a different therapy (yttrium 90 or TACE with sorafenib or bevacizumab [Avastin; Genentech, South San Francisco, Calif]) (Fig 1). Our final study population comprised 143 patients whose survival outcomes were analyzed. Laboratory parameters and demographic, clinical, and imaging data were collected from patient case records.
Figure 1:
Flowchart shows inclusion and exclusion of patients who underwent IAT for HCC between October 2005 and February 2011. TheraSphere (Nordion, Ottawa, Ontario, Canada) is a liver cancer therapy. CE-MRI = contrast-enhanced MR imaging, DEB = drug-eluting beads, DWI = diffusion-weighted imaging.
IAT Procedures
All IAT procedures (conventional TACE and TACE with drug-eluting beads loaded with doxorubicin) were subsegmental and were performed by an experienced interventional radiologist (J.F.G., more than 15 years of experience) in accordance with a standard protocol that has been described more fully elsewhere (22,23).
MR Imaging Technique
All patients included in this study underwent a standardized imaging protocol. MR imaging was performed with a 1.5-T MR imager (Magnetom Avanto; Siemens Medical Solutions) by using a phased-array torso coil. The protocol included breath-hold diffusion-weighted echo-planar imaging (repetition time msec/echo time msec, 3000/69; matrix, 128 × 128; section thickness, 8 mm; intersection gap, 2 mm; b value, 0 and 750 sec/mm2; receiver bandwidth, 64 kHz), as well as breath-hold unenhanced and contrast-enhanced (0.1 mmol of intravenous gadopentetate per kilogram of body weight, Magnevist; Bayer, Wayne, NJ) T1-weighted three-dimensional fat-suppressed spoiled gradient-echo imaging (repetition time msec/echo time msec, 5.77/2.77; field of view, 320–400 mm; matrix, 192 × 160; section thickness, 2.5 mm; receiver bandwidth, 64 kHz; flip angle, 10°) in the hepatic arterial phase (20 seconds), portal venous phase (70 seconds), and delayed phase (3 minutes).
Volumetric Functional MR Imaging Response
Image analysis was performed by an MR imaging researcher (V.G.H.) with 2 years of experience with the aforementioned proprietary non–Food and Drug Administration–approved software, as described in a prior study (21). One HCC index lesion that had been treated during the first session of IAT was selected as the representative index lesion for the patient. The software automatically generated tumor diameter, tumor volume, volumetric ADC, and volumetric enhancement in the portal venous phase (VE).
ADC maps were reconstructed by using a monoexponential fit between two b values of 0 and 750 sec/mm2. The percentage change in volumetric tumor ADC at follow-up compared with volumetric tumor ADC at baseline (ADCchange) was calculated with the following formula:
 |
where ADCpre is the baseline mean volumetric ADC and ADCpost is the mean volumetric ADC at 3–4-week follow-up.
Enhancement in the portal venous phase was calculated by subtracting the native phase signal intensity from the venous phase signal intensity and then multiplying by 100 to obtain a percentage. Percentage change in volumetric tumor portal venous enhancement at follow-up compared with volumetric tumor portal venous enhancement at baseline (VEchange) was calculated with the following formula:
 |
where VEpre is the baseline mean volumetric portal venous enhancement and VEpost is the mean volumetric portal venous enhancement at 3–4-week follow-up.
The time required for image analysis ranged from 20 to 40 minutes per patient and depended on the size and complexity of the index lesion.
Statistical Analysis
The description of the cohort used medians and percentages, as well as interquartile ranges. The χ2 test was used to compare qualitative values, while nonparametric tests (Mann-Whitney test and Kruskal-Wallis one-way analysis of variance) were used to compare quantitative variables. Overall survival was depicted with the Kaplan-Meier method and compared with the log-rank test. Survival was calculated from the date of the first session of IAT.
To identify the optimal cutoff points for response, we used a split-sample cross-validation approach based on volumetric tumor ADC and volumetric tumor enhancement, with a training set of 79.7% of the data (114 patients) and a validation set of 20.0% of the data (29 patients). Univariate Cox regression models were used, and the best cutoffs for an increase in ADC and a decrease in enhancement were then selected on the basis of the highest log likelihood. Goodness of fit for our Cox model was tested by using the Stata (College Station, Tex) command stcoxgof. In a second multivariate Cox model, we tested the influence of possible confounding factors on the threshold selection—namely age, sex, Barcelona Clinic for Liver Cancer (BCLC) stage, and number of treatments after initial IAT. Finally, to evaluate the performance of these thresholds, patients in the validation set were stratified into responders and nonresponders according to the optimal cutoff. In a second step, the training set was split into dual-parameter responders if they fulfilled the ADC and venous enhancement criteria. Lesions that fulfilled one of the two criteria were classified as a single-parameter response, while lesions that did not fulfill either criterion were classified as nonresponders. Survival differences between groups were tested by using a multivariate Cox proportional hazards model. Statistical software (Stata, version 10.1; Stata) was used for all statistical analyses.
Results
Patient Characteristics
Table 1 summarizes the baseline characteristics of the 143 patients and is stratified by the training and validation data set. Within the entire group, the mean age was 62.3 years, and 118 patients (82.5%) were male. The mean tumor size (RECIST measurement) before treatment was 88.1 mm, and it decreased slightly after treatment (83.3 mm). None of the baseline characteristics differed significantly between the training and validation data sets. A total of 108 patients (75.5%) underwent conventional TACE, and the remaining 35 (24.5%) underwent TACE with drug-eluting beads. Patient distribution was similar in the training and validation data sets. In the training data set, 88 of 114 patients (77.2%) underwent conventional TACE, and the remaining 26 (22.8%) underwent TACE with drug-eluting beads. In the validation data set, 20 of 29 patients (69.0%) underwent TACE, and the remaining nine (31.0%) underwent TACE with drug-eluting beads (P = .36). The number of subsequent TACE treatments observed was also similar between the training (mean number of follow-up treatments, 1.58; range, zero to eight treatments) and validation (mean number of follow-up treatments, 1.31; range, zero to six treatments) data sets.
Table 1.
Baseline Characteristics of 143 Patients with HCC
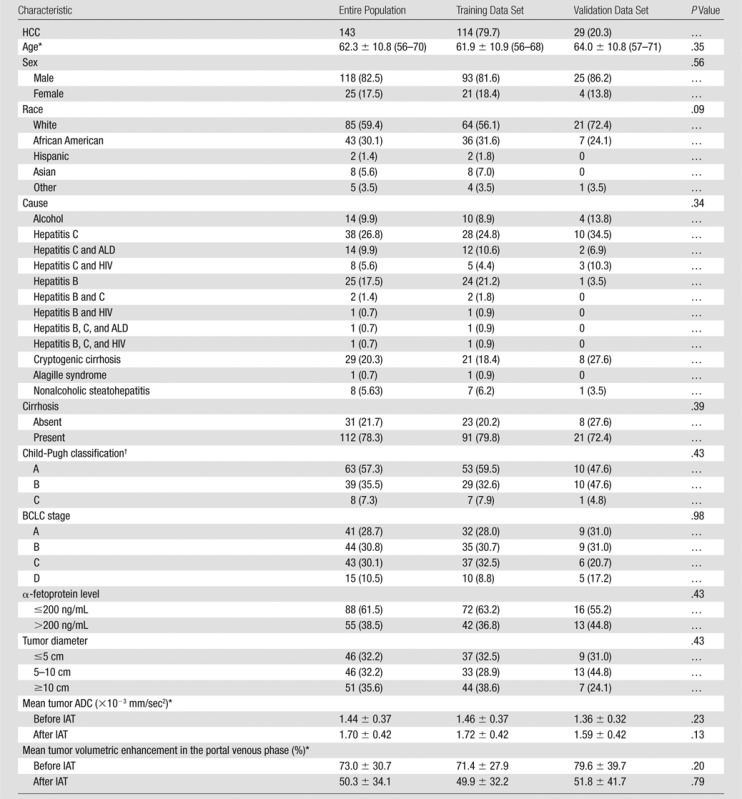
Note.—Unless otherwise indicated, data are numbers of patients, and data in parentheses are percentages. ADC = apparent diffusion coefficient, ALD = alcoholic liver disease, HIV = human immunodeficiency virus.
Data are mean ± standard deviation. Data in parentheses are interquartile range.
Only in patients with cirrhosis (n = 112).
Median survival of all 143 patients with HCC was 17.5 months (95% confidence interval: 11.5, 25.4 months). A total of 91 patients (63.6%) had died at the time of data closure on March 31st, 2012. Survival at 6-, 12-, and 24-month follow-up was 71.3%, 56.6%, and 36.4%, respectively. Number of events (42 [36.8%] vs 10 [34.5%], P = .81) and median survival (18.5 months vs 14.9 months, P = .89) did not differ significantly between training and validation data sets.
Training Data Set Results
The optimal cutoff for increase in ADC and decrease in VE after IAT was determined based on the highest log likelihood in the Cox regression model. In the training data set, the highest log likelihood was obtained with a 23% increase in ADC (log likelihood,−295.94) and a 65% decrease in VE (log likelihood,−301.62). These results were similar for a combined Cox model, which used both variables (log likelihood,−292.17) to obtain cutoff for a multiparametric volumetric analysis of treatment response. Next, we performed the same analysis by using multivariate Cox analysis, which included percentage increase in ADC, percentage decrease in VE, age, sex, BCLC stage, and number of treatments. Again, results were very similar to results of the initial analysis variables (optimal ADC cutoff, 23% increase in ADC; optimal VE cutoff, 66% decrease in VE) (log likelihood,−417.63). The optimal cutoffs were determined again in five different random samples to test how stable and precise these results were. The resulting optimal cutoffs ranged from 15% to 23% for increase in ADC and from 65% to 72% for decrease in VE. Determination of the cutoffs in the entire population also resulted in a similar optimal cutoff for ADC (23% increase; log likelihood,−393.40) and VE (66% decrease; log likelihood,−403.06). The goodness of fit test for the Cox model showed that these thresholds were representative for the data for both ADC (P < .001) and VE (P < .001).
Validation Data Set Results
An overview of the results of the validation data set analysis is shown in Table 2, including the 25th percentile survival and median survival time, as well as the 6-, 12-, and 24-month survival rates for all response groups.
Table 2.
Validation of ADC and Venous Enhancement Thresholds in the Testing Subset (n = 29)

Note.—Data in parentheses are 95% confidence intervals. NA = not applicable.
P values were calculated with univariate Cox regression analysis.
Survival data could not be calculated due to low number of events in this subgroup.
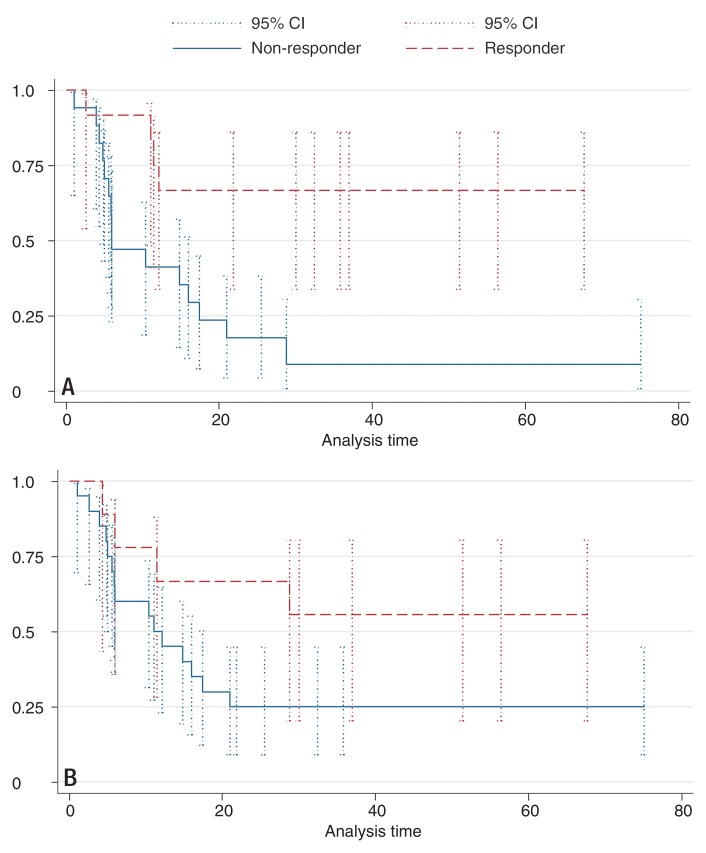
First, the validation data set was segregated according to the training data set results; however, for convenience and future use, we performed the subsequent analysis by using an ADC cutoff of 25% instead of 23%. Patients with HCC lesions that showed an increase in ADC of at least 25% were categorized as responders (12 of 29 patients [41.4%]), while patients with an HCC lesion that showed a smaller increase or decrease in ADC were categorized as nonresponders (17 of 29 patients [58.6%]). Survival differed significantly between the groups, with a 25th percentile survival of 11.1 months in responders (median survival could not be determined due to the small number of events) and 25th percentile survival of 4.9 months in nonresponders (median survival, 6.0 months; P = .01) (Fig 2, A). In the multivariate Cox model, the hazard ratio for the ADC cutoff of 25% was reduced from 0.46 to 0.27, but it remained significant (P = .02).
Figure 2:
Kaplan-Meier survival plots of the 29 patients in the validation data set. Error bars are 95% confidence intervals (95% CI). A, Data are stratified by tumor response according to 25% increase in ADC. Responders show significantly longer survival time and higher 6-, 12- and 24-month survival rates compared with nonresponders. B, Data are stratified by response according to 65% decrease in portal venous enhancement. Responders show an insignificantly longer survival time and higher 6-, 12-, and 24-month survival rates compared with nonresponders.
Patients with HCC lesions that showed a decrease in VE of 65% or more were categorized as responders (eight of 29 patients [27.6%]), while patients with HCC lesions that showed an increase or a decrease of less than 65% were categorized as nonresponders (21 of 29 patients [72.4%]). Survival differences between responders and nonresponders were also significantly different (P = .012). Responders had a 25th percentile survival of 11.5 months (median survival could not be determined due to the small number of events), and nonresponders had a 25th percentile survival of 5.1 months (median survival, 11.1 months) (Fig 2, B). The hazard ratio for a 65% decrease in VE was 0.69 in the univariate Cox model and was reduced to 0.56 in the multivariate model. No factor showed significance in the multivariate model.
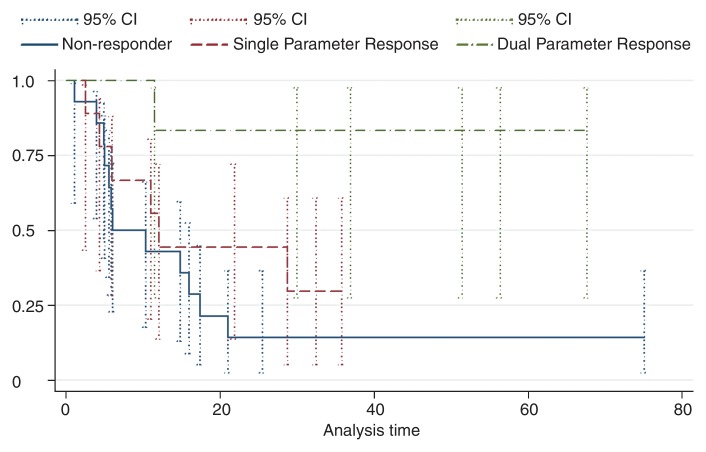
Next, the validation data set was stratified into three volumetric multiparametric MR imaging response categories according to the ADC and VE thresholds described previously. Patients with HCC lesions that showed at least a 25% increase in ADC and a 65% decrease in enhancement were classified as dual-parameter responders (six of 29 patients [20.7%]). Lesions that fulfilled one of the two criteria were classified as a single-parameter response (nine of 29 patients [31.0%]), while lesions that did not fulfill either criterion were classified as nonresponders (14 of 29 patients [48.3%]). Survival differences were significant between the three groups (P = .01) (Fig 3). The 25th percentile survival of patients categorized as dual-parameter responders was 30.0 months (median survival, 35.8 months); single-parameter response was 6.0 months (median survival, 12.1 months) compared with a 25th percentile survival of 5.1 months (median survival, 6.0 months) in patients categorized as nonresponders. The results of the uni- and mulitvariate Cox regression analysis are shown in Table 3. Figures 4–6 show examples of patients from the validation data set who were categorized as dual-parameter responders, single-parameter responders, and nonresponders, respectively. Table 4 shows the clinical variables and mean MR imaging variables according to volumetric multiparametric MR imaging response category.
Figure 3:
Kaplan-Meier survival plots of the 29 patients in the validation data set. Data are stratified by volumetric functional MR imaging tumor response. Error bars are 95% confidence intervals (95% CI). Dual-parameter responders (n = 6) have significantly longer survival times and higher 6-, 12- and 24-month survival rates compared with single-parameter responders (n = 9) and nonresponders (n = 14).
Table 3.
Univariate and Multivariate Cox Regression Analysis for Overall Survival

Note.—Model A includes volumetric multiparametric MR imaging variable and a single variable. Model B includes volumetric multiparametric MR imaging variable and all variables.
Figure 4a:
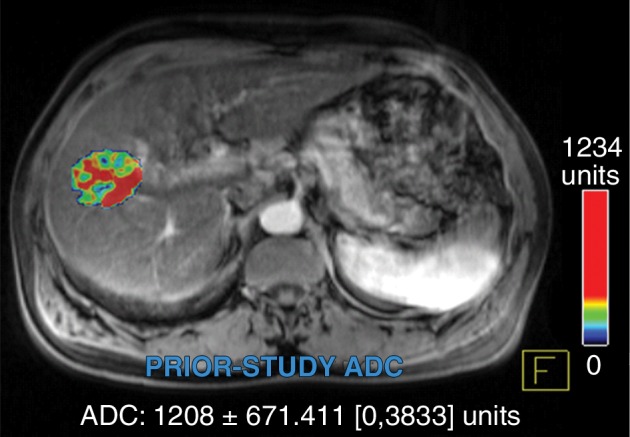
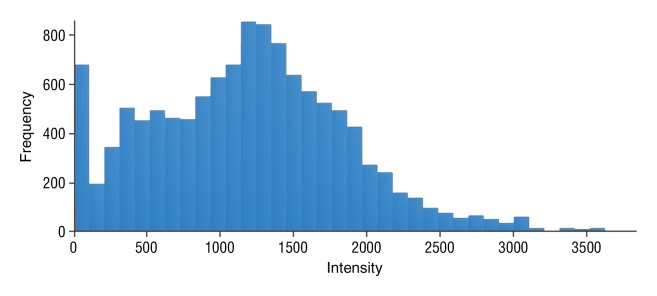
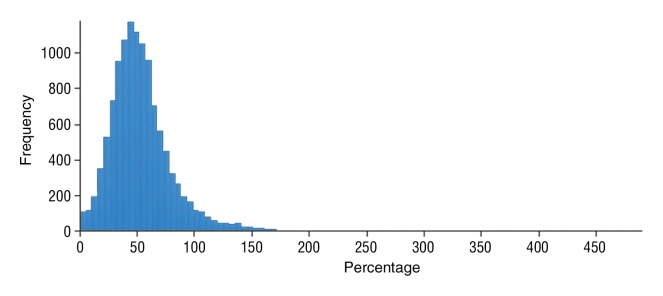
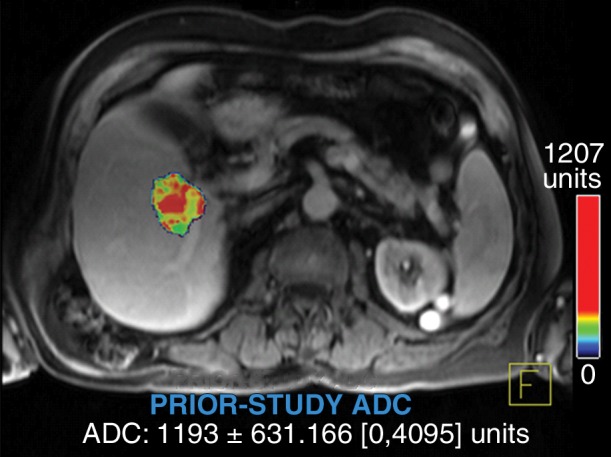
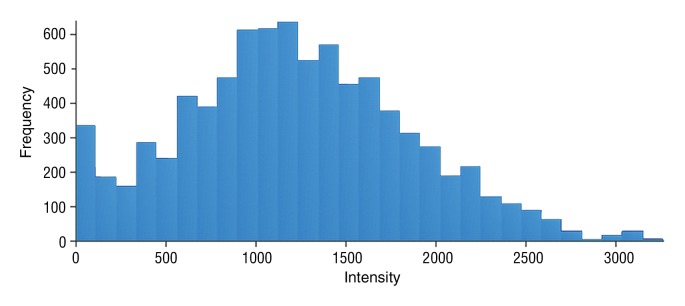
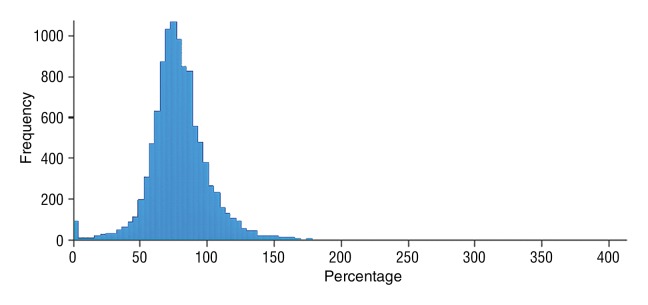
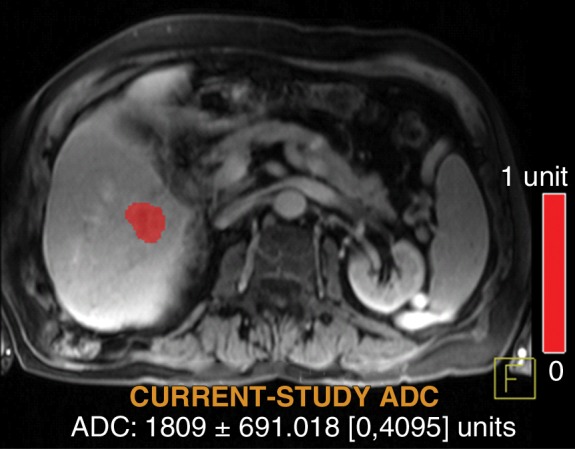
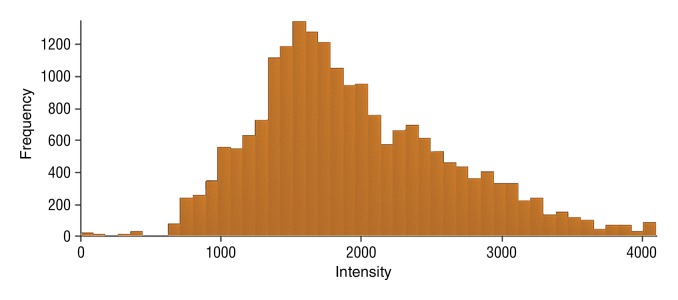
Data were obtained in a 55-year-old man with HCC in the validation data set who was stratified as a dual-parameter responder. Before therapy, index lesion RECIST size was 3.7 cm and volume, 19.7 cm3. After treatment, index lesion RECIST size decreased to 2.7 cm, and volume decreased to 8.6 cm3. (a) Color-coded functional ADC map shows segmented tumor before treatment. (b) Histogram shows distribution of ADC values (measured in micrometers per second squared) before treatment. (c) Histogram shows distribution of portal venous enhancement before treatment. (d) Color-coded functional ADC map shows segmented tumor 4 weeks after treatment. (e) Histogram shows distribution of ADC values (measured in micrometers per second squared) 4 weeks after treatment. Mean ADC increased from 1.21 × 10⁻³ mm/sec2 to 2.13 × 10⁻³ mm/sec2 (88% increase). (f) Histogram shows distribution of portal venous enhancement 4 weeks after treatment. Mean portal venous enhancement decreased from 54.0% to 2.7% (94.9% decrease).
Figure 6a:
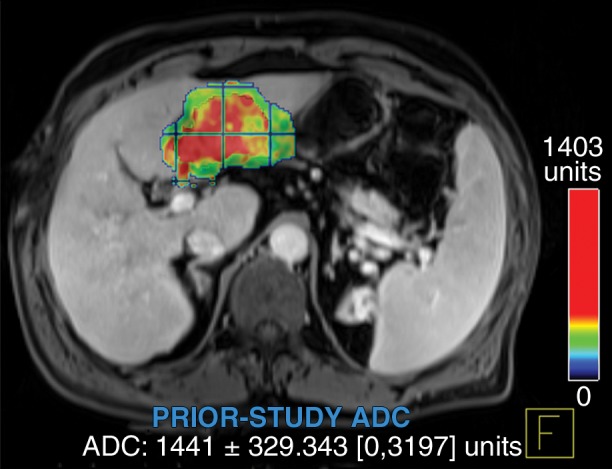
Data were obtained in a 62-year-old man with HCC in the validation data set who was stratified as a nonresponder. Before treatment, index lesion RECIST size was 7.8 cm and volume, 80.4 cm3. After treatment, index lesion RECIST size decreased to 6.9 cm, and volume was 65.0 cm3. (a) Color-coded functional ADC map shows segmented tumor before treatment. (b) Histogram shows distribution of ADC values (measured in micrometers per second squared) before treatment. (c) Histogram shows distribution of portal venous enhancement before treatment. (d) Color-coded functional ADC map shows segmented tumor 4 weeks after treatment. (e) Histogram shows distribution of ADC values 4 weeks after treatment. Mean ADC increased from 1.44 × 10⁻³ mm/sec2 to 1.69 × 10⁻³ mm/sec2 (17.4% increase). (f) Histogram shows distribution of portal venous enhancement 4 weeks after treatment. Mean portal venous enhancement increased from 79.3% to 107.2% (35.3% increase).
Table 4.
Selected Clinical and MR Imaging Variables within the Validation Data Set, Stratified by Volumetric Multiparametric MR Imaging Response

Note.—Data are mean ± standard deviation.
P value for analysis of variance.
Figure 4b:
Data were obtained in a 55-year-old man with HCC in the validation data set who was stratified as a dual-parameter responder. Before therapy, index lesion RECIST size was 3.7 cm and volume, 19.7 cm3. After treatment, index lesion RECIST size decreased to 2.7 cm, and volume decreased to 8.6 cm3. (a) Color-coded functional ADC map shows segmented tumor before treatment. (b) Histogram shows distribution of ADC values (measured in micrometers per second squared) before treatment. (c) Histogram shows distribution of portal venous enhancement before treatment. (d) Color-coded functional ADC map shows segmented tumor 4 weeks after treatment. (e) Histogram shows distribution of ADC values (measured in micrometers per second squared) 4 weeks after treatment. Mean ADC increased from 1.21 × 10⁻³ mm/sec2 to 2.13 × 10⁻³ mm/sec2 (88% increase). (f) Histogram shows distribution of portal venous enhancement 4 weeks after treatment. Mean portal venous enhancement decreased from 54.0% to 2.7% (94.9% decrease).
Figure 4c:
Data were obtained in a 55-year-old man with HCC in the validation data set who was stratified as a dual-parameter responder. Before therapy, index lesion RECIST size was 3.7 cm and volume, 19.7 cm3. After treatment, index lesion RECIST size decreased to 2.7 cm, and volume decreased to 8.6 cm3. (a) Color-coded functional ADC map shows segmented tumor before treatment. (b) Histogram shows distribution of ADC values (measured in micrometers per second squared) before treatment. (c) Histogram shows distribution of portal venous enhancement before treatment. (d) Color-coded functional ADC map shows segmented tumor 4 weeks after treatment. (e) Histogram shows distribution of ADC values (measured in micrometers per second squared) 4 weeks after treatment. Mean ADC increased from 1.21 × 10⁻³ mm/sec2 to 2.13 × 10⁻³ mm/sec2 (88% increase). (f) Histogram shows distribution of portal venous enhancement 4 weeks after treatment. Mean portal venous enhancement decreased from 54.0% to 2.7% (94.9% decrease).
Figure 4d:
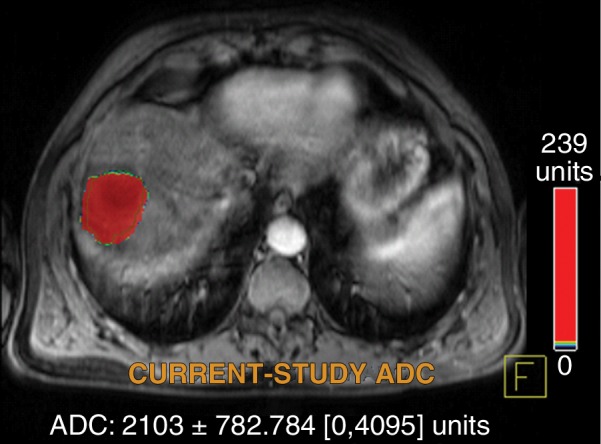
Data were obtained in a 55-year-old man with HCC in the validation data set who was stratified as a dual-parameter responder. Before therapy, index lesion RECIST size was 3.7 cm and volume, 19.7 cm3. After treatment, index lesion RECIST size decreased to 2.7 cm, and volume decreased to 8.6 cm3. (a) Color-coded functional ADC map shows segmented tumor before treatment. (b) Histogram shows distribution of ADC values (measured in micrometers per second squared) before treatment. (c) Histogram shows distribution of portal venous enhancement before treatment. (d) Color-coded functional ADC map shows segmented tumor 4 weeks after treatment. (e) Histogram shows distribution of ADC values (measured in micrometers per second squared) 4 weeks after treatment. Mean ADC increased from 1.21 × 10⁻³ mm/sec2 to 2.13 × 10⁻³ mm/sec2 (88% increase). (f) Histogram shows distribution of portal venous enhancement 4 weeks after treatment. Mean portal venous enhancement decreased from 54.0% to 2.7% (94.9% decrease).
Figure 4e:
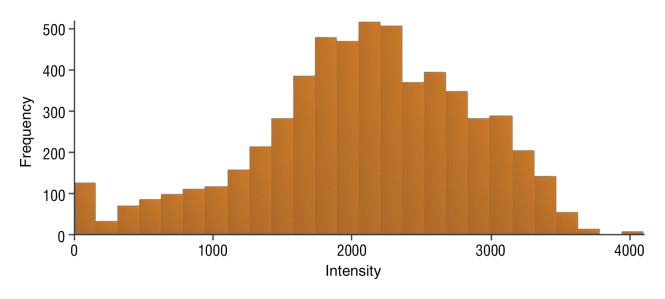
Data were obtained in a 55-year-old man with HCC in the validation data set who was stratified as a dual-parameter responder. Before therapy, index lesion RECIST size was 3.7 cm and volume, 19.7 cm3. After treatment, index lesion RECIST size decreased to 2.7 cm, and volume decreased to 8.6 cm3. (a) Color-coded functional ADC map shows segmented tumor before treatment. (b) Histogram shows distribution of ADC values (measured in micrometers per second squared) before treatment. (c) Histogram shows distribution of portal venous enhancement before treatment. (d) Color-coded functional ADC map shows segmented tumor 4 weeks after treatment. (e) Histogram shows distribution of ADC values (measured in micrometers per second squared) 4 weeks after treatment. Mean ADC increased from 1.21 × 10⁻³ mm/sec2 to 2.13 × 10⁻³ mm/sec2 (88% increase). (f) Histogram shows distribution of portal venous enhancement 4 weeks after treatment. Mean portal venous enhancement decreased from 54.0% to 2.7% (94.9% decrease).
Figure 4f:
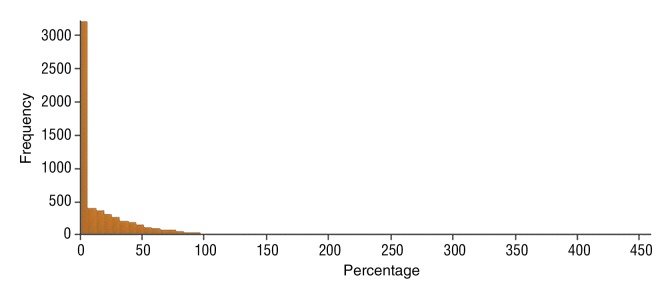
Data were obtained in a 55-year-old man with HCC in the validation data set who was stratified as a dual-parameter responder. Before therapy, index lesion RECIST size was 3.7 cm and volume, 19.7 cm3. After treatment, index lesion RECIST size decreased to 2.7 cm, and volume decreased to 8.6 cm3. (a) Color-coded functional ADC map shows segmented tumor before treatment. (b) Histogram shows distribution of ADC values (measured in micrometers per second squared) before treatment. (c) Histogram shows distribution of portal venous enhancement before treatment. (d) Color-coded functional ADC map shows segmented tumor 4 weeks after treatment. (e) Histogram shows distribution of ADC values (measured in micrometers per second squared) 4 weeks after treatment. Mean ADC increased from 1.21 × 10⁻³ mm/sec2 to 2.13 × 10⁻³ mm/sec2 (88% increase). (f) Histogram shows distribution of portal venous enhancement 4 weeks after treatment. Mean portal venous enhancement decreased from 54.0% to 2.7% (94.9% decrease).
Figure 5a:
Data were obtained in a 79-year old man with HCC in the validation data set who was stratified as a single-parameter responder. Before treatment, index lesion RECIST size was 4.2 cm and volume, 32.4 cm3. After treatment, index lesion RECIST size increased slightly to 4.8 cm, and volume increased to 35.7 cm3. (a) Color-coded functional ADC map shows segmented tumor before treatment. (b) Histogram shows distribution of ADC values (measured in micrometers per second squared) before treatment. (c) Histogram shows distribution of portal venous enhancement before treatment. (d) Color-coded functional ADC map shows segmented tumor 4 weeks after treatment. (e) Histogram shows distribution of ADC values 4 weeks after treatment. Mean ADC increased from 1.19 × 10⁻³ mm/sec2 to 1.81 × 10⁻³ mm/sec2 (52.1% increase). (f) Histogram shows distribution of portal venous enhancement 4 weeks after treatment. Mean portal venous enhancement decreased from 116.9% to 78.1% (33.2% decrease).
Figure 5b:
Data were obtained in a 79-year old man with HCC in the validation data set who was stratified as a single-parameter responder. Before treatment, index lesion RECIST size was 4.2 cm and volume, 32.4 cm3. After treatment, index lesion RECIST size increased slightly to 4.8 cm, and volume increased to 35.7 cm3. (a) Color-coded functional ADC map shows segmented tumor before treatment. (b) Histogram shows distribution of ADC values (measured in micrometers per second squared) before treatment. (c) Histogram shows distribution of portal venous enhancement before treatment. (d) Color-coded functional ADC map shows segmented tumor 4 weeks after treatment. (e) Histogram shows distribution of ADC values 4 weeks after treatment. Mean ADC increased from 1.19 × 10⁻³ mm/sec2 to 1.81 × 10⁻³ mm/sec2 (52.1% increase). (f) Histogram shows distribution of portal venous enhancement 4 weeks after treatment. Mean portal venous enhancement decreased from 116.9% to 78.1% (33.2% decrease).
Figure 5c:
Data were obtained in a 79-year old man with HCC in the validation data set who was stratified as a single-parameter responder. Before treatment, index lesion RECIST size was 4.2 cm and volume, 32.4 cm3. After treatment, index lesion RECIST size increased slightly to 4.8 cm, and volume increased to 35.7 cm3. (a) Color-coded functional ADC map shows segmented tumor before treatment. (b) Histogram shows distribution of ADC values (measured in micrometers per second squared) before treatment. (c) Histogram shows distribution of portal venous enhancement before treatment. (d) Color-coded functional ADC map shows segmented tumor 4 weeks after treatment. (e) Histogram shows distribution of ADC values 4 weeks after treatment. Mean ADC increased from 1.19 × 10⁻³ mm/sec2 to 1.81 × 10⁻³ mm/sec2 (52.1% increase). (f) Histogram shows distribution of portal venous enhancement 4 weeks after treatment. Mean portal venous enhancement decreased from 116.9% to 78.1% (33.2% decrease).
Figure 5d:
Data were obtained in a 79-year old man with HCC in the validation data set who was stratified as a single-parameter responder. Before treatment, index lesion RECIST size was 4.2 cm and volume, 32.4 cm3. After treatment, index lesion RECIST size increased slightly to 4.8 cm, and volume increased to 35.7 cm3. (a) Color-coded functional ADC map shows segmented tumor before treatment. (b) Histogram shows distribution of ADC values (measured in micrometers per second squared) before treatment. (c) Histogram shows distribution of portal venous enhancement before treatment. (d) Color-coded functional ADC map shows segmented tumor 4 weeks after treatment. (e) Histogram shows distribution of ADC values 4 weeks after treatment. Mean ADC increased from 1.19 × 10⁻³ mm/sec2 to 1.81 × 10⁻³ mm/sec2 (52.1% increase). (f) Histogram shows distribution of portal venous enhancement 4 weeks after treatment. Mean portal venous enhancement decreased from 116.9% to 78.1% (33.2% decrease).
Figure 5e:
Data were obtained in a 79-year old man with HCC in the validation data set who was stratified as a single-parameter responder. Before treatment, index lesion RECIST size was 4.2 cm and volume, 32.4 cm3. After treatment, index lesion RECIST size increased slightly to 4.8 cm, and volume increased to 35.7 cm3. (a) Color-coded functional ADC map shows segmented tumor before treatment. (b) Histogram shows distribution of ADC values (measured in micrometers per second squared) before treatment. (c) Histogram shows distribution of portal venous enhancement before treatment. (d) Color-coded functional ADC map shows segmented tumor 4 weeks after treatment. (e) Histogram shows distribution of ADC values 4 weeks after treatment. Mean ADC increased from 1.19 × 10⁻³ mm/sec2 to 1.81 × 10⁻³ mm/sec2 (52.1% increase). (f) Histogram shows distribution of portal venous enhancement 4 weeks after treatment. Mean portal venous enhancement decreased from 116.9% to 78.1% (33.2% decrease).
Figure 5f:
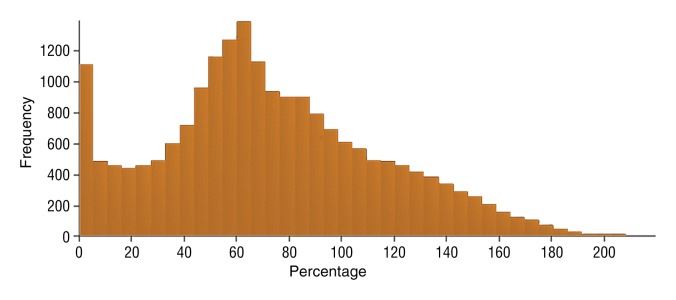
Data were obtained in a 79-year old man with HCC in the validation data set who was stratified as a single-parameter responder. Before treatment, index lesion RECIST size was 4.2 cm and volume, 32.4 cm3. After treatment, index lesion RECIST size increased slightly to 4.8 cm, and volume increased to 35.7 cm3. (a) Color-coded functional ADC map shows segmented tumor before treatment. (b) Histogram shows distribution of ADC values (measured in micrometers per second squared) before treatment. (c) Histogram shows distribution of portal venous enhancement before treatment. (d) Color-coded functional ADC map shows segmented tumor 4 weeks after treatment. (e) Histogram shows distribution of ADC values 4 weeks after treatment. Mean ADC increased from 1.19 × 10⁻³ mm/sec2 to 1.81 × 10⁻³ mm/sec2 (52.1% increase). (f) Histogram shows distribution of portal venous enhancement 4 weeks after treatment. Mean portal venous enhancement decreased from 116.9% to 78.1% (33.2% decrease).
Figure 6b:
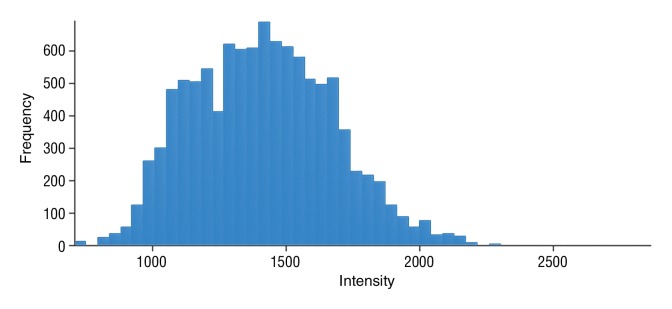
Data were obtained in a 62-year-old man with HCC in the validation data set who was stratified as a nonresponder. Before treatment, index lesion RECIST size was 7.8 cm and volume, 80.4 cm3. After treatment, index lesion RECIST size decreased to 6.9 cm, and volume was 65.0 cm3. (a) Color-coded functional ADC map shows segmented tumor before treatment. (b) Histogram shows distribution of ADC values (measured in micrometers per second squared) before treatment. (c) Histogram shows distribution of portal venous enhancement before treatment. (d) Color-coded functional ADC map shows segmented tumor 4 weeks after treatment. (e) Histogram shows distribution of ADC values 4 weeks after treatment. Mean ADC increased from 1.44 × 10⁻³ mm/sec2 to 1.69 × 10⁻³ mm/sec2 (17.4% increase). (f) Histogram shows distribution of portal venous enhancement 4 weeks after treatment. Mean portal venous enhancement increased from 79.3% to 107.2% (35.3% increase).
Figure 6c:
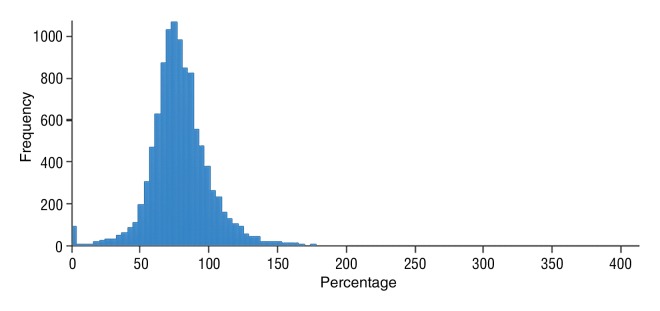
Data were obtained in a 62-year-old man with HCC in the validation data set who was stratified as a nonresponder. Before treatment, index lesion RECIST size was 7.8 cm and volume, 80.4 cm3. After treatment, index lesion RECIST size decreased to 6.9 cm, and volume was 65.0 cm3. (a) Color-coded functional ADC map shows segmented tumor before treatment. (b) Histogram shows distribution of ADC values (measured in micrometers per second squared) before treatment. (c) Histogram shows distribution of portal venous enhancement before treatment. (d) Color-coded functional ADC map shows segmented tumor 4 weeks after treatment. (e) Histogram shows distribution of ADC values 4 weeks after treatment. Mean ADC increased from 1.44 × 10⁻³ mm/sec2 to 1.69 × 10⁻³ mm/sec2 (17.4% increase). (f) Histogram shows distribution of portal venous enhancement 4 weeks after treatment. Mean portal venous enhancement increased from 79.3% to 107.2% (35.3% increase).
Figure 6d:
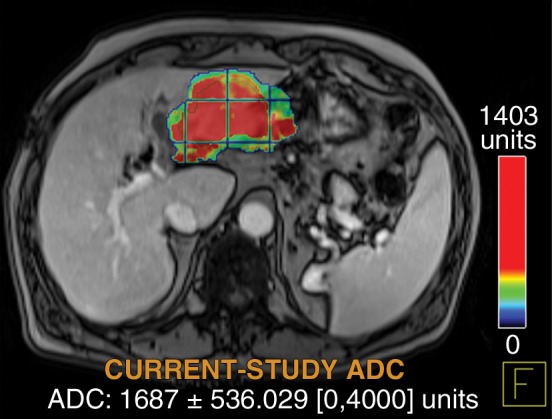
Data were obtained in a 62-year-old man with HCC in the validation data set who was stratified as a nonresponder. Before treatment, index lesion RECIST size was 7.8 cm and volume, 80.4 cm3. After treatment, index lesion RECIST size decreased to 6.9 cm, and volume was 65.0 cm3. (a) Color-coded functional ADC map shows segmented tumor before treatment. (b) Histogram shows distribution of ADC values (measured in micrometers per second squared) before treatment. (c) Histogram shows distribution of portal venous enhancement before treatment. (d) Color-coded functional ADC map shows segmented tumor 4 weeks after treatment. (e) Histogram shows distribution of ADC values 4 weeks after treatment. Mean ADC increased from 1.44 × 10⁻³ mm/sec2 to 1.69 × 10⁻³ mm/sec2 (17.4% increase). (f) Histogram shows distribution of portal venous enhancement 4 weeks after treatment. Mean portal venous enhancement increased from 79.3% to 107.2% (35.3% increase).
Figure 6e:
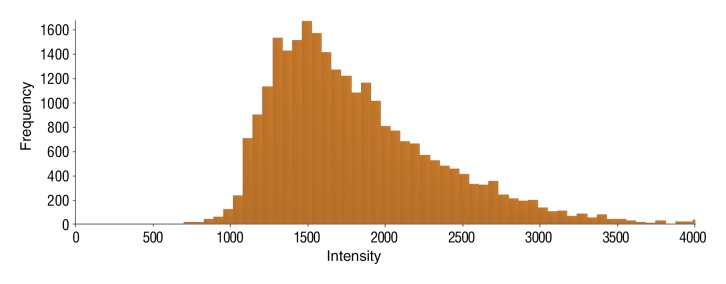
Data were obtained in a 62-year-old man with HCC in the validation data set who was stratified as a nonresponder. Before treatment, index lesion RECIST size was 7.8 cm and volume, 80.4 cm3. After treatment, index lesion RECIST size decreased to 6.9 cm, and volume was 65.0 cm3. (a) Color-coded functional ADC map shows segmented tumor before treatment. (b) Histogram shows distribution of ADC values (measured in micrometers per second squared) before treatment. (c) Histogram shows distribution of portal venous enhancement before treatment. (d) Color-coded functional ADC map shows segmented tumor 4 weeks after treatment. (e) Histogram shows distribution of ADC values 4 weeks after treatment. Mean ADC increased from 1.44 × 10⁻³ mm/sec2 to 1.69 × 10⁻³ mm/sec2 (17.4% increase). (f) Histogram shows distribution of portal venous enhancement 4 weeks after treatment. Mean portal venous enhancement increased from 79.3% to 107.2% (35.3% increase).
Figure 6f:
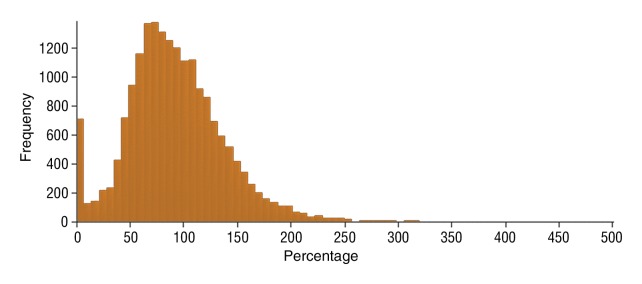
Data were obtained in a 62-year-old man with HCC in the validation data set who was stratified as a nonresponder. Before treatment, index lesion RECIST size was 7.8 cm and volume, 80.4 cm3. After treatment, index lesion RECIST size decreased to 6.9 cm, and volume was 65.0 cm3. (a) Color-coded functional ADC map shows segmented tumor before treatment. (b) Histogram shows distribution of ADC values (measured in micrometers per second squared) before treatment. (c) Histogram shows distribution of portal venous enhancement before treatment. (d) Color-coded functional ADC map shows segmented tumor 4 weeks after treatment. (e) Histogram shows distribution of ADC values 4 weeks after treatment. Mean ADC increased from 1.44 × 10⁻³ mm/sec2 to 1.69 × 10⁻³ mm/sec2 (17.4% increase). (f) Histogram shows distribution of portal venous enhancement 4 weeks after treatment. Mean portal venous enhancement increased from 79.3% to 107.2% (35.3% increase).
Discussion
In our study, we determined the optimal ADC threshold (23% increase) and portal venous enhancement threshold (65% decrease) for prediction of patient survival after IAT in patients with unresectable HCC. Next, an ADC threshold of 25% increase and a portal venous enhancement threshold of 65% were tested in a second smaller validation data set. We saw a significant difference in survival between patients categorized as responders and those categorized as nonresponders according to ADC and VE criteria. Our data further indicate that a combination of the two parameters enables prediction of a better outcome in patients with unresectable HCC who underwent IAT. Patients classified as dual-parameter responders had a 2-year survival rate of 83%, whereas patients classified as single-parameter responders and those classified as nonresponders had 2-year survival rates of 43% and 14%, respectively.
To overcome the limitations of current anatomic response assessment methods, including RECIST, EASL and modified RECIST guidelines (10–14,26–31), we aimed to create HCC-specific volumetric functional MR imaging criteria that can be used to assess viable tumor tissue and provide a strong predictor of response and survival. Software developments have enabled easy, reliable, and reproducible volumetric evaluation of liver lesions (15,17,32). We used proprietary software based on these techniques to analyze two well-described biomarkers of tumor necrosis: ADC maps and contrast-enhanced MR images (20,21). An increase in ADC after therapy has been shown to be associated with cellular edema, fibrosis, necrosis, and apoptosis (33–35). On the other hand, a decrease in contrast enhancement is indicative of disruption of tumor blood supply and has been correlated with necrosis and improved survival in patients with HCC (33,36,37). Both imaging biomarkers performed well in our validation set; however, combining both parameters enabled better stratification of patients. We saw fewer events and longer survival times in patients categorized as dual-parameter responders compared with those categorized as single-parameter responders or nonresponders. In our opinion, this significantly increased survival is due to the fact that these patients also had larger changes in the single parameters (ie, a large increase in ADC and a larger decrease in VE). Furthermore, assessment of response with two variables instead of with one variable can increase the certainty of response assessment. For example, the mean venous enhancement of the entire tumor lesion could decrease due to an increase in tumor size and subsequent central necrosis. Use of two parameters strengthens the diagnosis and enables better stratification of patients.
To test the reliability of the cutoffs we obtained, we tested thresholds in a statistical model with and without the following confounding factors: age, sex, BCLC stage, and number of subsequent treatments (after and in addition to the initial treatment). The hazard ratios for the cutoffs for ADC and VE did not differ between the two models (Cox model without and with confounding variables). Although BCLC was a strong predictor of survival, the addition of the confounding factors had almost no effect on the ADC and VE results within the validation data set.
Our study had several limitations. First, the validation set was a cohort of patients who underwent IAT at the same institution and following the same protocols as the patients in the training set. Thus, our results need to be validated in other populations. Second, almost all patients underwent several IAT sessions; however, in our study, we observed only the change within the index lesions treated at the initial IAT session. Subsequent treatments of the same lesion or of other hepatic lesions may have affected overall survival. Third, the software used in this study is a research tool that is not available for clinical use at this time. Fourth, we divided our sample into a training set and a validation set, thereby losing some statistical power and using a cruder method to estimate the optimal cutoff. Fifth, we did not include arterial phase enhancement in our analysis because the data were less robust compared with those obtained with venous phase enhancement. This may have hindered direct comparison of our results with those of other studies. Sixth, factors such as concurrent liver disease, overall tumor burden, and tumor biology have been shown to be prognostic indicators of survival (38–40) and may have influenced our results. Seventh, VE calculations were based on signal intensity and not on gadolinium concentration in the tissue. Signal intensity variations may have arisen from other factors, such as concurrent lesions or underlying liver disease status, which could not be taken into account in this study.
In conclusion, we determined the optimal cutoffs for volumetric functional MR imaging–based assessment of early response to treatment in patients with unresectable HCC. An ADC increase of 25% and a venous enhancement decrease of 65% enabled excellent stratification into three response groups and were good predictors of overall survival in patients with unresectable HCC. Potential confounding factors, such as patient age, sex, BCLC status, and number of subsequent treatments, did not affect the thresholds identified. Further validation of our data in more patients at multiple centers is needed.
Advances in Knowledge.
• Apparent diffusion coefficient (ADC) responders (25% increase in ADC, 25th percentile survival of 11.2 months vs 4.9 months in nonresponders, P = .008) and venous enhancement responders (65% decrease in venous enhancement, 25th percentile survival of 11.5 months vs 5.1 months in nonresponders, P = .01) showed improved overall survival compared with nonresponders.
• Stratification by using a combination of an increase in ADC and a decrease in venous enhancement resulted in three response groups with significantly different overall survival times (both criteria, too few events to calculate survival; one criterion, 25th percentile survival of 6.0 months; neither criterion, 25th percentile survival of 5.1 months; P = .01).
Implication for Patient Care.
• This study provides evidence that volumetric functional MR imaging thresholds can be used to stratify patients into response categories and may complement or even replace the use of tumor size as a response criterion in patients with unresectable hepatocellular carcinoma after interarterial therapy.
Disclosures of Conflicts of Interest: S.B. Financial activities related to the present article: none to disclose. Financial activities not related to the present article: institution is on the board of Siemens Medical Solutions and Bayer Healthcare; institution received a grant from Siemens Medical Solutions. Other relationships: none to disclose. Z.L. No relevant conflicts of interest to disclose. J.F.H.G. No relevant conflicts of interest to disclose. V.G.H. No relevant conflicts of interest to disclose. C.P.C. No relevant conflicts of interest to disclose. D.R. No relevant conflicts of interest to disclose. T.M.P. No relevant conflicts of interest to disclose. D.B. No relevant conflicts of interest to disclose. J.E. No relevant conflicts of interest to disclose. I.R.K. Financial activities related to the present article: institution received a grant from Siemens Medical Solutions. Financial activities not related to the present article: institution holds a patent for OncoTreat. Other relationships: none to disclose.
Acknowledgments
We are grateful to Mehmet Akif Gulsun, BSc, Atilla Kiraly, PhD, and Li Pan, PhD (Siemens Corporate Research), for their help and support with the MROncotreat software used for image processing. Furthermore, we thank Dhananjay Vaidya MD, PhD, for his statistical advice made possible through support by the Johns Hopkins Institute for Clinical and Translational Research.
Received November 21, 2012; revision requested December 28; revision received January 11, 2013; accepted January 17; final version accepted February 1.
Supported by the Johns Hopkins Institute for Clinical and Translational Research. S.B. and I.R.K. supported by Bracco Diagnostics, Bayer Healthcare, and Siemens Medical.
Current address: Huazhong University of Science and Technology, Tongi Medical College, Department of Radiology, Wuhan, Hubei, China.
Funding: This research was supported by the National Institutes of Health (grant UL1 RR 025005).
See also the other article by Bonekamp et al in this issue.
Abbreviations:
- ADC
- apparent diffusion coefficient
- BCLC
- Barcelona Clinic for Liver Cancer
- EASL
- European Association for the Study of the Liver
- HCC
- hepatocellular carcinoma
- IAT
- intraarterial therapy
- RECIST
- Response Evaluation Criteria in Solid Tumors
- TACE
- transarterial chemoembolization
- VE
- volumetric enhancement in the portal venous phase
References
- 1.Altekruse SF, McGlynn KA, Reichman ME. Hepatocellular carcinoma incidence, mortality, and survival trends in the United States from 1975 to 2005. J Clin Oncol 2009;27(9):1485–1491 [DOI] [PMC free article] [PubMed] [Google Scholar]
- 2.Jemal A, Siegel R, Xu J, Ward E. Cancer statistics, 2010. CA Cancer J Clin 2010;60(5):277–300 [DOI] [PubMed] [Google Scholar]
- 3.Llovet JM, Bruix J. Systematic review of randomized trials for unresectable hepatocellular carcinoma: chemoembolization improves survival. Hepatology 2003;37(2):429–442 [DOI] [PubMed] [Google Scholar]
- 4.Cammà C, Schepis F, Orlando A, et al. Transarterial chemoembolization for unresectable hepatocellular carcinoma: meta-analysis of randomized controlled trials. Radiology 2002;224(1):47–54 [DOI] [PubMed] [Google Scholar]
- 5.Llovet JM, Di Bisceglie AM, Bruix J, et al. Design and endpoints of clinical trials in hepatocellular carcinoma. J Natl Cancer Inst 2008;100(10):698–711 [DOI] [PubMed] [Google Scholar]
- 6.Cabrera R, Nelson DR. Review article: the management of hepatocellular carcinoma. Aliment Pharmacol Ther 2010;31(4):461–476 [DOI] [PubMed] [Google Scholar]
- 7.World Health Organization WHO handbook for reporting results of cancer treatment. Geneva, Switzerland: World Health Organization, 1979 [Google Scholar]
- 8.Vilgrain V. Advancement in HCC imaging: diagnosis, staging and treatment efficacy assessments: hepatocellular carcinoma—imaging in assessing treatment efficacy. J Hepatobiliary Pancreat Sci 2010;17(4):374–379 [DOI] [PubMed] [Google Scholar]
- 9.Forner A, Ayuso C, Varela M, et al. Evaluation of tumor response after locoregional therapies in hepatocellular carcinoma: are response evaluation criteria in solid tumors reliable? Cancer 2009;115(3):616–623 [DOI] [PubMed] [Google Scholar]
- 10.Bruix J, Sherman M, Llovet JM, et al. Clinical management of hepatocellular carcinoma: conclusions of the Barcelona-2000 EASL conference. J Hepatol 2001;35(3):421–430 [DOI] [PubMed] [Google Scholar]
- 11.Lencioni R, Llovet JM. Modified RECIST (mRECIST) assessment for hepatocellular carcinoma. Semin Liver Dis 2010;30(1):52–60 [DOI] [PMC free article] [PubMed] [Google Scholar]
- 12.Suzuki C, Jacobsson H, Hatschek T, et al. Radiologic measurements of tumor response to treatment: practical approaches and limitations. RadioGraphics 2008;28(2):329–344 [DOI] [PubMed] [Google Scholar]
- 13.Suzuki C, Torkzad MR, Jacobsson H, et al. Interobserver and intraobserver variability in the response evaluation of cancer therapy according to RECIST and WHO-criteria. Acta Oncol 2010;49(4):509–514 [DOI] [PubMed] [Google Scholar]
- 14.Llovet JM, Ricci S, Mazzaferro V, et al. Sorafenib in advanced hepatocellular carcinoma. N Engl J Med 2008;359(4):378–390 [DOI] [PubMed] [Google Scholar]
- 15.Gulsun MA, Weiss CR, Strecker R, Meredith G, Kamel IR. A new tool for volumetric and functional analysis of hepatic tumors monitored with multi-modal MRI [abstr]. In: Proceedings of the Seventeenth Meeting of the International Society for Magnetic Resonance in Medicine. Berkeley, Calif: International Society for Magnetic Resonance in Medicine, 2009; 2876 [Google Scholar]
- 16.Wormanns D, Kohl G, Klotz E, et al. Volumetric measurements of pulmonary nodules at multi-row detector CT: in vivo reproducibility. Eur Radiol 2004;14(1):86–92 [DOI] [PubMed] [Google Scholar]
- 17.Puesken M, Juergens KU, Edenfeld A, et al. Accuracy of liver lesion assessment using automated measurement and segmentation software in biphasic multislice CT (MSCT) [in German]. Rofo 2009;181(1):67–73 [DOI] [PubMed] [Google Scholar]
- 18.Van Hoe L, Van Cutsem E, Vergote I, et al. Size quantification of liver metastases in patients undergoing cancer treatment: reproducibility of one-, two-, and three-dimensional measurements determined with spiral CT. Radiology 1997;202(3):671–675 [DOI] [PubMed] [Google Scholar]
- 19.Zhao B, Schwartz LH, Moskowitz CS, Ginsberg MS, Rizvi NA, Kris MG. Lung cancer: computerized quantification of tumor response—initial results. Radiology 2006;241(3):892–898 [DOI] [PubMed] [Google Scholar]
- 20.Moffat BA, Chenevert TL, Lawrence TS, et al. Functional diffusion map: a noninvasive MRI biomarker for early stratification of clinical brain tumor response. Proc Natl Acad Sci U S A 2005;102(15):5524–5529 [DOI] [PMC free article] [PubMed] [Google Scholar]
- 21.Bonekamp S, Jolepalem P, Lazo M, Gulsun MA, Kiraly AP, Kamel IR. Hepatocellular carcinoma: response to TACE assessed with semiautomated volumetric and functional analysis of diffusion-weighted and contrast-enhanced MR imaging data. Radiology 2011;260(3):752–761 [DOI] [PubMed] [Google Scholar]
- 22.Geschwind JF, Ramsey DE, Cleffken B, et al. Transcatheter arterial chemoembolization of liver tumors: effects of embolization protocol on injectable volume of chemotherapy and subsequent arterial patency. Cardiovasc Intervent Radiol 2003;26(2):111–117 [DOI] [PubMed] [Google Scholar]
- 23.Reyes DK, Vossen JA, Kamel IR, et al. Single-center phase II trial of transarterial chemoembolization with drug-eluting beads for patients with unresectable hepatocellular carcinoma: initial experience in the United States. Cancer J 2009;15(6):526–532 [DOI] [PMC free article] [PubMed] [Google Scholar]
- 24.Li Z, Bonekamp S, Halappa VG, et al. Islet cell liver metastases: assessment of volumetric early response with functional MR imaging after transarterial chemoembolization. Radiology 2012;264(1):97–109 [DOI] [PubMed] [Google Scholar]
- 25.Halappa VG, Bonekamp S, Corona-Villalobos CP, et al. Intrahepatic cholangiocarcinoma treated with local-regional therapy: quantitative volumetric apparent diffusion coefficient maps for assessment of tumor response. Radiology 2012;264(1):285–294 [DOI] [PubMed] [Google Scholar]
- 26.Therasse P, Arbuck SG, Eisenhauer EA, et al. New guidelines to evaluate the response to treatment in solid tumors: European Organization for Research and Treatment of Cancer, National Cancer Institute of the United States, National Cancer Institute of Canada. J Natl Cancer Inst 2000;92(3):205–216 [DOI] [PubMed] [Google Scholar]
- 27.Therasse P, Eisenhauer EA, Verweij J. RECIST revisited: a review of validation studies on tumour assessment. Eur J Cancer 2006;42(8):1031–1039 [DOI] [PubMed] [Google Scholar]
- 28.Eisenhauer EA, Therasse P, Bogaerts J, et al. New response evaluation criteria in solid tumours: revised RECIST guideline (version 1.1). Eur J Cancer 2009;45(2):228–247 [DOI] [PubMed] [Google Scholar]
- 29.Atassi B, Bangash AK, Bahrani A, et al. Multimodality imaging following 90Y radioembolization: a comprehensive review and pictorial essay. RadioGraphics 2008;28(1):81–99 [DOI] [PubMed] [Google Scholar]
- 30.Kim YS, Rhim H, Lim HK. Imaging after radiofrequency ablation of hepatic tumors. Semin Ultrasound CT MR 2009;30(2):49–66 [DOI] [PubMed] [Google Scholar]
- 31.Kuszyk BS, Boitnott JK, Choti MA, et al. Local tumor recurrence following hepatic cryoablation: radiologic-histopathologic correlation in a rabbit model. Radiology 2000;217(2):477–486 [DOI] [PubMed] [Google Scholar]
- 32.Chalian H, Tochetto SM, Töre HG, Rezai P, Yaghmai V. Hepatic tumors: region-of-interest versus volumetric analysis for quantification of attenuation at CT. Radiology 2012;262(3):853–861 [DOI] [PubMed] [Google Scholar]
- 33.Mannelli L, Kim S, Hajdu CH, Babb JS, Clark TW, Taouli B. Assessment of tumor necrosis of hepatocellular carcinoma after chemoembolization: diffusion-weighted and contrast-enhanced MRI with histopathologic correlation of the explanted liver. AJR Am J Roentgenol 2009;193(4):1044–1052 [DOI] [PubMed] [Google Scholar]
- 34.Padhani AR, Liu G, Koh DM, et al. Diffusion-weighted magnetic resonance imaging as a cancer biomarker: consensus and recommendations. Neoplasia 2009;11(2):102–125 [DOI] [PMC free article] [PubMed] [Google Scholar]
- 35.Kamel IR, Liapi E, Reyes DK, Zahurak M, Bluemke DA, Geschwind JF. Unresectable hepatocellular carcinoma: serial early vascular and cellular changes after transarterial chemoembolization as detected with MR imaging. Radiology 2009;250(2):466–473 [DOI] [PMC free article] [PubMed] [Google Scholar]
- 36.Kim S, Mannelli L, Hajdu CH, et al. Hepatocellular carcinoma: assessment of response to transarterial chemoembolization with image subtraction. J Magn Reson Imaging 2010;31(2):348–355 [DOI] [PubMed] [Google Scholar]
- 37.Memon K, Kulik L, Lewandowski RJ, et al. Radiographic response to locoregional therapy in hepatocellular carcinoma predicts patient survival times. Gastroenterology 2011;141(2):526–535, 535.e1–e2 [DOI] [PMC free article] [PubMed] [Google Scholar]
- 38.Jin B, Wang D, Lewandowski RJ, et al. Chemoembolization endpoints: effect on survival among patients with hepatocellular carcinoma. AJR Am J Roentgenol 2011;196(4):919–928 [DOI] [PMC free article] [PubMed] [Google Scholar]
- 39.Lewandowski RJ, Mulcahy MF, Kulik LM, et al. Chemoembolization for hepatocellular carcinoma: comprehensive imaging and survival analysis in a 172-patient cohort. Radiology 2010;255(3):955–965 [DOI] [PMC free article] [PubMed] [Google Scholar]
- 40.Olivo M, Valenza F, Buccellato A, et al. Transcatheter arterial chemoembolisation for hepatocellular carcinoma in cirrhosis: survival rate and prognostic factors. Dig Liver Dis 2010;42(7):515–519 [DOI] [PubMed] [Google Scholar]


