This study demonstrates the possibility of using 3.0-T MR imaging to delineate the distribution of locally infused contrast agents within the coronary artery walls and establishes the groundwork to explore molecular MR imaging–guided intracoronary local gene or drug therapy.
Abstract
Purpose:
To develop a technique with clinical 3.0-T magnetic resonance (MR) imaging to delineate local contrast agent distribution in coronary artery walls for potential molecular MR imaging–guided local gene or drug therapy of atherosclerotic coronary artery disease.
Materials and methods:
This animal protocol was approved by the institutional animal care and use committee and was in compliance with the Guide for the Care and Use of Laboratory Animals. For in vitro confirmation, human arterial smooth muscle cells (SMCs) were used to determine capability of SMCs in uptake of motexafin gadolinium (MGd) and its optimal dose. For ex vivo evaluation, a 2-mL mixture of MGd and trypan blue was locally infused into coronary artery walls of six cadaveric pig hearts with MR monitoring and an MR imaging guidewire, surface coils, or both. For in vivo validation, the balloon catheter was placed into coronary arteries of seven living pigs, and the MGd and trypan blue mixture was infused into arterial walls with MR guidance. Signal-to-noise ratio (SNR) and contrast-to-noise ratio (CNR) of coronary artery walls were recorded by using different coils between pre- and postcontrast infusion, with subsequent histologic confirmation. Paired Student t tests were used to compare average SNRs and CNRs of arterial walls before and after contrast agent infusion with different coils.
Results:
SMCs could take up MGd with the optimal concentration at 150 µmol/L. Average SNR with the MR imaging guidewire and surface coil combination was significantly higher than that with the MR imaging guidewire only or with surface coils only (P < .05), and average SNR and CNR of postinfusion MR imaging was significantly higher than that of preinfusion MR imaging (P < .05). Histologic analysis was used to confirm successful intracoronary infiltration of MGd and trypan blue within coronary artery walls.
Conclusion:
MR imaging can be used to delineate locally infused contrast agent distribution in coronary artery walls. This establishes groundwork for development of molecular MR imaging–guided intracoronary therapy.
© RSNA, 2013
Supplemental material: http://radiology.rsna.org/lookup/suppl/doi:10.1148/radiol.13121451/-/DC1
Introduction
Atherosclerotic cardiovascular disease is still the leading cause of death in developed countries (1), even though tremendous efforts have been made to prevent, diagnose, and efficiently treat this illness over the past few decades. Medication, coronary artery bypass grafting, and percutaneous coronary interventions are currently available methods used to reduce the risk of myocardial infarction due to atherosclerotic coronary artery disease (2,3). However, these methods have their drawbacks. Although medication can provide an opportunity to prevent thrombosis formation and relieve the symptoms, it cannot remove atherosclerotic plaques, especially vulnerable plaques, which are the entity of this life-threatening disease (4). Coronary artery bypass grafting is a surgical method used to treat atherosclerotic coronary artery disease, but it is an invasive approach (5). Percutaneous coronary intervention is a minimally invasive technique that can be used to effectively treat nondiffused atherosclerotic lesions. However, in-stent restenosis may reverse the therapeutic effectiveness. Although drug-eluting stents can substantially reduce in-stent restenosis (6), severe complications, such as late in-stent thrombosis with in-stent restenosis, have been reported (7,8). Thus, it is necessary to explore alternatives for efficient management of atherosclerotic coronary artery disease.
Systemic administration of therapeutic agents into the coronary arteries does not permit deposition of highly concentrated therapeutic agents at the targets. Current endovascular delivery of therapeutic agents with x-ray imaging guidance does not enable visualization of the distribution of delivered therapeutic agents within the coronary artery walls. Relatively recently, a technique in which magnetic resonance (MR) imaging is used to guide contrast agent delivery and monitor distribution of contrast agents within the peripheral arterial walls was developed (9). This technique is merged with the intravascular MR imaging technique by placing an MR imaging guidewire into arteries to generate high-spatial-resolution MR images of the arterial walls (10,11). The aim of this study was to develop a technique with clinical 3.0-T MR imaging to delineate local contrast agent distribution in coronary artery walls for potential molecular MR imaging–guided local gene or drug therapy of atherosclerotic coronary artery disease.
Materials and Methods
Pharmacyclics (Sunnyvale, Calif) provided motexafin gadolinium (MGd). One author (J.W.) is an employee of Philips Research North America; therefore, all other authors had direct control of the data and information submitted for publication.
This study was divided into three phases: An in vitro study was performed to confirm the capability of vascular cells in the uptake of a multifunctional agent, MGd, and to optimize the MGd concentration. An ex vivo study was performed to establish the protocol of using MR imaging to delineate the extent of MGd distribution in the coronary artery walls. An in vivo study was performed to validate the feasibility of using clinical 3.0-T MR imaging to delineate the local distribution of MGd in the coronary artery walls of living pigs.
Contrast Agent
MGd is a multifunctional porphyrin-like (texaphyrin) agent that contains gadolinium within its macrocyclic core. MGd can be taken up by metabolically active tissues, such as atherosclerotic plaques or cancer cells, and thereby function as an antiinflammatory agent in the treatment of atherosclerosis. This agent is visible at MR imaging, which shortens T1 time to increase signal intensity at T1-weighted imaging. In addition, the fluorescent properties of MGd enable it to be detected with a confocal microscope, with emitted fluorescence at 740 nm when excited at 470 nm (12,13).
In Vitro Study
The in vitro study included three cell groups. The first group of cells was used to confirm intracellularization of MGd in human arterial smooth muscle cells (SMCs), the second group was used to determine the optimal concentration of MGd for subsequent ex vivo and in vivo animal studies, and the third group was used to determine the optimal MGd incubation time.
Primary artery SMCs (Lonza, Walkersville, Md) were divided into three cell groups. In the first cell group, 2.5 × 10⁴ cells were seeded and cultured with the SmGM-2 BulletKit (Lonza) in a four-chamber cell culture plate (Nalge Nunc International, Rochester, NY). The cells in two wells were treated by adding 100-µmol/L MGd (Pharmacyclics), while cells in the remaining two wells were not treated and served as controls. After the cells were cultured in a 37°C incubator for 24 hours, they were washed twice with phosphate-buffered saline to remove free MGd that was not bound to the cell membranes or that did not internalize the cells. The cells were counterstained with 4’,6-diamidino-2-phenylindole (DAPI; Vector Laboratories, Burlingame, Calif) and imaged with a laser confocal microscope (A1R; Nikon, Tokyo, Japan) to detect the MGd-emitted red fluorescence within the SMCs. A bright-field microscopic image was also obtained, and the fluorescent images were merged with the bright-field images to show the intracellular location of MGd.
The second cell group was used to determine the optimal MGd dosage. Additional SMCs were cultured in the four-chamber plates. The cells in each well were exposed to different concentrations of MGd (0, 50 , 100 , 150 , 200 , and 300 µmol/L MGd). The cells were then incubated and washed with the same method described previously. The experiment for each concentration was repeated six times. In each cell group, five cells were selected by randomly picking up five fields of microscopic views, and one cell in each field was selected at random for imaging with the confocal microscope. Image J software (version 1.45s; National Institutes of Health, Bethesda, Md) was used to measure signal intensities of MGd-emitted red fluorescence in the six cell wells in each cell group to obtain average signal intensities, which were subsequently plotted against MGd concentrations. Meanwhile, we diluted MGd to 0, 50, 100, 150, 200, and 300 µmol/L with phosphate-buffered saline and poured the mixture into 0.6-mL Eppendorf tubes. The tubes were then examined with 3.0-T MR imaging (Achieva; Philips Healthcare, Best, the Netherlands) to acquire T1 maps with the Look-Locker sequence. In accordance with the MGd fluorescent intensity and T1 value, the optimal concentration of MGd was determined for the subsequent ex vivo and in vivo studies with intracoronary local delivery of MGd.
The third cell group was used to test the optimal MGd incubation time. SMCs were cultured in the four-chamber plates. The cells in each well were exposed to 150-µmol/L MGd for 5, 15, 30, and 60 minutes and for 2, 4, 8, 16, and 24 hours. The cells were incubated under the same conditions and washed by using the same method described previously. The experiment for each incubation time was repeated six times. The signal intensity of MGd-emitted red fluorescence was measured and calculated with the same methods described previously.
Ex Vivo Study
Seven cadaveric pig hearts were harvested and fixed in a plastic box that was filled with 0.9% saline for 3.0-T MR imaging. One heart was used to test the custom 0.014-inch MR imaging guidewire and two 6-inch surface coils. The MR imaging guidewire was placed in the left coronary artery, and the surface coils were placed anteriorly and posteriorly on the heart (11). T1-weighted MR images were acquired by using (a) only the MR imaging guidewire, (b) only the surface coils, and (c) a combination of the MR imaging guidewire and surface coils. The MR imaging parameters included a spin-echo sequence for axial T1-weighted imaging of the target vessels (repetition time msec/echo time msec, 500/8; field of view, 200 × 200 mm; matrix, 400 × 395; section thickness, 5 mm; and four signals acquired).
Thereafter, a custom infusion balloon catheter (Sterling; Boston Scientific, Natick, Mass) that had multiple micropores on the balloon was placed into the left anterior descending coronary artery in six hearts. The 0.014-inch MR imaging guidewire was placed with the guidewire channel of the balloon catheter, and the two 6-inch surface coils were placed anteriorly and posteriorly on the heart. Since the diameters of the proximal coronary arteries of 40–50-kg pigs were approximately 3.0–3.5 mm, we used a balloon diameter of 3.5–4.0 mm. A 2-mL mixture of 150 µmol/L MGd and trypan blue (Amresco, Solon, Ohio) was infused locally into coronary artery walls with the balloon at an approximate flow rate of 0.5 mL/sec. T1-weighted MR images were acquired before and after contrast agent infusion by using only the MR imaging guidewire, only the surface coils, and a combination of the MR imaging guidewire and surface coils.
After satisfactory MR images were obtained, the targeted coronary artery segments and the three segments of the right coronary arteries that served as controls were harvested and cryosliced at a 5-µm thickness. We then used a microscope (Olympus BX51; Olympus America, Center Valley, Pa) to detect the trypan blue and red fluorescence emitted by MGd within the arterial walls.
In Vivo Study
The animal protocol was approved by the institutional animal care and use committee of the University of Washington and was in compliance with the National Institutes of Health Guide for the Care and Use of Laboratory Animals. Seven domestic pigs that weighed 40–50 kg were sedated with intramuscular injection of telazol (4.4 mg per kilogram of body weight) and mechanically ventilated with 1%–3% isoflurane mixed with 1 L/min oxygen. Heparin (200 U per kilogram of body weight) was administered intravenously to prevent thrombosis formation.
A 9-F sheath (Braun Medical, Bethlehem, Pa) was placed in the right carotid artery via a surgical cut-down or an ultrasonographically guided (Sonosite 180 Plus; Sonosite, Bothell, Wash) percutaneous access. With fluoroscopic guidance (OEC 9900 Elite C-arm; GE Medical Systems, Salt Lake City, Utah), an 8-F guiding catheter (Cordis, Miami, Fla) was positioned in the orifice of the left coronary artery, where coronary angiography subsequently was performed. Then, the custom-made infusion balloon catheter, with a balloon diameter of 3.5–4.0 mm and a length of 20 mm, was advanced into the proximal segment of either the left anterior descending coronary artery or the left circumflex coronary artery over a 0.014-inch guidewire. For precise histologic correlation, the position of the balloon was marked by measuring the distance from the bifurcation of the left main coronary artery to the proximal balloon marker. The pig was then transferred for MR imaging.
A torso coil (Philips) was placed anteriorly and posteriorly around the chest to obtain the following MR images: (a) A real-time two-dimensional sequence was performed to acquire cine images of an entire cardiac circle; these images were then used to determine the trigger delay time. (b) Two-dimensional bright-blood images of the left coronary artery were acquired to display the left main coronary artery and its two main branches, the left anterior descending coronary artery and the left circumflex coronary artery. (c) Cross-sectional T1-weighted images of the target coronary artery walls were acquired before and after infusion of 5 mL of the 150-µmol/L MGd and trypan blue mixture. The imaging parameters of T1-weighted MR imaging included a spin-echo sequence with improved motion-sensitized driven equilibrium (14) (600/21; field of view, 300 × 300 mm; 376 × 371 matrix; 5-mm section thickness; two signals acquired). For each of the targeted coronary artery segments, a total of four sections were obtained. The examination was triggered by echocardiographic and respiratory gating, with a vertical two-dimensional selective real-time navigator through the dome of the right hemidiaphragm. Because of current technical limitations in the generation of intracoronary artery wall images in living pigs with the 3.0-T MR imager, we did not apply the combination coils for the in vivo study. The MGd and trypan blue mixture was infused through micropores of the infusion balloon into the coronary artery wall. The infusion was divided into two times, with 30 seconds for each time, and a 30-second interval. Immediately after infusion, postinfusion images were acquired.
After satisfactory MR images were obtained, the pigs were euthanized with intravenous injection of sodium pentobarbital (100 mg/kg), and the heart was harvested. For all pigs, the time between intracoronary MGd infusion and heart harvest for histologic analysis was within 1 hour.
According to coronary artery angiogram measurements, the target coronary artery segments were localized and harvested for subsequent histologic correlation and confirmation. Three segments of the right coronary artery were also harvested to serve as controls.
Image Analysis
Image analysis was performed by two radiologists working in consensus (Y.M., X.Y.; 10 and 30 years of experience in MR imaging, respectively). All of the cross-sectional coronary artery images were transferred to a computer equipped with Digital Imaging and Communications in Medicine software (DICOM Viewer R2.6; Philips). The total signal intensity (Stotal) of the total vessel area (Atotal) and the vessel luminal signal intensity (Slumen) of the vessel luminal area (Alumen) were measured with ROI by manually delineating the inner and outer boundaries of the target arterial walls. Then, the average signal intensity of the arterial wall (Swall) was calculated with Equation (1), as follows:
We also recorded the signal intensity of the adjacent myocardium (Sadjacent) by placing an ROI in the ventricular wall adjacent to the coronary artery. The standard deviation of the background noise (SD) was automatically calculated by the software when we positioned the ROI on the background of each image. Subsequently, the signal-to-noise ratio (SNR) and contrast-to-noise ratio (CNR) were calculated with the following equations:
and
Statistical Analysis
For the ex vivo study, a paired Student t test was used to compare the average SNRs and CNRs of arterial walls generated with only the MR imaging guidewire, only the surface coils, and a combination of the MR imaging guidewire and surface coils between pre- and postcontrast infusion. For in vivo study, the paired Student t test was used to compare the average SNRs and CNRs of arterial walls before and after infusion of the MGd and trypan blue mixture. P < .05 indicated a significant difference.
Results
In the in vitro study, MGd-emitted red fluorescence was detected in exposed SMCs. Confocal microscopic imaging showed that the red fluorescence was within the cytoplasm, which was not detected in the control cells (Fig 1). Confocal microscopy showed that at the MGd concentration of 150 µmol/L, the fluorescent signal intensity began to reach its maximum. MR T1 mapping showed that the T1 value began to reach its minimum at 150 µmol/L (Fig 1). Thus, we selected 150 µmol/L as the optimal concentration, which enabled us to generate high fluorescent signal intensity and high SNR with T1-weighted imaging. The optimal MGd concentration was used for subsequent ex vivo and in vivo experiments. Confocal microscopy also showed that the signal intensity of MGd-emitted red fluorescence began to increase 5 minutes after incubation and peaked 2 hours after incubation.
Figure 1a:
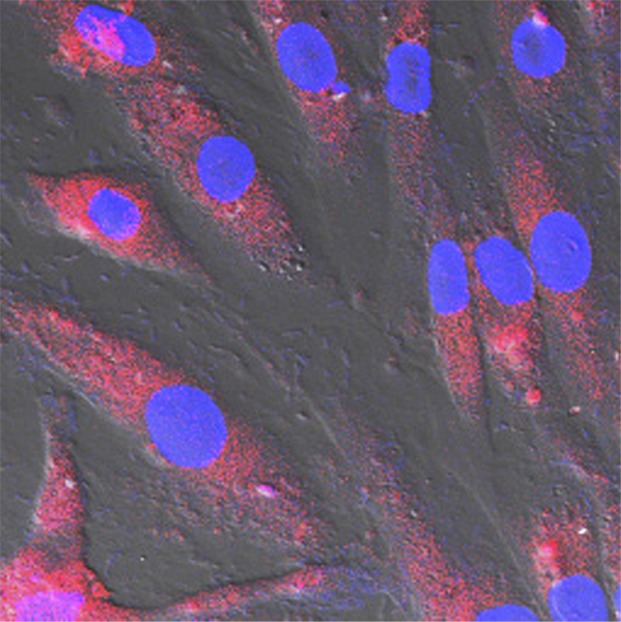
(a, b) Confocal microscopic images. MGd-exposed SMCs show (a) red fluorescent spots within the cytoplasm when compared with (b) nonexposed control cells. Blue indicates nuclei. (c) T1 map shows T1 values decrease as MGd concentrations increase. Numbers indicate MGd concentration in micromoles per liter. (d) Average fluorescent signal intensity (SI) and T1 value plotted against MGd concentration for SMCs shows that 150 µmol/L is the optimal concentration, at which signal intensity begins to peak. A.U. = arbitrary units.
Figure 1b:
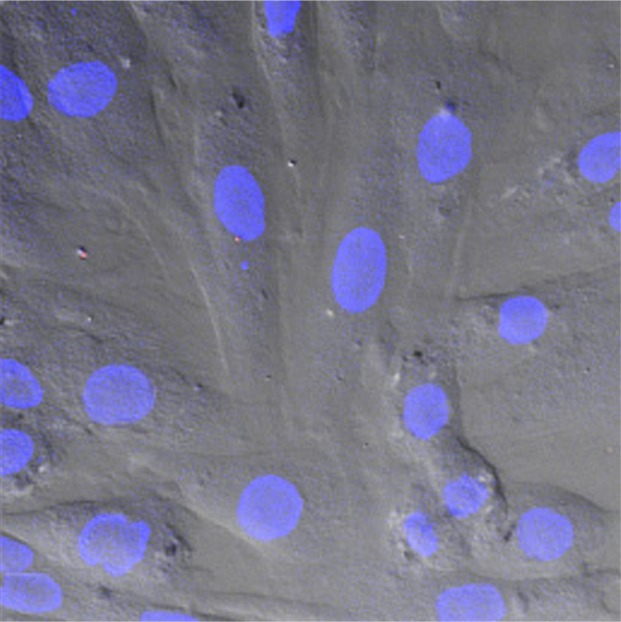
(a, b) Confocal microscopic images. MGd-exposed SMCs show (a) red fluorescent spots within the cytoplasm when compared with (b) nonexposed control cells. Blue indicates nuclei. (c) T1 map shows T1 values decrease as MGd concentrations increase. Numbers indicate MGd concentration in micromoles per liter. (d) Average fluorescent signal intensity (SI) and T1 value plotted against MGd concentration for SMCs shows that 150 µmol/L is the optimal concentration, at which signal intensity begins to peak. A.U. = arbitrary units.
Figure 1c:
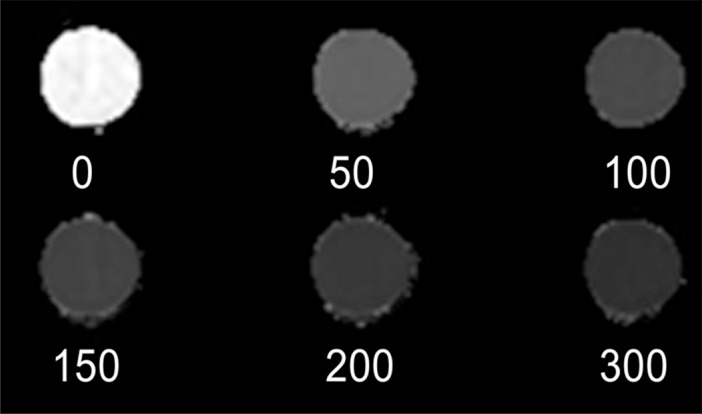
(a, b) Confocal microscopic images. MGd-exposed SMCs show (a) red fluorescent spots within the cytoplasm when compared with (b) nonexposed control cells. Blue indicates nuclei. (c) T1 map shows T1 values decrease as MGd concentrations increase. Numbers indicate MGd concentration in micromoles per liter. (d) Average fluorescent signal intensity (SI) and T1 value plotted against MGd concentration for SMCs shows that 150 µmol/L is the optimal concentration, at which signal intensity begins to peak. A.U. = arbitrary units.
Figure 1d:
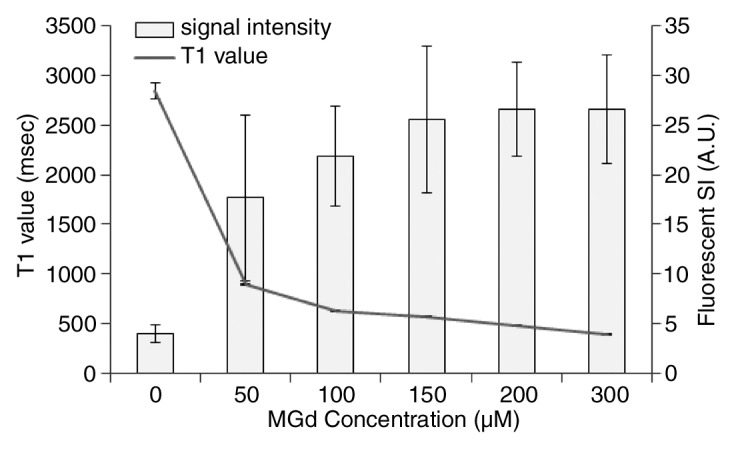
(a, b) Confocal microscopic images. MGd-exposed SMCs show (a) red fluorescent spots within the cytoplasm when compared with (b) nonexposed control cells. Blue indicates nuclei. (c) T1 map shows T1 values decrease as MGd concentrations increase. Numbers indicate MGd concentration in micromoles per liter. (d) Average fluorescent signal intensity (SI) and T1 value plotted against MGd concentration for SMCs shows that 150 µmol/L is the optimal concentration, at which signal intensity begins to peak. A.U. = arbitrary units.
In the ex vivo study, we obtained successful images by using only the MR imaging guidewire, only the surface coils, and a combination of the MR imaging guidewire and surface coils (Fig E1 [online]). The average SNRs at postcontrast imaging were significantly higher than those at precontrast imaging in different coil groups (only MR imaging guidewire: 105.5 ± 34.5 [standard deviation] vs 63.4 ± 12.9, P = .044; only surface coils: 81.9 ± 29.2 vs 47.0 ± 9.4, P = .035; both MR imaging guidewire and surface coils: 159.2 ± 47.4 vs 85.6 ± 30.2, P = .012). Among the different coil groups, the combination of MR imaging guidewire and surface coils generated the highest SNRs (P < .05) (Fig E2 [online]). The average CNRs of postcontrast imaging were also significantly higher than those of precontrast imaging in different coil groups (only MR imaging guidewire: 72.7 ± 34.5 vs 23.4 ± 16.9, P = .018; only surface coils: 44.1 ± 31.1 vs 5.3 ± 10.3, P = .040; both MR imaging guidewire and surface coils: 103.8 ± 52.9 vs 26.0 ± 11.6, P = .013). Histologic analysis showed MGd-emitted red fluorescent spots and blue dye infiltration within the target coronary artery walls; this was not seen in control arterial walls (Fig E3 [online]).
In the in vivo study, all seven pigs survived the experimental procedures, and both pre- and postcontrast images of the coronary artery walls were obtained successfully (Fig 2). Average SNR and CNR of postcontrast images were significantly higher than those of precontrast images (SNR: 17.5 ± 6.6 vs 12.1 ± 3.4, P = .008; CNR: 7.5 ± 4.3 vs 2.4 ± 3.1, P = .010) (Fig 3). Histologic analysis showed MGd-emitted red fluorescent spots and blue dye infiltration within the target arterial walls (Fig 2).
Figure 2a:
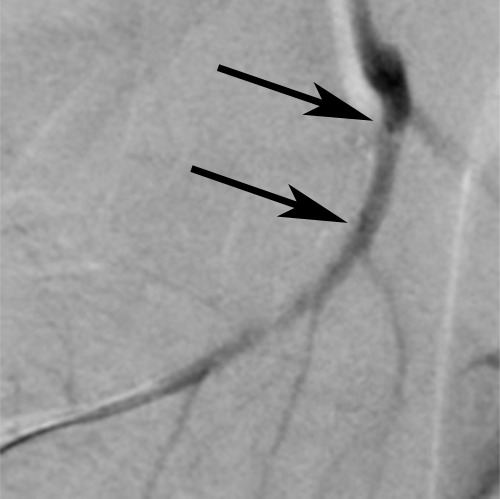
In vivo MGd and trypan blue infusion into the coronary artery walls. (a) With radiographic guidance, the infusion balloon catheter is placed into the left anterior descending coronary artery. Note the two markers of the balloon (arrows). (b) A 3.0-T MR coronary angiogram shows targeted left anterior descending segment, from which axial MR images are acquired. (c, d) Axial coronary artery wall MR images obtained (c) before and (d) after contrast agent infusion show the artery wall (arrow). Note enhancement in d. (e–h) Histologic analysis enabled us to confirm (e) blue dye deposit and (f) MGd-emitted red fluorescent spots through the target coronary artery walls, which were not seen in (g, h) control artery walls. Arrows = intima.
Figure 3:

Bar graph shows SNR and CNR from coronary artery wall MR imaging. Average SNR and CNR of postcontrast imaging were significantly higher than those of precontrast imaging. Error bars = standard deviations. A.U. = arbitrary units.
Figure 2b:
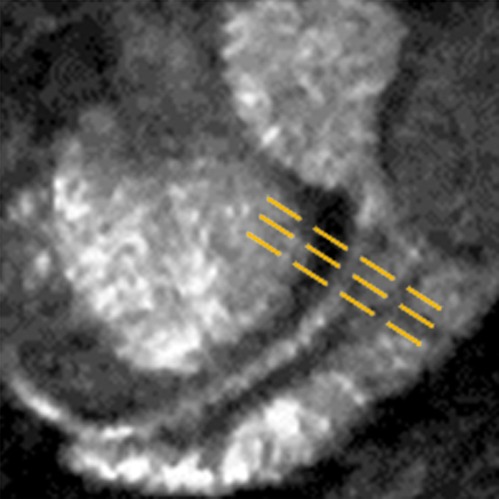
In vivo MGd and trypan blue infusion into the coronary artery walls. (a) With radiographic guidance, the infusion balloon catheter is placed into the left anterior descending coronary artery. Note the two markers of the balloon (arrows). (b) A 3.0-T MR coronary angiogram shows targeted left anterior descending segment, from which axial MR images are acquired. (c, d) Axial coronary artery wall MR images obtained (c) before and (d) after contrast agent infusion show the artery wall (arrow). Note enhancement in d. (e–h) Histologic analysis enabled us to confirm (e) blue dye deposit and (f) MGd-emitted red fluorescent spots through the target coronary artery walls, which were not seen in (g, h) control artery walls. Arrows = intima.
Figure 2c:
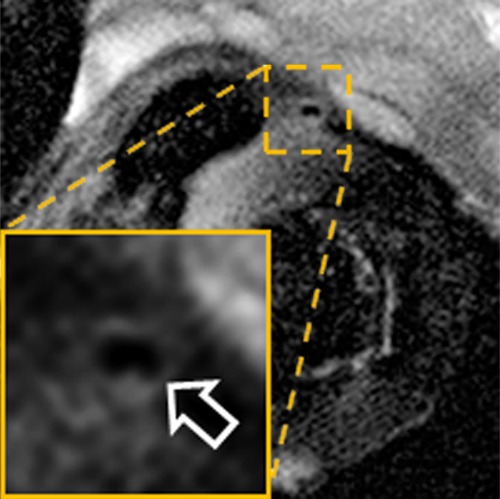
In vivo MGd and trypan blue infusion into the coronary artery walls. (a) With radiographic guidance, the infusion balloon catheter is placed into the left anterior descending coronary artery. Note the two markers of the balloon (arrows). (b) A 3.0-T MR coronary angiogram shows targeted left anterior descending segment, from which axial MR images are acquired. (c, d) Axial coronary artery wall MR images obtained (c) before and (d) after contrast agent infusion show the artery wall (arrow). Note enhancement in d. (e–h) Histologic analysis enabled us to confirm (e) blue dye deposit and (f) MGd-emitted red fluorescent spots through the target coronary artery walls, which were not seen in (g, h) control artery walls. Arrows = intima.
Figure 2d:
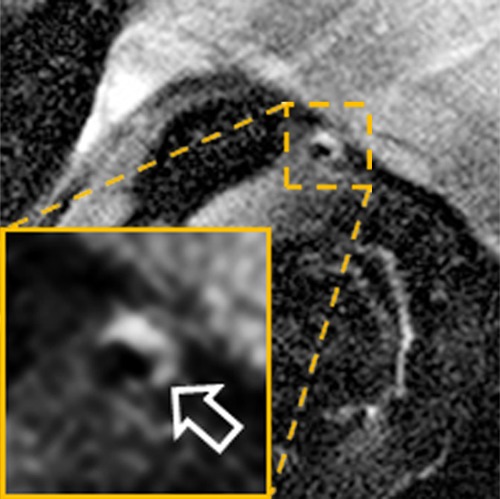
In vivo MGd and trypan blue infusion into the coronary artery walls. (a) With radiographic guidance, the infusion balloon catheter is placed into the left anterior descending coronary artery. Note the two markers of the balloon (arrows). (b) A 3.0-T MR coronary angiogram shows targeted left anterior descending segment, from which axial MR images are acquired. (c, d) Axial coronary artery wall MR images obtained (c) before and (d) after contrast agent infusion show the artery wall (arrow). Note enhancement in d. (e–h) Histologic analysis enabled us to confirm (e) blue dye deposit and (f) MGd-emitted red fluorescent spots through the target coronary artery walls, which were not seen in (g, h) control artery walls. Arrows = intima.
Figure 2e:
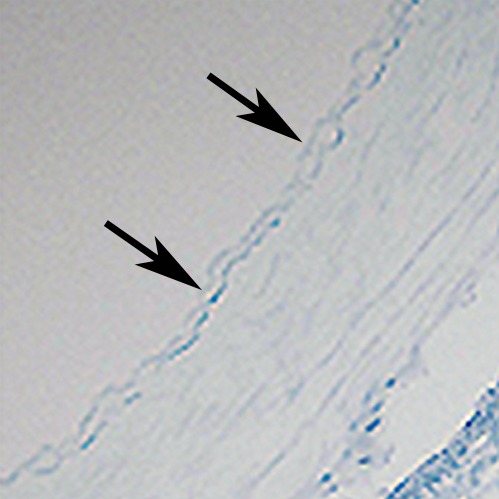
In vivo MGd and trypan blue infusion into the coronary artery walls. (a) With radiographic guidance, the infusion balloon catheter is placed into the left anterior descending coronary artery. Note the two markers of the balloon (arrows). (b) A 3.0-T MR coronary angiogram shows targeted left anterior descending segment, from which axial MR images are acquired. (c, d) Axial coronary artery wall MR images obtained (c) before and (d) after contrast agent infusion show the artery wall (arrow). Note enhancement in d. (e–h) Histologic analysis enabled us to confirm (e) blue dye deposit and (f) MGd-emitted red fluorescent spots through the target coronary artery walls, which were not seen in (g, h) control artery walls. Arrows = intima.
Figure 2f:
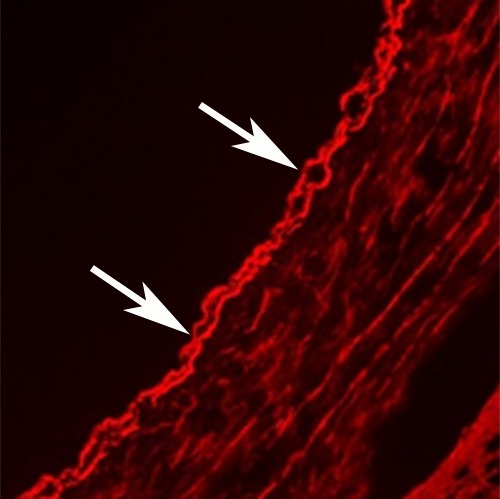
In vivo MGd and trypan blue infusion into the coronary artery walls. (a) With radiographic guidance, the infusion balloon catheter is placed into the left anterior descending coronary artery. Note the two markers of the balloon (arrows). (b) A 3.0-T MR coronary angiogram shows targeted left anterior descending segment, from which axial MR images are acquired. (c, d) Axial coronary artery wall MR images obtained (c) before and (d) after contrast agent infusion show the artery wall (arrow). Note enhancement in d. (e–h) Histologic analysis enabled us to confirm (e) blue dye deposit and (f) MGd-emitted red fluorescent spots through the target coronary artery walls, which were not seen in (g, h) control artery walls. Arrows = intima.
Figure 2g:
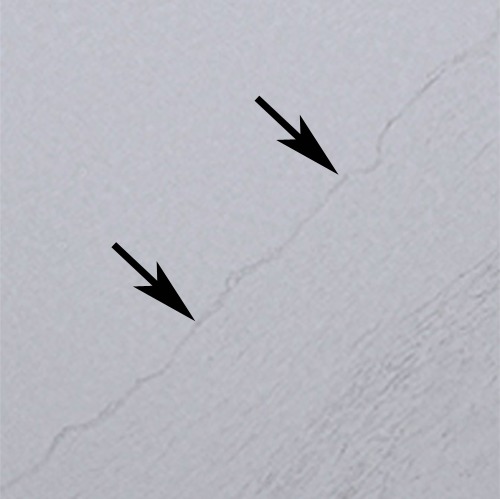
In vivo MGd and trypan blue infusion into the coronary artery walls. (a) With radiographic guidance, the infusion balloon catheter is placed into the left anterior descending coronary artery. Note the two markers of the balloon (arrows). (b) A 3.0-T MR coronary angiogram shows targeted left anterior descending segment, from which axial MR images are acquired. (c, d) Axial coronary artery wall MR images obtained (c) before and (d) after contrast agent infusion show the artery wall (arrow). Note enhancement in d. (e–h) Histologic analysis enabled us to confirm (e) blue dye deposit and (f) MGd-emitted red fluorescent spots through the target coronary artery walls, which were not seen in (g, h) control artery walls. Arrows = intima.
Figure 2h:
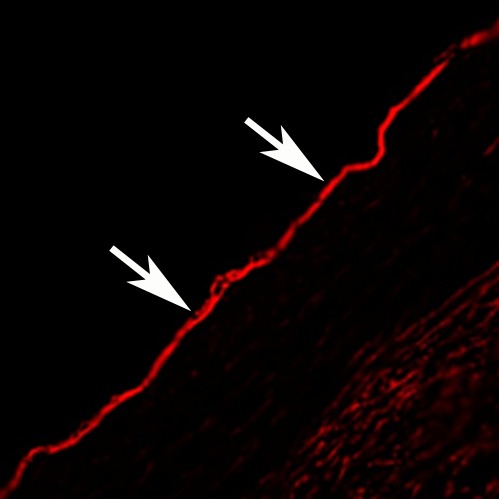
In vivo MGd and trypan blue infusion into the coronary artery walls. (a) With radiographic guidance, the infusion balloon catheter is placed into the left anterior descending coronary artery. Note the two markers of the balloon (arrows). (b) A 3.0-T MR coronary angiogram shows targeted left anterior descending segment, from which axial MR images are acquired. (c, d) Axial coronary artery wall MR images obtained (c) before and (d) after contrast agent infusion show the artery wall (arrow). Note enhancement in d. (e–h) Histologic analysis enabled us to confirm (e) blue dye deposit and (f) MGd-emitted red fluorescent spots through the target coronary artery walls, which were not seen in (g, h) control artery walls. Arrows = intima.
Discussion
In the current study, we first confirmed the capability of human arterial SMCs in the uptake of MGd. The results of the in vitro experiments showed that the MGd-created red fluorescent signal intensity increased as the MGd concentration increased, and an MGd concentration at 150 µmol/L enabled us to achieve the highest fluorescent signal intensity and the lowest T1 value. The ex vivo experiments showed that MR imaging with the combined use of the MR imaging guidewire and surface coils generated higher SNRs at the artery walls than did MR imaging with only the guidewire or only the surface coil; this finding was confirmed with histologic correlation. The combination of the coils not only increased the SNR of coronary artery walls, but also overcame the insufficiency of background SNR of the MR imaging guidewire (15). The results of an in vivo study further validated the feasibility of using clinical 3.0-T MR imaging to delineate the local intracoronary distribution of the MGd and trypan blue mixture into the coronary artery wall, demonstrating significant enhancement of the target arterial walls after delivery of the contrast agent.
Relatively recent studies have shown that intravascular MR imaging can generate high SNR images of deep-seated iliac arteries with either a 1.5- or 3.0-T MR imager, which may become a useful imaging tool with which to accurately delineate the extent of therapeutic agent distribution within the vessel walls (16,17). In these previous studies, a 0.032-inch MR imaging guidewire was used to image medium and large vessels, such as iliofemoral arteries, and this MR imaging guidewire size was compatible with most endovascular interventional devices. However, the 0.032-inch MR imaging guidewire is too large for endovascular imaging of small vessels, such as the coronary arteries. To solve this problem, a 0.014-inch MR imaging guidewire was manufactured and successfully validated by using it to generate 3.0-T MR images of the coronary artery walls (15). In the present study, we successfully combined the MR imaging intravascular guidewire and surface coils to achieve a higher SNR.
Superparamagnetic iron oxide nanoparticles, otherwise known as T2 contrast agents, have been widely used in molecular imaging research and clinical practice (18,19). T2 contrast agents create signal voids to demonstrate their existence in the target tissues or lesions on T2-weighted MR images. However, such signal voids can easily obscure or conceal the targets, especially small targets, such as atherosclerotic lesions. Thus, in the present study, we specifically acquired T1-weighted MR images with a multifunctional T1 contrast agent, MGd, to display both the MGd-enhanced lesions and the anatomic background at the targets. MGd is an intracellular contrast agent with multiple unique functions as (a) a T1 contrast agent for MR imaging; (b) a therapeutic agent that primarily accumulates in metabolically active tissues, such as those affected by atherosclerosis; and (c) a biotissue reporter emitting red-colored fluorescence for histologic analysis and laboratory correlation and confirmation (12,13). Thus, combined use of MGd and intracoronary MR imaging should further benefit the management of atherosclerotic cardiovascular disease.
There were limitations in the present study. Since this study mainly focused on proof-of-concept of using MR imaging to delineate the distribution of intracoronary local contrast agent delivery, we did not evaluate the antiinflammatory effect of MGd on the vascular cells with serial longitudinal in vitro and in vivo studies. In addition, the distribution characteristics of MGd should differ between healthy arteries and diseased arteries with atherosclerotic plaques because of the various components and densities of the normal and atherosclerotic vessel walls.
In conclusion, this study showed the possibility of using 3.0-T MR imaging to delineate the distribution of locally infused contrast agents within the coronary artery walls and established the groundwork to explore molecular MR-guided intracoronary local gene or drug therapy.
Advances in Knowledge.
• Vascular smooth muscle cells are capable of taking up motexafin gadolinium, which is an intracellular multifunctional agent that functions as a T1-weighted MR contrast agent, an antiatherosclerosis agent, and a fluorescent marker.
• It is feasible to deliver motexafin gadolinium (MGd) locally into coronary artery walls.
• The extent of MGd distribution within the coronary artery walls in pigs can be delineated with 3.0-T MR imaging.
Implication for Patient Care.
• This technique may open potential avenues to effectively manage atherosclerotic cardiovascular disease with MR imaging–integrated intracoronary therapy.
Disclosures of Conflicts of Interest: Y.M. No relevant conflicts of interest to disclose. J.W. Financial activities related to the present article: none to disclose. Financial activities not related to the present article: is a Philips Electronics employee. Other relationships: none to disclose. J.S. No relevant conflicts of interest to disclose. F.Z. No relevant conflicts of interest to disclose. P.W. No relevant conflicts of interest to disclose. J.L. No relevant conflicts of interest to disclose. H.W. No relevant conflicts of interest to disclose. T.Z. No relevant conflicts of interest to disclose. S.S. No relevant conflicts of interest to disclose. B.Q. No relevant conflicts of interest to disclose. X.Y. No relevant conflicts of interest to disclose.
Supplementary Material
Acknowledgments
We thank Pharmacyclics for providing motexafin gadolinium. We also thank Ying Zheng, PhD, for kindly providing arterial smooth muscle cells.
Received August 10, 2012; revision requested October 1; revision received December 6; accepted December 28; final version accepted January 10.
From the 2012 RSNA Annual Meeting.
Funding: This research was supported by the National Institutes of Health (grant RO1 HL066187).
Abbreviations:
- CNR
- contrast-to-noise ratio
- MGd
- motexafin gadolinium
- SMC
- smooth muscle cell
- SNR
- signal-to-noise ratio
References
- 1.Lloyd-Jones D, Adams RJ, Brown TM, et al. Heart disease and stroke statistics: 2010 update—a report from the American Heart Association. Circulation 2010;121(7):e46–e215 [DOI] [PubMed] [Google Scholar]
- 2.Joseph P, Teo K. Optimal medical therapy, lifestyle intervention, and secondary prevention strategies for cardiovascular event reduction in ischemic heart disease. Curr Cardiol Rep 2011;13(4):287–295 [DOI] [PubMed] [Google Scholar]
- 3.Park SJ, Park DW. Treatment of patients with left main coronary artery disease. Curr Treat Options Cardiovasc Med 2012;14(1):108–116 [DOI] [PubMed] [Google Scholar]
- 4.Maragiannis D, Lazaros G, Vavuranakis M, et al. Chronic stable angina: percutaneous coronary intervention or medication? Hellenic J Cardiol 2011;52(3):246–252 [PubMed] [Google Scholar]
- 5.Lancey RA. How valid is the quantity and quality relationship in CABG surgery? a review of the literature. J Card Surg 2010;25(6):713–718 [DOI] [PubMed] [Google Scholar]
- 6.Stettler C, Wandel S, Allemann S, et al. Outcomes associated with drug-eluting and bare-metal stents: a collaborative network meta-analysis. Lancet 2007;370(9591):937–948 [DOI] [PubMed] [Google Scholar]
- 7.Faxon DP. Very late stent thrombosis and late target lesion revascularization: no end in sight. Circulation 2012;125(4):562–564 [DOI] [PubMed] [Google Scholar]
- 8.Kimura T, Morimoto T, Nakagawa Y, et al. Very late stent thrombosis and late target lesion revascularization after sirolimus-eluting stent implantation: five-year outcome of the j-Cypher Registry. Circulation 2012;125(4):584–591 [DOI] [PubMed] [Google Scholar]
- 9.Krombach GA, Wehner M, Perez-Bouza A, et al. Magnetic resonance-guided angioplasty with delivery of contrast-media doped solutions to the vessel wall: an experimental study in swine. Invest Radiol 2008;43(7):530–537 [DOI] [PubMed] [Google Scholar]
- 10.Kurpad KN, Unal O. Multimode intravascular RF coil for MRI-guided interventions. J Magn Reson Imaging 2011;33(4):995–1002 [DOI] [PMC free article] [PubMed] [Google Scholar]
- 11.Qiu B, Karmarkar P, Brushett C, et al. Development of a 0.014-inch magnetic resonance imaging guidewire. Magn Reson Med 2005;53(4):986–990 [DOI] [PubMed] [Google Scholar]
- 12.Mody TD, Fu L, Sessler JL. Texaphyrins: synthesis and development of a novel class of therapeutic agents. Prog Inorg Chem 2001;49:551–598 [Google Scholar]
- 13.Woodburn KW, Fan Q, Kessel D, et al. Phototherapy of cancer and atheromatous plaque with texaphyrins. J Clin Laser Med Surg 1996;14(5):343–348 [DOI] [PubMed] [Google Scholar]
- 14.Wang J, Gerretsen SC, Maki JH, et al. Time-efficient black blood RCA wall imaging at 3T using improved motion sensitized driven equilibrium (iMSDE): feasibility and reproducibility. PLoS One 2011;6(10):e26567. [DOI] [PMC free article] [PubMed] [Google Scholar]
- 15.Gu H, Zhang F, Meng Y, Qiu B, Yang X. Development of a 0.014-in., anti-solenoid loop MR imaging guidewire for intravascular 3.0-T MR imaging. Magn Reson Imaging 2011;29(7):1002–1006 [DOI] [PubMed] [Google Scholar]
- 16.Larose E, Kinlay S, Selwyn AP, et al. Improved characterization of atherosclerotic plaques by gadolinium contrast during intravascular magnetic resonance imaging of human arteries. Atherosclerosis 2008;196(2):919–925 [DOI] [PubMed] [Google Scholar]
- 17.Qian D, Bottomley PA. High-resolution intravascular magnetic resonance quantification of atherosclerotic plaque at 3T. J Cardiovasc Magn Reson 2012;14:20. [DOI] [PMC free article] [PubMed] [Google Scholar]
- 18.Meng Y, Zhang F, Blair T, et al. MRI of auto-transplantation of bone marrow-derived stem-progenitor cells for potential repair of injured arteries. PLoS One 2012;7(2):e31137. [DOI] [PMC free article] [PubMed] [Google Scholar]
- 19.Wagner M, Wagner S, Schnorr J, et al. Coronary MR angiography using citrate-coated very small superparamagnetic iron oxide particles as blood-pool contrast agent: initial experience in humans. J Magn Reson Imaging 2011;34(4):816–823 [DOI] [PubMed] [Google Scholar]
Associated Data
This section collects any data citations, data availability statements, or supplementary materials included in this article.


