Abstract
Sprouty (Spry) genes encode negative regulators of receptor tyrosine kinase (RTK) signaling, which plays important roles in human embryonic stem cells (hESCs). SPRY2 and SPRY4 are the two most highly expressed Sprouty family members in hESCs, suggesting that they may influence self-renewal. To test this hypothesis, we performed siRNA-mediated knock down (KD) studies. SPRY2 KD resulted in increased cell death and decreased proliferation, whereas SPRY4 KD enhanced survival. In both cases, after KD the cells were able to differentiate into cells of the three germ layers, although after SPRY2 KD there was a tendency toward increased ectodermal differentiation. SPRY2 KD cells displayed impaired mitochondrial fusion and cell membrane damage, explaining in part the increased cell death. These data indicate that Sprouty genes regulate pathways involved in proliferation and cell death in hESCs.
Receptor tyrosine kinases (RTKs) transmit signals in response to growth factor stimulation. They control a variety of downstream pathways, including Ras/MAPK, PLCγ, PKC, PI3K, JAK/STAT, and others1,2. Multiple cellular processes are regulated by RTKs, including proliferation, survival, protein synthesis, and others. There are many feedback loops within RTK pathways, as well as cross talk between different pathways, making the net signaling outcome an integrated result of all these components. RTK pathways are regulated by a series of endogenous antagonists that fine-tune the signaling, including the Sprouty and Spred family members2,3.
RTK signaling critically regulates human embryonic stem cells (hESCs)2. Many growth factors have been found to play a role in hESCs, in particular FGF2, IGF1, and EGF. FGF2 signaling is crucial for maintaining hESCs in an undifferentiated state and enabling self-renewal4,5,6,7. EGF plays a role in proliferation and survival8, and IGF contributes to self-renewal and pluripotency7,9. These growth factors also play important and diverse roles in regulation of differentiation by hESCs10.
Sprouty genes were first discovered in Drosophila as regulators of tracheal11 and eye12 development. Later, four family members were discovered in mammals, SPRY1–4. Sprouty genes encode relatively small proteins, ~63 Kda in the fly and 32–34 KDa in mammals13. Although the mechanism by which they function biochemically is still the subject of investigation, it is clear that the proteins can antagonize RTK signaling and that they have diverse cellular functions, including anti-proliferative activity, inhibition of migration, favoring of differentiation, and promotion of survival13,14.
The role of Sprouty genes in ESCs is largely unknown. One study has addressed the role of SPRY1 in mouse ESC differentiation15. These authors showed that SPRY1 was dispensable for the maintenance of self-renewal, but that suppressing its expression promoted neural differentiation and inhibited epithelial differentiation. However, the role of Sprouty genes in hESCs remains a mystery. Here, we set out to examine the role of Sprouty genes in hESCs. We found that SPRY2 and SPRY4 are the most highly expressed family members in hESCs, and their expression decreases with differentiation. In contrast, SPRY1 and SPRY3 are minimally expressed in hESCs, and their expression increases during differentiation. These initial data suggested that SPRY2 and SPRY4 are involved in self-renewal, whereas SPRY1 and SPRY3 are more likely to be involved in differentiation, and we focused our study on SPRY2 and SPRY4.
Results
SPRY2 and SPRY4 are the most highly expressed Sprouty genes in hESCs
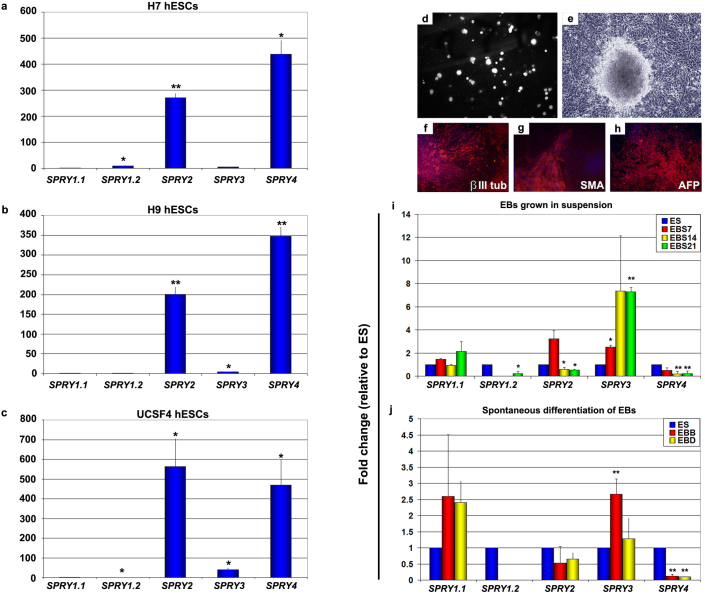
We first analyzed the expression of Sprouty genes by qPCR in three hESC lines: H7, H9 and UCSF416,17 (Fig. 1a–c). SPRY1 has two transcript variants, SPRY1.1 and SPRY1.2, which can be assayed with separate primer sets. We found that SPRY2 and SPRY4 were the most highly expressed family members in all three lines, with very low expression of SPRY3 and almost undetectable levels of SPRY1. SPRY2 expression was 200–550 fold higher than SPRY1.1 and SPRY4 was 350–450 fold higher than SPRY1.1, while SPRY3 levels were approximately 40 times higher than SPRY1.1 (Fig. 1a–c). The levels of expression of Sprouty genes were very similar between the various hESC lines, and the UCSF4 line was used for subsequent experiments because, in our hands, it proved the most robust in culture and showed a lower tendency to spontaneously differentiate than the other two lines (Suppl Fig. 1).
Figure 1. Expression of Sprouty genes in human embryonic stem cells (hESCs) and during spontaneous differentiation.
(a–c) Expression of Sprouty genes in hESCs analyzed by qPCR in three different cell lines: H7 (a), H9 (b), UCSF4 (c). Levels are relative to SPRY1.1 mRNA. (d) UCSF4 hESCs were grown in suspension for formation of embryoid bodies (EBs) for 7 days. (e) After 7 days in suspension, EBs were allowed to attach to a culture plate, and differentiated cells started to grow out of the EB. (f–h) Two weeks after adherence, cells were stained for markers of the three germ layers: βIII tubulin (ectoderm, f), smooth muscle actin (SMA, mesoderm, g), alpha-fetoprotein (AFP, endoderm, h). (i) Sprouty gene expression was analyzed by qPCR in EBs grown in suspension for 7 days (EBS7; 6 assays of 1200 EBs total), 14 days (EBS14; 6 assays of 1200 EBs total), and 21 days (EBS21; 6 assays of 1200 EBs total ). RNA levels are relative to mRNA levels in hESCs. (j) Sprouty gene expression levels in EBs that were allowed to adhere and differentiate. EBD, differentiated cells that emerged from the EB. EBB, remaining cells from EB (6 assays for a total of 450 EBD/EBB total). T-test, (a–c), value vs SPRY1.1, and (i–j) value vs ES: *, p<0.05; ** p<0.005; Magnification: d, x15; e, x50; f–g, x100.
Sprouty levels change dynamically during differentiation
Because Sprouty genes are expressed in hESCs, we next asked if they are dynamically regulated during processes involving RTK signaling, such as differentiation. USCF4 hESCs were spontaneously differentiated through embryoid body (EB) formation. The levels of Sprouty gene expression were measured in EB suspension (Fig. 1d), after attachment (Fig. 1e), and after differentiation into the three germ layers as assessed by expression of markers specific for ectoderm (Fig. 1f), mesoderm (Fig. 1g) and endoderm (Fig. 1h). We found that SPRY4 levels decreased during differentiation, both in EB suspension (Fig. 1i) and after attachment (Fig. 1j), and SPRY3 levels increased both in suspension (Fig. 1i) and to a lesser extent after attachment (Fig. 1j). SPRY2 expression increased only after 1 week in suspension and decreased thereafter in suspension and after attachment (Fig. 1i, j). SPRY1 expression showed little variability (Fig. 1i, j). Thus, SPRY2 and SPRY4 were the most highly expressed Sprouty genes in hESCs, and their levels decreased during differentiation, suggesting they are involved in self-renewal.
siRNA knock-down caused a 75% decrease in levels of SPRY2 and SPRY4
We took advantage of the widely-used lipofectamine-mediated transfection of siRNA for knock-down (KD) in hESCs (Fig. 2, Suppl Fig. 2). We followed an optimized protocol18 with slight modifications, and we obtained 100% transfection efficiency as verified by fluorescence microscopy and flow cytometry (data not shown). Using a modified transfection method, we reproducibly obtained an average of 73.5% KD of SPRY2 (61–81%) and 74.8% KD of SPRY4 (67–89%) (Fig. 2).
Figure 2. Knock-down levels.
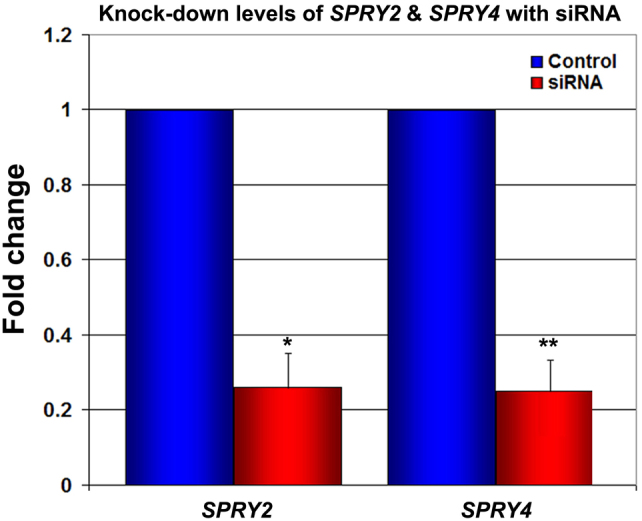
The level of knock-down was assessed 48 h after transfection by qPCR (6 assays). T-test, siRNA vs control: *, p<0.0005; **, p<10−6.
Cell survival, proliferation and morphology are affected after Sprouty knock-down
Since Sprouty proteins can antagonize RTK signaling, we next tested for changes in cell survival and proliferation. First, we assessed cell number after transfection. Cell count at various time points starting 48 h after transfection showed decreased cell number in SPRY2 KD relative to control, whereas SPRY4 KD resulted in a trend (although not statistically significant) toward an increase in cell number relative to controls (Fig. 3a). These data suggested that Sprouty genes regulated survival and/or cell division. We therefore examined the percentage of live and dead cells by flow cytometry and found that, starting 48 h after KD, there was a clear difference in the percentage of live cells between SPRY4 KD and SPRY2 KD, with more live cells in SPRY4 KD (Fig. 3b). We then examined proliferation by BrdU labeling and flow cytometry cell cycle analysis. SPRY2 KD showed 20% less BrdU-positive cells than control after 1 h labeling. Cell cycle analysis showed ~20% fewer cells in the S-phase and 15% more cells in G2/M phase in SPRY2 KD, indicative of a G2/M block (Fig. 3c). SPRY4 KD cells were not significantly different from controls.
Figure 3. Survival and proliferation after knock-down.
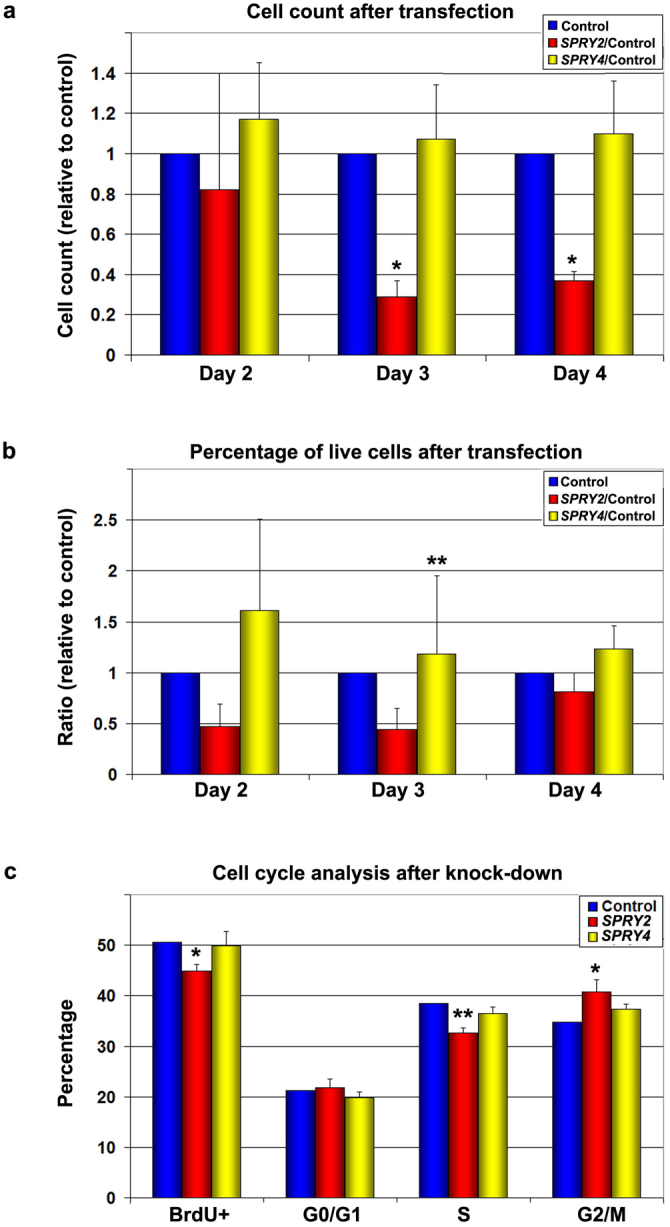
(a,b) At 3 time points after transfection (day 2, day 3, day 4; 6 assays), cells were counted (a) and the percentage of live cells evaluated by flow cytometry (b). (c) Cell proliferation (6 assays) was measured 3 days after transfection by BrdU labeling and analyzed by cell cycle flow cytometry. T-test, sample vs control: *, p<0.05; **, p<0.008.
Since some of the pathways controlled by RTK signaling are involved in cytoskeletal arrangements1, we examined the morphology of the cells after KD. The cells looked comparable in phase contrast (Suppl Fig. 3) and showed no cytoskeletal abnormalities (Suppl Fig. 3). Transmission electron microscopy (TEM) showed cells with abnormal membranes and smaller mitochondria after SPRY2 KD (Suppl Fig. 3), which could represent damaged or dying cells.
hESCs continue to form EBs and spontaneously differentiate after SPRY2 and SPRY4 knock-down
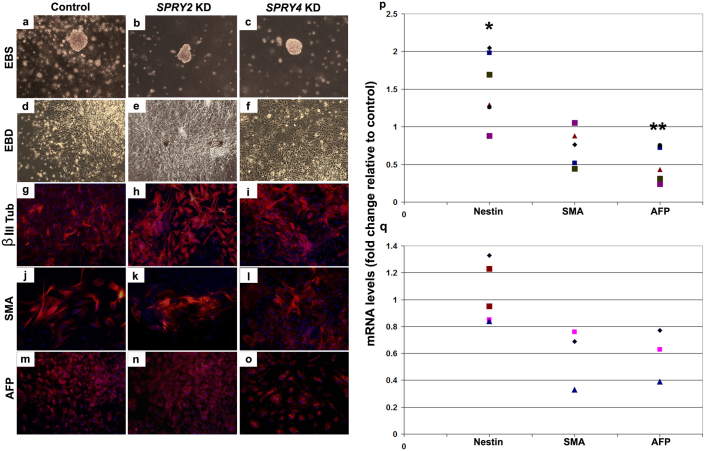
Since Sprouty genes can regulate multiple pathways, we asked whether SPRY2 and SPRY4 have any effect on differentiation by analyzing the ability of hESCs to form EBs and spontaneously differentiate after KD. EB formation was observed with both SPRY2 KD cells (Fig. 4b, e) and SPRY4 KD cells (Fig. 4c, f), similarly to controls (Fig. 4a, d). The ability of these cells to differentiate into the three germ layers was then tested. βIII tubulin, SMA and alpha-fetoprotein, which mark derivatives of ectoderm, mesoderm, and endoderm, were expressed in SPRY2 KD cells (Fig. 4h, k, n) and SPRY4 KD cells (Fig. 4i, l, o) similarly to controls (Fig. 4g, j, m), indicating no major impairment of differentiation potential. We next quantified the mRNA expression levels of the ectoderm, mesoderm and endoderm markers. After SPRY2 KD, there was a trend towards enhanced ectodermal differentiation and reduced endodermal differentiation (Fig. 4p), whereas after SPRY4 KD, differentiation was similar to controls (Fig. 4q).
Figure 4. Spontaneous differentiation after SPRY2 and SPRY4 KD.
Following knock-down (KD), both SPRY2 and SPRY4 KD cells were able to form EBs (a–c) and differentiate (d–f). Immunocytochemistry staining revealed that both SPRY2 and SPRY4 KD cells are able to differentiate into the three germ layers, through the expression of the following markers: βIII tubulin (g, h, i), smooth muscle actin (SMA, j, k, l) and alpha fetoprotein (m, n, o); qPCR quantification of differentiation markers (n = 7) Nestin (ectoderm), SMA (mesoderm) and AFP (endoderm) showed a trend toward increased differentiation into ectoderm and decreased differentiation into endoderm after SPRY2 knock-down (p), while after SPRY4 knock-down there was no clear change (q). Data are represented as fold change (increase or decrease) relative to levels in control hESCs. 6 assays were conducted for each experiment. Student T-test, mRNA level after knock-down vs. ESCs: *, p<0.02; **, p<0.002.
SPRY2 and SPRY4 KD cells show a differential response to growth factors
Decreased levels of Sprouty gene expression would be expected to cause increased RTK signaling and to change the sensitivity of cells to growth factors. We therefore analyzed the response of hESCs to growth factor stimulation after SPRY2 and SPRY4 KD and found that FGF2 and EGF induced an increase in cell number that was statistically significant (p ≤ 0.04 and p<0.02, respectively) in SPRY2 KD cells, whereas IGF1 caused little change in cell numbers (Fig. 5). Although SPRY4 KD cells had a similar pattern, this was not statistically significant.
Figure 5. Differential response to growth factors after knock-down.
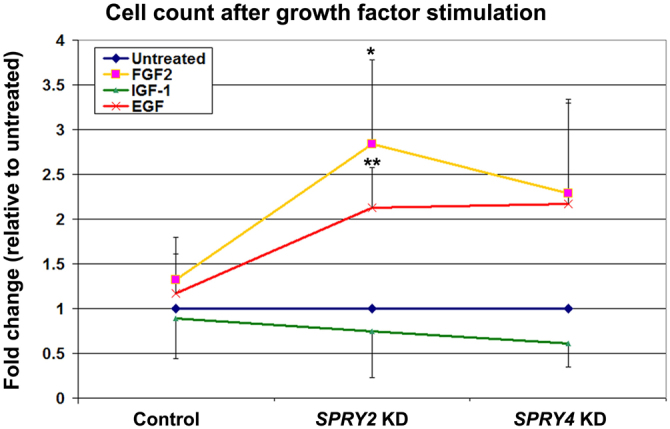
48 h following knock-down, cells were incubated with 300 ng/ml of FGF2, IGF1, or EGF for 2 days, harvested and counted. 6 assays were conducted for each experiment. Student T-test, SPRY2 KD vs control: *, FGF2 stimulation, p ≤ 0.04; **, EGF stimulation, p<0.02.
Discussion
RTK signaling is central to hESC biology4,5,6,19. Since Sprouty gene products antagonize RTK signaling, in particular the Ras/MAPK pathway, we hypothesized that these genes may regulate hESCs. Here, we studied the role of Sprouty genes in hESCs using siRNA KD. We focused on SPRY2 and SPRY4, which are highly expressed in hESCs and show decreased expression during differentiation.
SPRY2 KD resulted in decreased proliferation and decreased survival, with a reduction of cell number compared to controls. However, stimulation by FGF2 and EGF caused an increased number of cells in SPRY2 KD relative to unstimulated KD cultures, indicating that the cells were indeed hypersensitive to growth factors. One possible explanation for the surprising decrease in proliferation and survival of the unstimulated SPRY2 KD cells could involve PKC, which is known to inhibit EGF receptor (EGFR) signaling. Sprouty genes inhibit PLCγ1, which is an activator of PKC; thus, silencing of SPRY2 could allow PKC to exert a more intense inhibition of EGFR or another RTK, leading to a decrease in the survival and proliferation signals. Another possibility relates to the observations that SPRY2 potentiates the effect of EGFR by sequestration of cCBL and protects EGFR from degradation, such that decreased levels of SPRY2 can result in decreased EGF signaling20,21,22,23,24,25. Future biochemical studies will be required to untangle the intricacies of these pathways in hESCs.
Interestingly, the percentage of live cells in SPRY2 KD was the lowest at 48 h and then progressively became closer to the control. This was also apparent when individual samples were plotted at each time point (Suppl Fig. 4). In contrast, SPRY4 KD led to a higher percentage of live cells at all time points. It seems likely that at 48 h there was a higher proportion of cells with very low levels of SPRY2, and that these died early. Then, with time, most cells with the lowest levels of SPRY2 died, resulting in an increase in the percentage of live cells. In SPRY4 KD, we observed a trend toward enhanced survival, but this phenotype was subtle, suggesting that other negative regulators might serve compensatory functions.
Interestingly, differentiation of hESCs did not appear to be inhibited or delayed after silencing of SPRY2 or SPRY4, as hESCs were able to form EBs and spontaneously differentiate into the three germ layers at a normal rate. However, quantitative analysis of mRNA levels of germ layer markers in SPRY2 KD revealed enhanced ectodermal and reduced endodermal formation. This finding points to the complexity of signaling in hESCs, since genes regulating self-renewal seem to fine tune differentiation as well. Our data therefore suggest that while SPYR2 and SPRY4 do not play a major role in differentiation of hESCs, they do affect pathways that are involved in fine tuning differentiation.
This study has shown that low levels of SPRY2 result in decreased survival and proliferation of hESCs, but when stimulated, the SPRY2 KD cells remain sensitive to growth factors and respond to increasing concentration of FGF2 and EGF by increased cell number. Decreased levels of SPRY4 resulted in enhanced survival, with no other cellular changes, suggesting that other negative regulators of RTK signaling could have overlapping functions with SPRY4. Thus, this study has identified a role for SPRY2 and SPRY4 in hESC self-renewal. Because RTK signaling is complex, and its regulation intricate, detailed future studies will be needed to dissect the interactions of Sprouty gene products with other molecules in hESCs.
Methods
Human embryonic stem cells (hESCs)
UCSF4 hESCs were used for this study17. Cells were maintained in feeder-free conditions (Suppl Fig. 1a, b) using Cell Start matrix (Invitrogen), mTeSR medium (Stem Cell Technologies), and passaged every 5 days. Colonies were regularly stained for markers typically used for hESCs (Nanog, Sox2, Oct4, Tra1-60, Tra-1-81, SSEA4) (Suppl Fig. 1, c–h).
Embryoid body (EB) formation
For EB formation, clumps of hESC were grown in suspension in EB medium (knock out DMEM, 20% FBS, non essential amino acids, L-glutamine 2 mM, 0.1 mM β-mercapto ethanol) for 7 days during which EB spheroids formed. For spontaneous differentiation experiments, EBs were transferred to culture-treated plates coated with Cell Start. EBs adhered and were allowed to differentiate for 2 weeks, and samples were used for qPCR at 1 and 2 weeks post attachment. Immunocytochemistry was performed at 2 weeks for germ layer markers: beta III tubulin (ectoderm), smooth muscle actin (mesoderm), and alpha fetoprotein (endoderm). Some EBs were maintained in suspension for the duration of the experiment, and samples were used for qPCR after 1, 2, and 3 weeks in suspension.
Immunocytochemistry (ICC)
Briefly, cells were fixed in the plates with 4% paraformaldehyde for 15 min at room temperature (RT), then permeabilized with 0.2% Triton X-100 for 15 min at RT. Samples were blocked with 5% BSA for 1 h at RT, primary antibodies were added and incubated overnight at +4, washed with 0.1% Triton X-100 3 times, secondary antibodies were added and incubated overnight at +4, then washed again with 0.1% Triton X100 and DAPI was added. Cells were observed under an inverted fluorescent microscope (Leica), and pictures were taken with a Leica DFC 500 camera. Primary antibodies were used at 1/100 as follows: goat anti-human Nanog, goat anti-human Sox2, mouse anti-beta II tubulin, mouse anti-alpha feto protein (all from R&D), rabbit anti-Oct3/4 and mouse anti-smooth muscle actin (both from Santa Cruz) and mouse anti-Tra-1-60, mouse anti-Tra-1-81, and mouse anti stage-specific embryonic antigen 4 (all from Millipore); secondary antibodies were used at 1/500 as follows: donkey anti-goat alexa 568, goat anti-rabbit alexa 555, goat anti-mouse alexa 555.
qPCR
mRNA levels were assessed by qPCR (Eppendorf) using the following cycle: 95° 5 min, 95° 15 sec, 58° 30 sec, 72° 15 sec, with 40 cycles. The primers were as follows (L, left, R, right): actin: L: 5′- GAT GAG ATT GGC ATG GCT TT-3′ ; R: 5′-CAC CTT CAC CGT TCC AGT TT-3′; SPRY1.1: l, 5′-GGG ATT GTC CGA AAA GGA TT-3′; R, 5′-TTG ATT TTG GGG ATC CAT GT-3′; SPRY1.2: L, 5′-CGC TGT TAA ATG TGC CTG AA-3′; R, 5′- TTG ATT TTG GGG ATC CAT GT-3′; SPRY2: L, 5′-TTG CAC ATC GCA GAA AGA AG-3′; R, 5′-GGT CAC TCC AGC AGG CTT AG-3′; SPRY3: L, 5′-CCT TGC TGG AAT AGG GAT CA-3′; R, 5′ TAA GGC CAT GTT GTG GTT GA-3′; SPRY4: L, 5′-GGG AGC CAC TGA GAA CAG AG-3′; R, 5′-TGG CTC CTA AAT CCA TCC TG-3′; Nestin: L, 5′-TCC AGG AAC GGA AAA TCA AG-3′; R, 5′-GCC TCC TCA TCC CCT ACT TC-3′; SMA: L, 5′-CAG GGA AAA GAT GAC CCA GA-3′; R, 5′-AGG CAT AGA GGG AGA GCA CA-3′; AFP: L, 5′-CTT GTG AAG CAA AAG CCA CA-3′; R, CCC TCT TCA GGA AAG CAG AC-3′
Knock-down experiments
siRNA transfection reagents were obtained from Invitrogen, and the transfection protocol was adopted from Ma et al with slight modification18 and no toxicity (Suppl Fig. 2). Briefly, colonies were dissociated into single cells, centrifuged at 800 rpm 4 min RT, and resuspended in mTeSR without antibiotics. 105 cells were added to the transfection mix for 1–2 min, then mTeSR without antibiotics and containing Rock inhibitor (Y-27632) was added to a total of 500 μl each and plated in a 12 well plate previously coated with Cell Start. Lipofectamine 2000 transfection mix was prepared. Three siRNA sets were used for each gene, as follows: SPRY2: SET 1: primer 1, UGG AAG GUA ACA CCA UAA ACA AGG C; primer 2, GCC UUG UUU AUG GUG UUA CCU UCC A; SET 2: primer 1, UUG AGC UCA GAU UUG GGU UGC ACC C, primer 2, GGG UGC AAC CCA AAU CUG AGC UCA A; SET 3, primer 1: AGA CCG UGG AGU CUC UCG UGU UUG U, primer 2, ACA AAC ACG AGA GAC UCC ACG GUC U. SPRY4: set 1, primer 1: CCC UAG AAG CCU GUU UCU CCG UAC A; primer 2, UGU ACG GAG AAA CAG GCU UCU AGG G; Set 2, primer 1, GAG GCC UGU GGG AAG UGU AAA UGC A; primer 2, UGC AUU UAC ACU UCC CAC AGG CCU C; Set 3, primer 1: CAG CCA UGU GGA GAA UGA CUA CAU A, primer 2: UAU GUA GUC AUU CUC CAC AUG GCU G.
Cell count
Cells were seeded at the same number and counted every 24 h for 4 days after transfection.
Cell death
Cell death was evaluated by flow cytometry with Annexin V/PI (Annexin V Fluor staining kit, Roche). Briefly, cells were incubated with Annexin V/PI mix for 15 min at RT in incubation buffer, then collected with Accutase and resuspended in incubation buffer and processed for flow cytometry (LSR from BD).
Proliferation
Proliferation was assessed by BrdU labeling coupled to cell cycle analysis by flow cytometry using the EZ BrdU Kit (Phoenix Flow Systems).
Cell morphology
Cell morphology was observed by phase contrast using inverted light microscope from Leica, and pictures were taken with a Leica DFC 500 camera.
Actin staining
Cells were fixed with 3.7% formaldehyde for 10 min at RT, permeabilized with 0.1% Triton X-100 for 4 min, and blocked with 1% BSA for 20 min. Alexa 488 Phalloidin (Molecular Probes) was then added and cells incubated for 20 min RT in the dark, then washed and DAPI added. Cells were imaged as described above.
Transmission electron microscopy imaging (TEM)
Cells were grown on Thermanox cover slips (Ted Pella Inc.), fixed for 2 h at RT with 2.0% electron microscopy grade glutaraldehyde in 0.1 M sodium cacodylate buffer, rinsed and dehydrated. Cells were then embedded in resin (1 part epoxy resin to 2 parts 100% propylene oxide) for 2 h at RT, then in 2 parts epoxy resin to 1 part propylene oxide for another 2 h, and finally in pure resin overnight. Samples were then baked for 12–14 hours at 60°C and separated from the coverslips, then baked again for another 24 h, glued to blocks and processed for sectioning at 100 μm.
Growth factor stimulation
siRNA-treated and control cells were exposed to FGF2, IGF1 and EGF (300 ng/ml each) starting 48 h after siRNA treatment for a period of 48 h, then harvested and counted.
Author Contributions
H.F. performed experiments and H.F. and O.D.K. wrote the manuscript text.
Supplementary Material
Supp Data
Acknowledgments
We are grateful to Michael Kissner for assistance with flow cytometry, Larry Ackerman for TEM imaging, Nicolas Larocque and Susan Fisher for hESC training and assistance, Stephan Gysin for assistance with data analysis and experimental planning, and Emin Maltepe for assistance in data analysis. This study was funded by a CIRM New Faculty Award RN2-00933-1 to O. Klein.
References
- Lemmon M. A. & Schlessinger J. Cell signaling by receptor tyrosine kinases. Cell 141, 1117–1134 (2010). [DOI] [PMC free article] [PubMed] [Google Scholar]
- Anneren C. Tyrosine kinase signalling in embryonic stem cells. Clin Sci (Lond) 115, 43–55 (2008). [DOI] [PubMed] [Google Scholar]
- Bundschu K., Walter U. & Schuh K. Getting a first clue about SPRED functions. Bioessays 29, 897–907 (2007). [DOI] [PubMed] [Google Scholar]
- Diecke S., Quiroga-Negreira A., Redmer T. & Besser D. FGF2 signaling in mouse embryonic fibroblasts is crucial for self-renewal of embryonic stem cells. Cells Tissues Organs 188, 52–61 (2008). [DOI] [PubMed] [Google Scholar]
- Eiselleova L. et al. A complex role for FGF-2 in self-renewal, survival, and adhesion of human embryonic stem cells. Stem Cells 27, 1847–1857 (2009). [DOI] [PMC free article] [PubMed] [Google Scholar]
- Levenstein M. E. et al. Basic fibroblast growth factor support of human embryonic stem cell self-renewal. Stem Cells 24, 568–574 (2006). [DOI] [PMC free article] [PubMed] [Google Scholar]
- Bendall S. C. et al. IGF and FGF cooperatively establish the regulatory stem cell niche of pluripotent human cells in vitro. Nature 448, 1015–1021 (2007). [DOI] [PubMed] [Google Scholar]
- Wang L. et al. Self-renewal of human embryonic stem cells requires insulin-like growth factor-1 receptor and ERBB2 receptor signaling. Blood 110, 4111–4119 (2007). [DOI] [PMC free article] [PubMed] [Google Scholar]
- Manton K. J. et al. A chimeric vitronectin: IGF-I protein supports feeder-cell-free and serum-free culture of human embryonic stem cells. Stem Cells Dev 19, 1297–1305 (2010). [DOI] [PubMed] [Google Scholar]
- Schuldiner M., Yanuka O., Itskovitz-Eldor J., Melton D. A. & Benvenisty N. Effects of eight growth factors on the differentiation of cells derived from human embryonic stem cells. Proc Natl Acad Sci U S A 97, 11307–11312 (2000). [DOI] [PMC free article] [PubMed] [Google Scholar]
- Hacohen N., Kramer S., Sutherland D., Hiromi Y. & Krasnow M. A. sprouty encodes a novel antagonist of FGF signaling that patterns apical branching of the Drosophila airways. Cell 92, 253–263 (1998). [DOI] [PubMed] [Google Scholar]
- Casci T., Vinos J. & Freeman M. Sprouty, an intracellular inhibitor of Ras signaling. Cell 96, 655–665 (1999). [DOI] [PubMed] [Google Scholar]
- Kim H. J. & Bar-Sagi D. Modulation of signalling by Sprouty: a developing story. Nat Rev Mol Cell Biol 5, 441–450 (2004). [DOI] [PubMed] [Google Scholar]
- Mason J. M., Morrison D. J., Basson M. A. & Licht J. D. Sprouty proteins: multifaceted negative-feedback regulators of receptor tyrosine kinase signaling. Trends Cell Biol 16, 45–54 (2006). [DOI] [PubMed] [Google Scholar]
- Jung J. E. et al. Sprouty1 regulates neural and endothelial differentiation of mouse embryonic stem cells. Stem Cells Dev 21, 554–561 (2012). [DOI] [PubMed] [Google Scholar]
- Thomson J. A. et al. Embryonic stem cell lines derived from human blastocysts. Science 282, 1145–1147 (1998). [DOI] [PubMed] [Google Scholar]
- Krtolica A. et al. GROalpha regulates human embryonic stem cell self-renewal or adoption of a neuronal fate. Differentiation 81, 222–232 (2011). [DOI] [PMC free article] [PubMed] [Google Scholar]
- Ma Y. et al. High-efficiency siRNA-based gene knockdown in human embryonic stem cells. RNA 16, 2564–2569 (2010). [DOI] [PMC free article] [PubMed] [Google Scholar]
- Pera M. F. & Tam P. P. Extrinsic regulation of pluripotent stem cells. Nature 465, 713–720 (2010). [DOI] [PubMed] [Google Scholar]
- Egan J. E., Hall A. B., Yatsula B. A. & Bar-Sagi D. The bimodal regulation of epidermal growth factor signaling by human Sprouty proteins. Proc Natl Acad Sci U S A 99, 6041–6046 (2002). [DOI] [PMC free article] [PubMed] [Google Scholar]
- Hall A. B. et al. hSpry2 is targeted to the ubiquitin-dependent proteasome pathway by c-Cbl. Curr Biol 13, 308–314 (2003). [DOI] [PubMed] [Google Scholar]
- Impagnatiello M. A. et al. Mammalian sprouty-1 and -2 are membrane-anchored phosphoprotein inhibitors of growth factor signaling in endothelial cells. J Cell Biol 152, 1087–1098 (2001). [DOI] [PMC free article] [PubMed] [Google Scholar]
- Rubin C. et al. Sprouty fine-tunes EGF signaling through interlinked positive and negative feedback loops. Curr Biol 13, 297–307 (2003). [DOI] [PubMed] [Google Scholar]
- Sasaki A. et al. Mammalian Sprouty4 suppresses Ras-independent ERK activation by binding to Raf1. Nat Cell Biol 5, 427–432 (2003). [DOI] [PubMed] [Google Scholar]
- Wong E. S. et al. Sprouty2 attenuates epidermal growth factor receptor ubiquitylation and endocytosis, and consequently enhances Ras/ERK signalling. EMBO J 21, 4796–4808 (2002). [DOI] [PMC free article] [PubMed] [Google Scholar]
Associated Data
This section collects any data citations, data availability statements, or supplementary materials included in this article.
Supplementary Materials
Supp Data


