

Abstract
Objective:
This study assessed the tissue integrity of major cervical cord tracts by using diffusion tensor imaging (DTI) to determine the relationship with specific clinical functions carried by those tracts.
Methods:
This was a cross-sectional study of 37 patients with multiple sclerosis or neuromyelitis optica with remote cervical cord disease. Finger vibratory thresholds, 25-foot timed walk (25FTW), 9-hole peg test (9HPT), and Expanded Disability Status Scale were determined. DTI covered cervical regions C1 through C6 with 17 5-mm slices (0.9 × 0.9 mm in-plane resolution). Regions of interest included posterior columns (PCs) and lateral corticospinal tracts (CSTs). Hierarchical linear mixed-effect modeling included covariates of disease subtype (multiple sclerosis vs neuromyelitis optica), disease duration, and sex.
Results:
Vibration thresholds were associated with radial diffusivity (RD) and fractional anisotropy (FA) in the PCs (both p < 0.01), but not CSTs (RD, p = 0.29; FA, p = 0.14). RD and FA in PCs, and RD in CSTs were related to 9HPT (each p < 0.0001). 25FTW was associated with RD and FA in PCs (p < 0.0001) and RD in CSTs (p = 0.008). Expanded Disability Status Scale was related to RD and FA in PCs and CSTs (p < 0.0001). Moderate/severe impairments in 9HPT (p = 0.006) and 25FTW (p = 0.017) were more likely to show combined moderate/severe tissue injury within both PCs and CSTs by DTI.
Conclusions:
DTI can serve as an imaging biomarker of spinal cord tissue injury at the tract level. RD and FA demonstrate strong and consistent relationships with clinical outcomes, specific to the clinical modality.
Spinal cord injury often leads to substantial disability in multiple sclerosis (MS) and neuromyelitis optica (NMO).1–4 Weakness and loss of proprioception can impair ambulation and diminish functional independence. Spinal cord involvement is frequent in MS, noted in >80% by MRI and up to 99% at autopsy.1,3 Progressive MS is associated with spinal cord axonal loss due to direct injury within lesions, along with upstream and downstream neurodegeneration.5–7 NMO likewise affects the cord, with pathology characterized by severe axon injury, demyelination, and necrosis.4 Despite the critical contribution of spinal cord disease to clinical disability and disease progression, tools to measure spinal cord injury are limited.8
Diffusion tensor imaging (DTI) is especially valuable to assess CNS white matter because of its sensitivity to the directionality and integrity of anisotropic tissues. Axial diffusivity (AD) represents the principal eigenvalue within a voxel, and radial diffusivity (RD) represents the average of 2 perpendicular eigenvalues. RD has demonstrated strong correlations with clinical and lesion-based outcomes within the brain and optic nerve.9,10 Imaging of the spinal cord has particular advantages for elucidating structure-function relationships because the cord contains discrete tracts carrying clinically relevant and distinct systems.
Herein, we describe the clinical translation of a cervical cord DTI protocol by using region-based, tract-centric analyses in subjects with prior transverse myelitis due to MS or NMO. Posterior columns (PCs) and lateral corticospinal tracts (CSTs) were analyzed by DTI and compared with quantitative measures of vibration threshold, upper extremity function, ambulation, and disability. Our main hypothesis was that DTI, as an imaging biomarker of tissue integrity, could differentiate the level of residual function in patients with remote inflammatory spinal cord disease. We speculated that tissue injury in both lateral and posterior tracts would limit plasticity and compensation, resulting in greater disability compared with severe tissue injury within either CST or PC alone.
METHODS
Standard protocol approvals and patient consents.
This cross-sectional study was approved by the Washington University Human Research Protection Office/Institutional Review Board, and all subjects provided written informed consent.
Subject protocol.
Subjects with MS or NMO spectrum disorder with symptoms, signs, and imaging evidence of cervical spinal cord lesions were recruited from an academic MS center.11,12 Cervical involvement was based on characteristic symptoms (e.g., Lhermitte sign, upper extremity weakness, or upper extremity sensory symptoms) and confirmed by cervical T2-weighted MRI. Patients, aged 18–70 years, were clinically stable and were at least 12 months since their last relapse. Subjects with poor vision, brainstem signs, or cerebellar signs were excluded to prevent confounding of clinical testing (e.g., 9-hole peg test [9HPT]). Clinical brain MRI scans were reviewed to confirm no more than mild cerebral disease burden (<2.5 cm3 T2 lesion burden). Fifteen healthy subjects were also included.
Clinical testing.
The Expanded Disability Status Scale (EDSS) score was determined by a Neurostatus-certified neurologist (A.H.C. or E.C.K.). The 25-foot timed walk (25FTW) and 9HPT were performed per protocol. Vibratory threshold of the upper extremity was measured at each second distal interphalangeal joint by the Computer Aided Sensory Evaluator (CASE IV; WR Medical Electronics Co., Maplewood, MN), an automated device for determining the just noticeable difference by a 125-Hz vibratory threshold using 25 discrete levels of stimulation, ranging from 0 to 350 μm of displacement.13
Image acquisition and registration.
DTI acquisition and processing have been previously detailed.14 Briefly, diffusion-weighted images were collected with a multi–b-value scheme (4 averages of 25 unique directions and b values; bmean = 600 s/mm2) at 3 T (Trio; Siemens, Erlangen, Germany) by using a cardiac-gated, reduced field of view, single-shot spin-echo echoplanar imaging sequence with voxel size of 0.9 × 0.9 × 5 mm. Three separate slice groups (C1-C2, C3-C4, and C5-C6), each consisting of 6 axial slices, were acquired over 45 minutes. After 2-dimensional registration, a model-based outlier rejection procedure reduced physiologic noise.
Regions of interest and image quality control.
Regions of interest (ROIs) for CSTs and PCs were determined by quartering the cord through the central gray matter on the basis of the fractional anisotropy (FA) map and b0 image. White matter tracts were defined in posterior and lateral regions, excluding 1 or 2 layers of voxels at the borders (figure e-1 on the Neurology® Web site at www.neurology.org).15 A “whole” axial slice ROI included the entire cord (white and gray matter). The rostral-most slice within C1 was removed because of confounding CST crossing fibers, and additional ROI inclusion criteria were a signal-to-noise ratio >20 and <2.0 mm of translational motion. The mean signal-to-noise ratio across all cord slices for normal subjects was 24.1 (95% confidence interval, 22.9–25.4). After application of these predefined scan quality criteria on an ROI-by-ROI basis (68 ROIs per subject), 67.1% of the ROIs were retained for analysis, with 3 of the 37 subjects excluded and 1 of the 15 controls excluded because of insufficient quality. Of the 34 subjects and 14 controls retained, a median 77.8% (range, 12.2%–100%) of ROIs were used for modeling.
Statistical analyses.
After proper transformation of DTI indices, a hierarchical linear mixed-effect model analyzed DTI values within each tract, accounting for multiple measurements at each slice, different values between left and right sides, and nested values within an individual. Thus, each patient had up to 68 ROIs (17 slices, 2 tracts, and 2 sides), with appropriate adjustment for multiple measures. Model covariates included sex, duration from diagnosis, and disease (MS or NMO). A sample size of 36 would detect an 18% difference in AD and RD between good and poor recovery groups at 0.80 power and 0.05 significance. Means were calculated from the mixed-effect model with 95% confidence intervals based on maximum likelihood estimation. EDSS clinical outcomes were categorized as normal/mild disability (0–3.0), moderate disability (3.5–5.5), and severe disability (≥6.0). Both 25FTW and 9HPT were categorized on the basis of SDs from a published normative healthy control population, into normal (<2 SD), mildly abnormal (2–4 SD), and moderately to severely abnormal (>4 SD).16,17 Weighted least-squares estimation was used to determine the interactions of CST and PC tracts to result in normal/mild or moderate/severe impairments.
RESULTS
Demographics.
The 37 subjects included 26 with MS and 11 with NMO, with a median EDSS score of 2.5 (range, 1.0–8.0) and a median disease duration of 3 years (range, 1–29 years; table 1).
Table 1.
Baseline demographics
Vibratory thresholds are specific to posterior column DTI parameters.
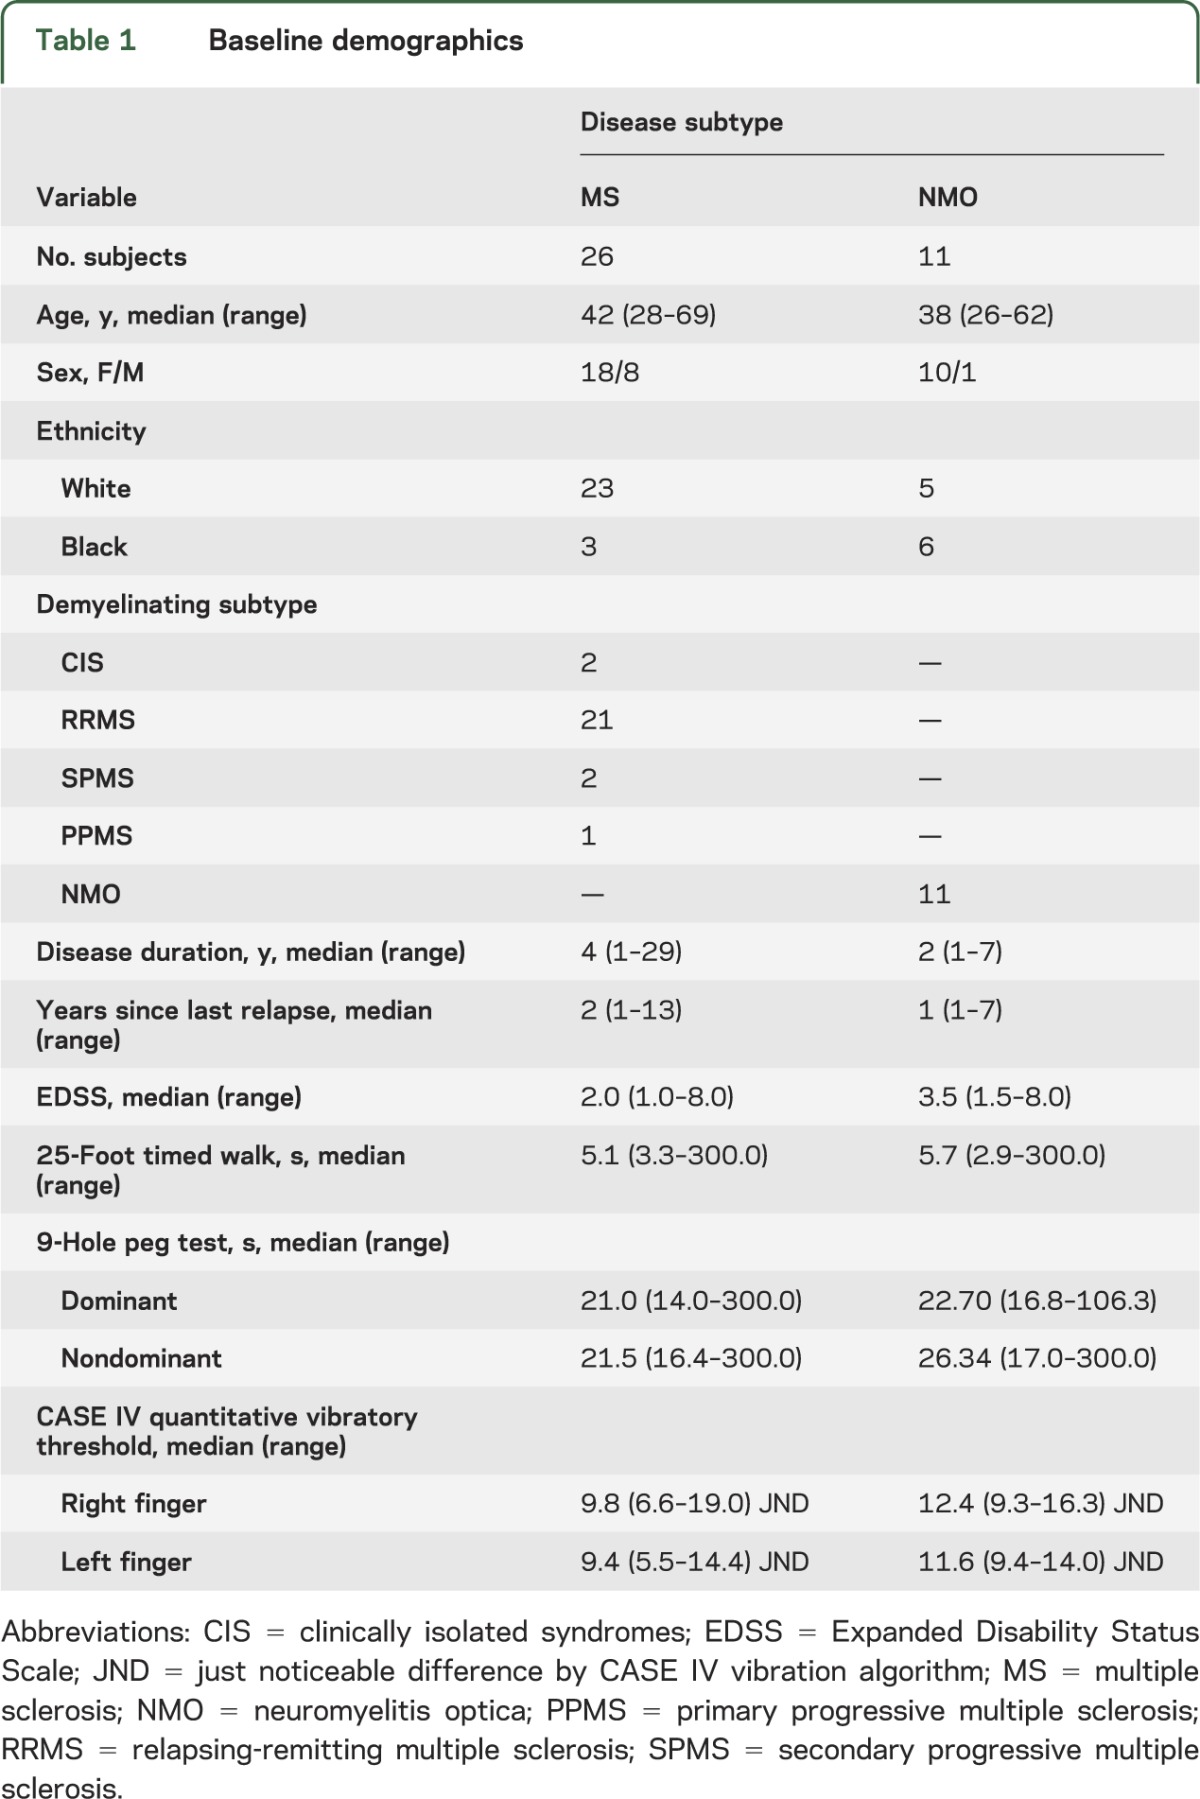
Because vibration sensation is carried exclusively in PCs, upper extremity vibration sense was used to assess the specificity of DTI tract measurements. As anticipated, PC DTI was associated with quantitative vibratory thresholds when analyzing PCs throughout the cervical cord (figure 1; RD, p = 0.007; FA, p = 0.006; mean diffusivity [MD], p = 0.048; AD, p = 0.44) or even when analyzing the 3 worst contiguous slices by DTI (RD, p = 0.007; FA, p = 0.026; MD, p = 0.0020; AD, p = 0.34). Notably, vibration sensation bore no relationship to CST DTI parameters (RD, p = 0.29; FA, p = 0.14; MD, p = 0.82; AD, p = 0.20). Vibration sensation also did not consistently correspond to DTI of the whole axial slice (RD, p = 0.15; FA, p = 0.90; MD, p = 0.16; AD, p = 0.027).
Figure 1. Radial diffusivity in cervical cord posterior columns by vibratory threshold within the fingers.
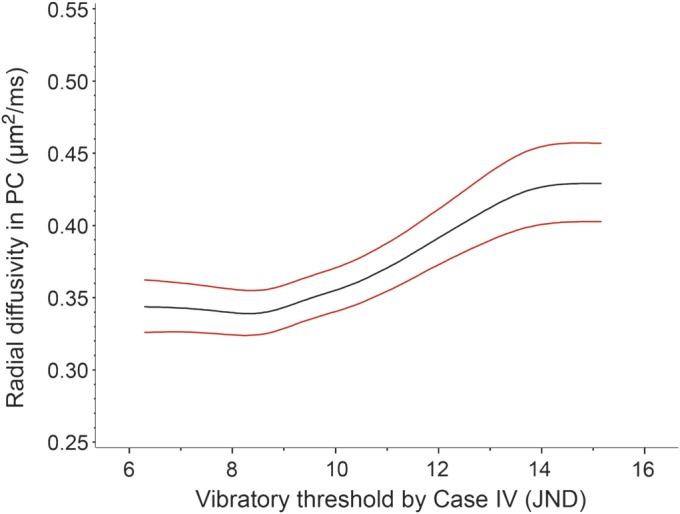
Plots of estimated means with 95% confidence intervals by generalized estimating equations. Radial diffusivity increases with worsening vibration perception scores. Plots of fractional anisotropy were qualitatively similar. JND = just noticeable difference; PC = posterior columns.
9HPT correlated with DTI parameters within CSTs and PCs.
A worse performance on 9HPT was strongly related to increased RD and decreased FA within PCs, CSTs, or the whole axial slice (all p < 0.0001; figure 2, A and B, and table e-1). Increased AD of CST (p = 0.019) and PC (p = 0.060) and increased MD of CST (p = 0.012) generally indicated a worse performance in 9HPT (table e-1). However, FA and RD were each more consistent overall and better separated clinical categories. Decreased mean FA differentiated normal 9HPT times from mildly abnormal and differentiated mildly abnormal from moderately/severely abnormal groups for each tract. FA of PCs differentiated normal (0.780; 95% confidence interval, 0.771–0.788) from mildly reduced 9HPT times (0.759; 0.749–0.768), and mild from moderate/severely reduced 9HPT times (0.711; 0.699–0.722). FA of CSTs differentiated normal (0.785; 0.777–0.793) from mildly reduced 9HPT times (0.767; 0.759–0.775), and mild from moderate/severely reduced times (0.742; 0.732–0.752). Likewise, mean RD differentiated mildly abnormal from moderate/severely abnormal 9HPT times for each tract—PCs (mild, 0.342 mm2/ms [0.330–0.354 mm2/ms]; moderate/severe, 0.398 mm2/ms [0.384–0.413 mm2/ms]) and CSTs (mild, 0.321 mm2/ms [0.311–0.331 mm2/ms]; moderate/severe, 0.359 mm2/ms [0.347–0.372 mm2/ms]). For analyses involving the whole axial slice, FA and RD each differentiated mildly abnormal from moderate/severely abnormal 9HPT times (table e-1).
Figure 2. Fractional anisotropy in posterior columns and corticospinal tracts by 9HPT and 25FTW.

Plots of estimated means with 95% confidence intervals by generalized estimating equations. (A) Fractional anisotropy (FA) within the corticospinal tracts (CSTs) decreases as 9-hole peg test (9HPT) time increases (p < 0.0001). (B) FA within the posterior columns (PCs) decreases as time to complete the 9HPT increases (p < 0.0001). (C) FA in CSTs decreases with increasing 25-foot timed walk (25FTW) times (p = 0.055). (D) For 25FTW, FA in PCs decreases with increasing ambulation time (p < 0.01). Plots of radial diffusivity were qualitatively similar.
25FTW correlated with DTI parameters in CSTs and PCs.
Similar results to those with 9HPT were found when 25FTWs were measured. For PCs, worse ambulation was associated with increased RD or decreased FA (p < 0.0001; figure 2C). For CSTs, RD (p = 0.008) had a clearer association than FA (p = 0.055; figure 2D). When DTI of whole axial slices was analyzed, both RD and FA predicted 25FTW results (RD, p = 0.0001; FA, p = 0.0002; table e-1). Increased mean RD within the PCs differentiated normal and mildly abnormal categories from moderately/severely abnormal (normal, 0.326 μm2/ms [95% confidence interval, 0.316–0.337 μm2/ms]; mild, 0.343 μm2/ms [0.330–0.356 μm2/ms]; moderate/severe, 0.397 μm2/ms [0.383–0.410 μm2/ms]). Decreased mean FA in PCs differentiated normal from mildly abnormal and differentiated mild from moderate/severe categories (normal, 0.777 [0.769–0.786]; mild, 0.755 [0.745–0.765]; moderate/severe, 0.715 [0.705–0.726]). Within the whole axial slice, RD and FA distinguished normal and mildly abnormal from moderately/severely abnormal 25FTW times (table e-1).
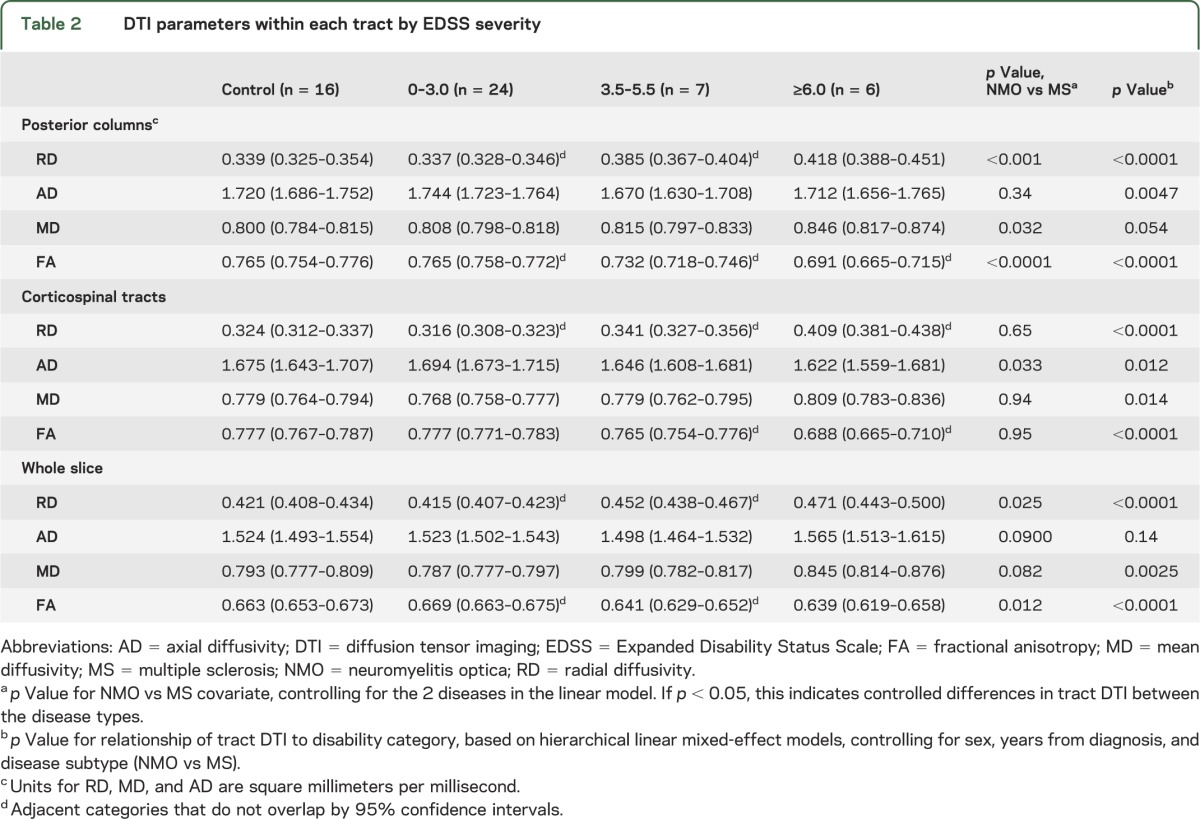
FA and RD in CSTs and PCs differentiated EDSS severities.
As similarly demonstrated for 9HPT and 25FTW, increased RD and decreased FA differentiated EDSS severity categories whether analyzing PCs, CSTs, or the whole slice (all p < 0.0001; table 2). Within CSTs, RD differentiated categories of normal/mild (0–3.0) from moderate (3.5–5.5) EDSS scores and differentiated moderate from severe (≥6.0) scores. FA of CSTs differentiated both mild and moderate from severe EDSS classifications. PC integrity based on FA differentiated mild from moderate and moderate from severe categories. RD of PCs differentiated mild from moderate and severe scores. When the whole axial cord slice rather than individual tracts was used, both RD and FA differentiated mild EDSS scores from moderate and severe.
Table 2.
DTI parameters within each tract by EDSS severity
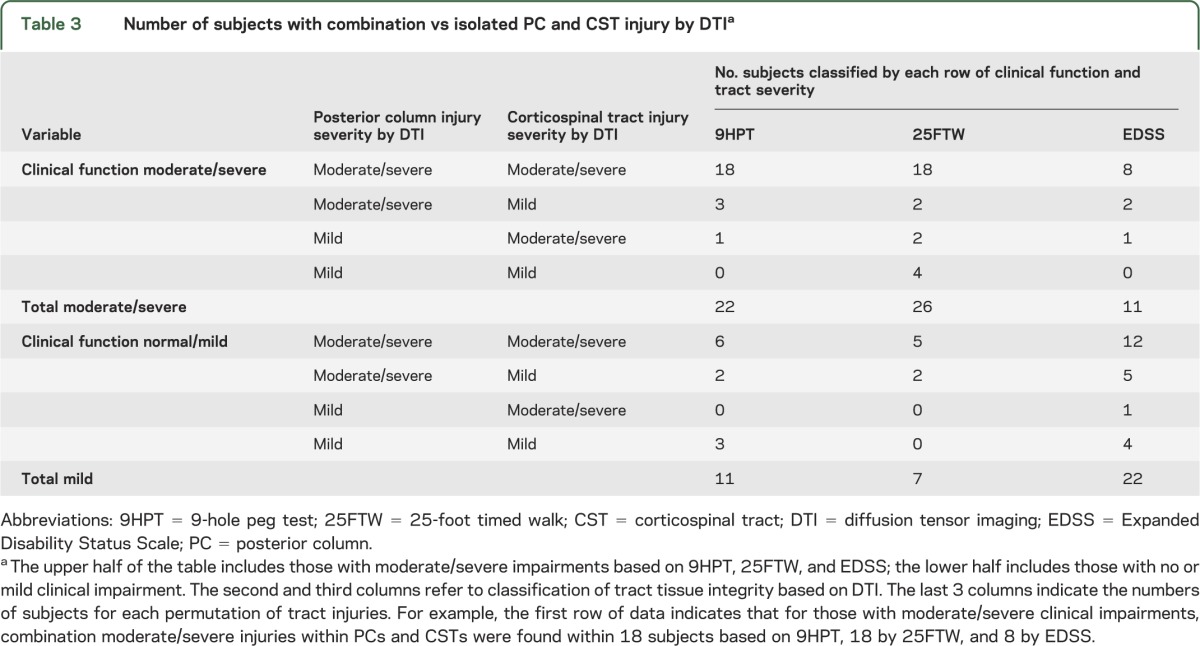
Worse 9HPT and 25FTW times were associated with combined injuries to PCs and CSTs.
Analyses of DTI data established a relationship to functional status for RD and FA within both CSTs and PCs when each tract was independently assessed. However, 9HPT, 25FTW, and EDSS represent integrated clinical functions involving PC afferent and CST efferent fibers. To determine how the integrity of these tracts interacted in relation to clinical function, weighted least-squares estimation evaluated at the individual level whether subjects with moderate/severe clinical dysfunction were more likely to have moderate/severe tissue injury based on DTI in both PCs and CSTs, compared with moderate/severe injury in CSTs alone or PCs alone.
For 9HPT and 25FTW, subjects were clinically classified into normal/mild (≤4 SD from healthy controls) vs moderate/severe (>4 SD from healthy controls). For EDSS, subjects were dichotomized into normal/mild (EDSS score 0–3.0) and moderate/severe (≥3.5) impairments. Thresholds for tissue injury (normal/mild vs moderate/severe) were based on RD by the model-estimated means (table 2 and table e-1).
Participants clinically classified as moderate/severe included 22 by 9HPT, 26 by 25FTW, and 11 by EDSS (table 3). For 9HPT, 18 of 22 with moderate/severe dysfunction had combined moderate/severe tissue injury by RD in both PCs and CSTs, whereas 4 of 22 had moderate/severe DTI abnormalities of only one tract (3 moderate/severe by PCs alone and 1 moderate/severe by CSTs alone). None had mild disease in both tracts (p = 0.006). Similarly, for those 26 with moderate/severe dysfunction on 25FTW, 18 of the 26 had moderate/severe increases in RD for both PCs and CSTs (2 moderate/severe by PCs alone, 2 moderate/severe by CSTs alone, and 4 mild in both tracts; p = 0.017). For the 11 with moderate/severe EDSS scores, 8 (73%) with a moderate/severe EDSS score had combined tract injury (2 moderate/severe by PC alone and 1 moderate/severe by CST alone; p = 0.068). Thus, subjects with worse impairments were more likely to have both PCs and CSTs affected. Although combination tract injury was more common with worse clinical outcomes, combination injury was also observed in many with better clinical outcomes (6 of 11 for 9HPT, 5 of 7 for 25FTW, and 12 of 22 for EDSS).
Table 3.
Number of subjects with combination vs isolated PC and CST injury by DTIa
DISCUSSION
Herein, results of DTI analyses of discrete spinal cord tracts were shown to correlate with specific clinical functions carried by these tracts. As expected, reduced vibratory sense was specifically related to abnormal RD and FA within the PCs, whereas DTI parameters within the CSTs had no apparent relation to vibration sense. The more integrative neurologic functions tested by 9HPT, 25FTW, and EDSS each showed a consistent relationship to RD and FA within both PCs and CSTs. For 9HPT and 25FTW, combined PC and CST injury was more frequent in individuals with more disability compared with when only one tract was affected.
This study is novel because it defines the clinical utility of DTI in spinal cord injury at the tract level in demyelinating diseases. Previously, evaluating the relationship of tracts to clinical findings had been shown only in MS by magnetization transfer ratio (MTR), wherein CSTs were specifically correlated with ankle dorsiflexion strength and walking velocity and PCs were correlated with vibration sense.18 DTI and MTR measure different phenomena. MTR is believed to act as a surrogate of myelin by measuring the concentration of tissue macromolecules. Conversely, DTI measures the directional hindrances to diffusion of water molecules and, thus, provides information regarding fiber orientation and tissue structure. More specifically, RD within chronic lesions provides information about myelin, axons, and the underlying tissue matrix; AD in acute lesions within optic nerves can provide information more specific to axon integrity.19 Whereas both DTI and MTR are valid imaging biomarkers of clinical function in spinal cord disease, the decision to use either depends on the specific clinical question and the timing of spinal cord injury.
This study found FA and RD to be the 2 DTI parameters with the more robust associations with clinical tests, and each provided high discrimination among disease severity levels. In particular, RD was a reliable parameter in this study of remote spinal cord injury, consistent with our prior studies9,10 in the optic nerve and brain. As in our other studies of chronic inflammatory lesions, AD determined by DTI was not as informative.19 Although AD was significant for several relationships, the association was not consistent and did not discriminate levels of disability. This is perhaps due to loss of axons and myelin, resulting in a relatively increased isotropic component that counteracts detection of decreased diffusivity within remaining axons. Also, AD may reflect lesions distant to that site. MD also performed inconsistently as a summary parameter within this highly anisotropic tract. Summary parameters of FA and MD may be more difficult to interpret within tissues undergoing dynamic and complex changes, compared with AD in acute injury and RD in chronic lesions. Emerging diffusion-basis spectrum imaging techniques may have advantages over DTI to separate anisotropic tracts from isotropic components (tissue loss, cells, edema, and gray matter) that may confound DTI results.20
This work examined the spinal cord by using novel tract-level DTI analyses and expanded on published DTI studies in MS focused on the spinal cord as a whole. These prior investigations showed whole cord DTI to be abnormal in MS, correlating with worse vibration sense, hip flexor strength, and EDSS score.21 Whole cord FA was more abnormal in primary progressive MS than relapsing MS.22–25 Not unexpectedly, DTI parameters in MS and NMO were more abnormal within spinal cord regions with T2W lesions, compared with normal-appearing white matter.15,26–29 In acute spinal cord injury due to MS, RD of the whole cord has corresponded to disability and recovery.30 DTI measures of the spinal cord can be combined with other metrics, such as cord area, MTR, and spectroscopy, to provide additional information about clinical outcomes and underlying pathophysiology.18,31–34
Whereas CSTs are important for fine finger movements, large-fiber PC tactile afferents are also critical for coordinated and fine motor tasks (i.e., fastening buttons and picking up coins).35,36 Accordingly, we found that more than 80% of subjects with the most difficulty performing the 9HPT had injury to both PCs and CSTs on the basis of DTI.
Tract-level DTI permits investigation early in the disease process when autopsy material is rarely available. For progressive MS, autopsy studies have shown that significant PC axon loss often accompanies CST axon loss.6 Loss of proprioceptive functions carried in the PCs can act together with weakness and spasticity to further worsen gait. It has been reported that postural balance deficits in MS are highly associated with slowed spinal somatosensory conduction, carried in the PCs.37 DTI at the tract level can help elucidate the in vivo substrates for the varied types of gait dysfunction resulting from spinal cord disease. Herein, moderate or severe dysfunction of walking or by EDSS was uncommonly associated with injury restricted to the PCs or to the CSTs, whereas combined PC and CST injuries were typically observed in these subjects (table 3). This finding suggests that these tracts may compensate for one another to preserve ambulation. A significant number of patients had normal or only mild clinical impairment on testing, despite moderate/severe injury to both tracts by DTI. Future studies are needed to determine whether good clinical scores in the setting of combined tract injury will portend risk for future disability or a progressive disease course.
One limitation of this study was lack of thoracic cord DTI. An acceptable signal-to-noise ratio within a reasonable scan time remains a challenge for thoracic cord DTI because of deep location, small cross-sectional area, and respiratory motion. We focused on vibratory thresholds in the fingers to improve specificity for the cervical cord. Another consideration was the inclusion of 2 pathologically distinct inflammatory demyelinating diseases, MS and NMO, necessitating a covariate in the statistical model to account for their differences. Finally, these results may not be generalizable to those without cervical spinal cord disease.
These studies revealed that high-resolution spinal cord DTI is feasible, specific to the tract, and associated with metrics used in clinical trials and practice (i.e., EDSS and Multiple Sclerosis Functional Composite). This study lends insight into the tract-specific substrates of physical impairment. Moderate or severe dysfunction was most often observed when not only the CSTs, but also the PCs, were involved, thus indicating the importance of the PCs for upper extremity function and gait. In MS and NMO, the frequent coinvolvement of both tracts may be one reason for reduced functional reserve. Tract-specific DTI may be useful to assess new therapies aimed at neuroprotection and enhancing neural repair, particularly in progressive MS where other magnetic resonance measures (e.g., gadolinium-enhancing lesions) are less useful.
Supplementary Material
GLOSSARY
- 9HPT
9-hole peg test
- 25FTW
25-foot timed walk
- CST
corticospinal tract
- DTI
diffusion tensor imaging
- EDSS
Expanded Disability Status Scale
- FA
fractional anisotropy
- MD
mean diffusivity
- MS
multiple sclerosis
- MTR
magnetization transfer ratio
- NMO
neuromyelitis optica
- PC
posterior column
- RD
radial diffusivity
- ROI
region of interest
Footnotes
Supplemental data at www.neurology.org
AUTHOR CONTRIBUTIONS
Dr. Naismith: drafting/revising the manuscript, study concept or design, analysis or interpretation of data, statistical analysis, study supervision. Dr. Xu: drafting/revising the manuscript, study concept or design, analysis or interpretation of data, acquisition of data. Dr. Klawiter, drafting/revising the manuscript, study concept or design, analysis or interpretation of data, acquisition of data. S. Lancia: analysis or interpretation of data, statistical analysis, study supervision. N.T. Tutlam: analysis or interpretation of data, acquisition of data, study supervision. Dr. Wagner: drafting/revising the manuscript. Dr. Qian: drafting/revising the manuscript, study concept or design, acquisition of data. Dr. Trinkaus: analysis or interpretation of data, statistical analysis. Dr. Song: drafting/revising the manuscript, study concept or design, study supervision. Dr. Cross: drafting/revising the manuscript, study concept or design, analysis or interpretation of data, acquisition of data, study supervision, obtaining funding.
STUDY FUNDING
Supported by the NIH (P01 NS059560 to A.H.C., R01 NS047592 to S.K.S., K23NS052430-01A1 to R.T.N., K12 HD055931 to J.M.W., T32NS007205 to P.Q., and K24 RR017100 to A.H.C.); E.C.K. was supported by an American Academy of Neurology Foundation Clinical Research Training Fellowship and the NIH (UL1RR024992). J.X. was supported by a National Multiple Sclerosis Society Postdoctoral Fellowship (FG 1782). A.H.C. was supported in part by the Manny and Rosalyn Rosenthal–Dr. John L. Trotter Chair in Neuroimmunology. This publication was made possible by grant UL1 RR024992 from the National Center for Research Resources (NCRR), a component of the NIH and NIH Roadmap for Medical Research. This research was also supported in part by NIH grants CO6 RR020092 and UL1 TR000448 (Washington University Institute of Clinical and Translational Sciences—Brain, Behavioral and Performance Unit). Its contents are solely the responsibility of the authors and do not necessarily represent the official view of NCRR or NIH.
DISCLOSURE
Dr. Naismith has received consulting fees and speaking honoraria from Acorda Therapeutics, Bayer Healthcare, Biogen Idec, Genzyme Corporation, EMD Serono, and Questcor. Research funding is through the NIH and Acorda Therapeutics. Dr. Xu reports no disclosures. Dr. Klawiter has received clinical trials funding through Roche and consulting fees and speaking honoraria from Bayer Healthcare, Genzyme Corporation, and Teva Neurosciences. S. Lancia reports no disclosures. N.T. Tutlam reports no disclosures. Dr. Wagner has received speaking honoraria from Acorda Therapeutics. Dr. Qian has received speaking honoraria from Teva Neurosciences. Dr. Trinkaus reports no disclosures. Dr. Song reports no disclosures. Dr. Cross has received research and clinical trial funding from the NIH, the US Department of Defense, National Multiple Sclerosis Society USA, the Consortium of Multiple Sclerosis Centers, the Barnes-Jewish Hospital Foundation, Genzyme, Hoffman–La Roche, and Sanofi-Aventis, and honoraria or consulting fees from Hoffman–La Roche, Sanofi-Aventis, Novartis, Bayer Healthcare, Biogen-Idec, Questcor, and Teva Neuroscience. Go to Neurology.org for full disclosures.
REFERENCES
- 1.Bot JC, Barkhof F, Polman CH, et al. Spinal cord abnormalities in recently diagnosed MS patients: added value of spinal MRI examination. Neurology 2004;62:226–233 [DOI] [PubMed] [Google Scholar]
- 2.Lycklama G, Thompson A, Filippi M, et al. Spinal-cord MRI in multiple sclerosis. Lancet Neurol 2003;2:555–562 [DOI] [PubMed] [Google Scholar]
- 3.Ikuta F, Zimmerman HM. Distribution of plaques in seventy autopsy cases of multiple sclerosis in the United States. Neurology 1976;26:26–28 [DOI] [PubMed] [Google Scholar]
- 4.Lucchinetti CF, Mandler RN, McGavern D, et al. A role for humoral mechanisms in the pathogenesis of Devic’s neuromyelitis optica. Brain 2002;125:1450–1461 [DOI] [PMC free article] [PubMed] [Google Scholar]
- 5.Nijeholt GJ, Bergers E, Kamphorst W, et al. Post-mortem high-resolution MRI of the spinal cord in multiple sclerosis: a correlative study with conventional MRI, histopathology and clinical phenotype. Brain 2001;124:154–166 [DOI] [PubMed] [Google Scholar]
- 6.DeLuca GC, Ebers GC, Esiri MM. Axonal loss in multiple sclerosis: a pathological survey of the corticospinal and sensory tracts. Brain 2004;127:1009–1018 [DOI] [PubMed] [Google Scholar]
- 7.Tallantyre EC, Bø L, Al-Rawashdeh O, et al. Clinico-pathological evidence that axonal loss underlies disability in progressive multiple sclerosis. Mult Scler 2010;16:406–411 [DOI] [PubMed] [Google Scholar]
- 8.Rocca MA, Hickman SJ, Bö L, et al. Imaging spinal cord damage in multiple sclerosis. J Neuroimaging 2005;15:297–304 [DOI] [PubMed] [Google Scholar]
- 9.Naismith RT, Xu J, Tutlam NT, et al. Radial diffusivity in remote optic neuritis discriminates visual outcomes. Neurology 2010;74:1702–1707 [DOI] [PMC free article] [PubMed] [Google Scholar]
- 10.Naismith RT, Xu J, Tutlam NT, et al. Increased diffusivity in acute multiple sclerosis lesions predicts risk of black hole. Neurology 2010;74:1694–1701 [DOI] [PMC free article] [PubMed] [Google Scholar]
- 11.Polman CH, Reingold SC, Banwell B, et al. Diagnostic criteria for multiple sclerosis: 2010 revisions to the McDonald criteria. Ann Neurol 2011;69:292–302 [DOI] [PMC free article] [PubMed] [Google Scholar]
- 12.Wingerchuk DM, Lennon VA, Lucchinetti CF, Pittock SJ, Weinshenker BG. The spectrum of neuromyelitis optica. Lancet Neurol 2007;6:805–815 [DOI] [PubMed] [Google Scholar]
- 13.Dyck PJ, O'Brien PC, Kosanke JL, Gillen DA, Karnes JL. A 4, 2, and 1 stepping algorithm for quick and accurate estimation of cutaneous sensation threshold. Neurology 1993;43:1508–1512 [DOI] [PubMed] [Google Scholar]
- 14.Xu J, Shimony JS, Klawiter EC, et al. Improved in vivo diffusion tensor imaging of human cervical spinal cord. Neuroimage 2013;67:64–76 [DOI] [PMC free article] [PubMed] [Google Scholar]
- 15.Klawiter EC, Xu J, Naismith RT, et al. Increased radial diffusivity in spinal cord lesions in neuromyelitis optica compared with multiple sclerosis. Mult Scler 2012;18:1259–1268 [DOI] [PMC free article] [PubMed] [Google Scholar]
- 16.Oxford Grice K, Vogel KA, Le V, Mitchell A, Muniz S, Vollmer MA. Adult norms for a commercially available Nine Hole Peg Test for finger dexterity. Am J Occup Ther 2003;57:570–573 [DOI] [PubMed] [Google Scholar]
- 17.Bohannon RW. Comfortable and maximum walking speed of adults aged 20-79 years: reference values and determinants. Age Ageing 1997;26:15–19 [DOI] [PubMed] [Google Scholar]
- 18.Zackowski KM, Smith SA, Reich DS, et al. Sensorimotor dysfunction in multiple sclerosis and column-specific magnetization transfer-imaging abnormalities in the spinal cord. Brain 2009;132:1200–1209 [DOI] [PMC free article] [PubMed] [Google Scholar]
- 19.Naismith RT, Xu J, Tutlam NT, et al. Diffusion tensor imaging in acute optic neuropathies: predictor of clinical outcomes. Arch Neurol 2012;69:65–71 [DOI] [PMC free article] [PubMed] [Google Scholar]
- 20.Wang Y, Wang Q, Haldar JP, et al. Quantification of increased cellularity during inflammatory demyelination. Brain 2011;134:3590–3601 [DOI] [PMC free article] [PubMed] [Google Scholar]
- 21.Oh J, Zackowski K, Chen M, et al. Multiparametric MRI correlates of sensorimotor function in the spinal cord in multiple sclerosis. Mult Scler Epub 2012. Aug 13. [DOI] [PMC free article] [PubMed] [Google Scholar]
- 22.Agosta F, Absinta M, Sormani MP, et al. In vivo assessment of cervical cord damage in MS patients: a longitudinal diffusion tensor MRI study. Brain 2007;130:2211–2219 [DOI] [PubMed] [Google Scholar]
- 23.Agosta F, Benedetti B, Rocca MA, et al. Quantification of cervical cord pathology in primary progressive MS using diffusion tensor MRI. Neurology 2005;64:631–635 [DOI] [PubMed] [Google Scholar]
- 24.Valsasina P, Rocca MA, Agosta F, et al. Mean diffusivity and fractional anisotropy histogram analysis of the cervical cord in MS patients. Neuroimage 2005;26:822–828 [DOI] [PubMed] [Google Scholar]
- 25.Benedetti B, Rocca MA, Rovaris M, et al. A diffusion tensor MRI study of cervical cord damage in benign and secondary progressive multiple sclerosis patients. J Neurol Neurosurg Psychiatry 2010;81:26–30 [DOI] [PubMed] [Google Scholar]
- 26.Van Hecke W, Nagels G, Emonds G, et al. A diffusion tensor imaging group study of the spinal cord in multiple sclerosis patients with and without T2 spinal cord lesions. J Magn Reson Imaging 2009;30:25–34 [DOI] [PubMed] [Google Scholar]
- 27.Ohgiya Y, Oka M, Hiwatashi A, et al. Diffusion tensor MR imaging of the cervical spinal cord in patients with multiple sclerosis. Eur Radiol 2007;17:2499–2504 [DOI] [PubMed] [Google Scholar]
- 28.Qian W, Chan Q, Mak H, et al. Quantitative assessment of the cervical spinal cord damage in neuromyelitis optica using diffusion tensor imaging at 3 tesla. J Magn Reson Imaging 2011;33:1312–1320 [DOI] [PubMed] [Google Scholar]
- 29.Benedetti B, Valsasina P, Judica E, et al. Grading cervical cord damage in neuromyelitis optica and MS by diffusion tensor MRI. Neurology 2006;67:161–163 [DOI] [PubMed] [Google Scholar]
- 30.Freund P, Wheeler-Kingshott C, Jackson J, Miller D, Thompson A, Ciccarelli O. Recovery after spinal cord relapse in multiple sclerosis is predicted by radial diffusivity. Mult Scler 2010;16:1193–1202 [DOI] [PMC free article] [PubMed] [Google Scholar]
- 31.Ciccarelli O, Wheeler-Kingshott CA, McLean MA, et al. Spinal cord spectroscopy and diffusion-based tractography to assess acute disability in multiple sclerosis. Brain 2007;130:2220–2231 [DOI] [PubMed] [Google Scholar]
- 32.Marliani AF, Clementi V, Albini Riccioli L, et al. Quantitative cervical spinal cord 3T proton MR spectroscopy in multiple sclerosis. AJNR Am J Neuroradiol 2010;31:180–184 [DOI] [PMC free article] [PubMed] [Google Scholar]
- 33.Zivadinov R, Banas AC, Yella V, Abdelrahman N, Weinstock-Guttman B, Dwyer MG. Comparison of three different methods for measurement of cervical cord atrophy in multiple sclerosis. AJNR Am J Neuroradiology 2008;29:319–325 [DOI] [PMC free article] [PubMed] [Google Scholar]
- 34.Rashid W, Davies GR, Chard DT, et al. Increasing cord atrophy in early relapsing-remitting multiple sclerosis: a 3 year study. J Neurol Neurosurg Psychiatry 2006;77:51–55 [DOI] [PMC free article] [PubMed] [Google Scholar]
- 35.Gilman S, Denny-Brown D. Disorders of movement and behaviour following dorsal column lesions. Brain 1966;89:397–418 [DOI] [PubMed] [Google Scholar]
- 36.Johansson RS, Flanagan JR. Coding and use of tactile signals from the fingertips in object manipulation tasks. Nat Rev Neurosci 2009;10:345–359 [DOI] [PubMed] [Google Scholar]
- 37.Cameron MH, Horak FB, Herndon RR, Bourdette D. Imbalance in multiple sclerosis: a result of slowed spinal somatosensory conduction. Somatosens Mot Res 2008;25:113–122 [DOI] [PMC free article] [PubMed] [Google Scholar]
Associated Data
This section collects any data citations, data availability statements, or supplementary materials included in this article.