Abstract
Background/Aims
We have previously shown, in a semiquantitative analysis of liver biopsies showing cirrhosis, that thickness of fibrous septa separating cirrhotic nodules and small size of cirrhotic nodules correlated independently with portal pressure (as determined by the hepatic venous pressure gradient, HVPG) and were independent predictors of the presence of clinically significant portal hypertension. This study aimed to confirm these results using quantitative analysis of these biopsies using digital image analysis.
Methods
Biopsies of 42 patients with cirrhosis and HVPG measurements within six months of the biopsy were included in the study. The following parameters were scored quantitatively and without knowledge of HVPG results: total fibrosis area, septal thickness, nodule size, and number of nodules/mm length of liver biopsy.
Results
Fibrosis area was the only parameter that independently correlated with HVPG (r=0.606; p<0.0001). Correlation was significant even among patients with clinically significant portal hypertension (r=0.636, p<0.005). Fibrosis area and nodule size were both independently predictive of the presence of clinically significant portal hypertension (r=0.57, p=0.003).
Conclusions
On quantitative analysis, fibrosis area is the parameter that correlates best with HVPG and the presence of clinically significant portal hypertension. Beyond pathophysiological implications, this also has methodological implications that are discussed in the paper.
Cirrhosis is the end stage of any chronic liver disease and is defined histologically by the presence of regenerative nodules surrounded by fibrous tissue. This architectural distortion leads to increased intrahepatic resistance which in turn leads to portal hypertension. Portal hypertension is defined clinically as a portal pressure (as assessed by the hepatic venous pressure gradient) of 5 mmHg or greater. However, in patients with cirrhosis and portal hypertension, the complications of cirrhosis, including esophageal varices, clinical decompensation (i.e. development of ascites, encephalopathy and variceal hemorrhage) and hepatocellular carcinoma occur at a significantly higher rate in patients in whom the HVPG is >10 mmHg [1-3]. This threshold portal pressure level has been termed “clinically significant portal hypertension” (CSPH) [4].
While histology is an important determinant of the severity of chronic liver disease, it is the degree of portal hypertension that is an important determinant of the severity of cirrhosis. In a study aimed at establishing the relationship between specific histological parameters in cirrhosis and HVPG, we demonstrated that thickness of fibrous septa separating cirrhotic nodules and small size of cirrhotic nodules were independent predictors of the presence of CSPH in patients with predominantly hepatitis C [5]. In the study, histological parameters were subjectively assessed by two independent observers in a semi-quantitative fashion, in that septal thickness was classified as narrow, wide or intermediate, and nodule size was classified as small, large or mixed.
The need for validation of this semiquantitative assessment using a more objective, quantitative way of assessing these histological parameters was proposed in that paper [5]. Therefore, the aim of this study is to determine the relationship between HVPG, clinically significant portal hypertension (CSPH) and specific histological parameters in cirrhosis, assessed quantitatively by digital imaging analysis.
Methods
Material
Biopsy slides of patients in whom the diagnosis of cirrhosis was established histologically and who had hepatic venous pressure measurement (HVPG) performed within six months of each other were included in the study. The same study population/biopsy material described in our previous study [5] was used in this study.
Digital imaging analysis
Liver biopsies are routinely formalin-fixed paraffin-embedded at our institution and slides are stained with hematoxylin and eosin and trichrome stain (Masson or Klatskin) for diagnostic purposes. Only trichrome-stained (Masson or Klatskin) slides were used for digital image analysis. A liver biopsy size of at least 10 mm was required for inclusion in the study. In fragmented biopsies, the total length was estimated by adding maximum dimensions of each individual fragment. The equipment used for digital image analysis, consisted of a microscope (Olympus CX41) with images recorded by a digital camera (RETIGA 1300 color 12-bit) connected to a personal computer. Images were analyzed using Bioquant Nova Prime software (Bioquant Image Analysis Corporation, Nashville, USA), a Microsoft® Windows® application for automated and semi-automated quantitative analysis of fixed histological sections. All available liver tissue on each biopsy slide was entirely analyzed field by field for various histological parameters. As previously described [6], sections were placed on the x-y motorized tray (to avoid field overlap) and, after equalization of light intensity, each image was digitized in a 640 × 480 pixel picture. Images were obtained and evaluated at a 4× magnification. Optical field was defined as an area of 3.36 mm2 for a 640 × 480 pixels picture, resulting in an optical resolution of 0.09 μm2/pixel.
A single operator (SS) determined 4 histological parameters: 1) fibrosis area expressed as a percentage of the total area of the liver tissue in the biopsy occupied by fibrous tissue; 2) width of fibrous septa separating cirrhotic nodules; 3) nodule size; and 4) number of cirrhotic nodules per millimeter length of the biopsy. The observer was blinded as to the HVPG results and the histological semiquantitative results.
To estimate fibrosis area, the color editing function of the software was used to select the entire area of fibrous tissue (green pixels for Masson trichrome stain, blue pixels for Klatskin stain). The total biopsy area, expressed in μm2, was also selected using the software and consisted of the area occupied by the hepatic parenchyma, fibrous tissue, nodules and vessels. Fibrosis area was calculated as the ratio between the area of fibrosis and the total biopsy area and expressed as a percentage. In previous studies, this method has been shown to achieve high levels of accuracy, reliability, objectivity and reproducibility [6-9]. Septal width was determined as the distance (in μm) between adjacent cirrhotic nodules and was measured at multiple (at least three) points using a standard grid marker (Figure 1). The median septal width was calculated for each septa and then for the entire biopsy. Nodule size was a measure of the maximum length (in μm) of each nodule along the long axis of the biopsy (Figure 1). A minimum of 5 nodules were measured in each biopsy and the median was calculated and expressed as number of nodules per millimeter of biopsy. Incomplete or partial nodules at the end or at the edges of a fragment were counted as individual nodules. Small fragments that had only one or only partial nodules were not analyzed for septal width, nodule size or number of nodules. In cases where multiple good cores of liver tissue were contained in the biopsy slide, the 2-3 most representative cores were used for image analysis. Cases that had extremely fragmented biopsy and contained <2 fragments that met the criteria for measuring the various histologic parameters were excluded from the study.
Figure 1.
Quantitative measurements. Septal width was assessed by measuring the distance between two cirrhotic nodules at multiple points (at least 3, red arrows). Nodule size was assessed as the maximum length along the long axis of the biopsy (black arrows).
Hepatic Venous Pressure Gradient Measurements
As described in our previous paper [5], HVPG was measured at either the Hepatic Hemodynamic Laboratory at the VA CT Healthcare System or at an Interventional Radiology suite at Yale New Haven Hospital, following guidelines established in these centers [10]. Clinically significant portal hypertension (CSPH) was defined as an HVPG ≥ 10 mmHg.
Statistical analysis
Analysis was performed on a database in which the results of digital image analysis were entered prior to entering the HVPG data. Non-parametric statistics were used and results are expressed as medians (ranges). The correlation between HVPG and the different digital image analysis parameters was performed using Spearman correlation. Variables that were significant at p values equal or lower than 0.05 were entered in a stepwise linear regression analysis. Comparison of digital image analysis parameters between patients with or without CSPH was performed using the Mann-Whitney test. Variables that were significant at p values equal or lower than 0.05 were entered into a backward logistic regression model. Statistical analysis was performed using the SPSS statistical package.
Results
Characteristics of study population
Of the 43 patients/biopsy slides analyzed in our previous study [5], digital image analysis could be performed in 42 liver biopsies. One biopsy had to be excluded because it was fragmented and contained <2 fragments. Of the 42 biopsies, 33 were obtained via the transjugular route and 9 were obtained percutaneously. The 42 biopsies were obtained from 42 patients with a median age of 45 years (range 23-79 years), 31 (74%) were male. Etiology of cirrhosis was hepatitis C in 21 (50%), alcohol in 10 (24%) (2 with hepatitis C), 5 (12%) each with autoimmune and cryptogenic cirrhosis and 1 case of hepatitis B. Median HVPG in this study population was 11.4 mmHg (range of 5-28 mmHg). Twenty-four (57%) had an HVPG ≥ 10 mmHg, that is, they had CSPH.
Liver biopsy characteristics on digital image analysis
Median total fibrosis area was 21.1% (range 4.3 – 46.0); median septal width was 186 μm (range 32-1,151); median nodule size was 720 μm (range 236 – 1,846); and the median number of nodules per mm of liver biopsy was 0.84 (range 0.36 – 1.92).
Correlation between HVPG and digital imaging analysis parameters
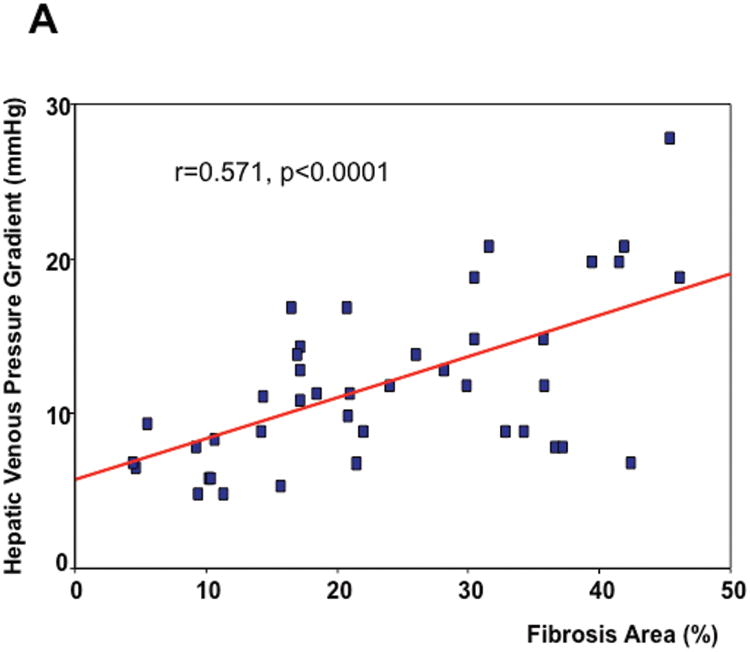
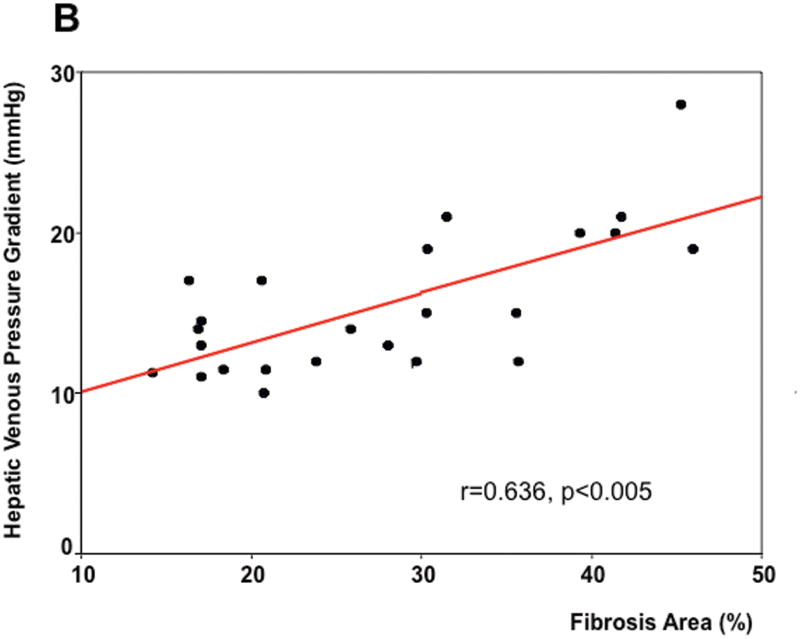
As seen in Table 1, on univariate analysis, the two parameters that significantly correlated with HVPG were fibrosis area (r=0.571, p<0.0001) (Figure 2A) and nodule size (r=-0.415, p=0.006). These two parameters were entered in the multivariable model and, on linear regression, the only parameter that independently correlated with the HVPG was fibrosis area with a regression coefficient of 0.606 (p<0.0001). Remarkably, the significant correlation between HVPG and fibrosis area was maintained if only patients with CSPH were analyzed (r=0.636, p<0.005)(Figure 2B).
Table 1. Correlation between histological parameters and HVPG.
| Histological feature | Spearman correlation coefficient | p |
|---|---|---|
| Fibrosis area (%) | 0.571 | <0.001 |
| Nodules per mm | 0.143 | 0.367 |
| Septal width (μm) | 0.089 | 0.577 |
| Nodule size (μm) | 0.415 | 0.006 |
Figure 2.
Correlation between hepatic venous pressure gradient (HVPG) and total fibrosis area in all biopsy slides (A) and in biopsies of patients with clinically significant portal hypertension (B).
Correlation between clinically significant portal hypertension (CSPH) and histological parameters
As shown in Table 2, on univariate analysis, fibrosis area, nodule size and number of nodules were significantly different between patients with and without CSPH. Septal width was not significantly different between groups. Given an (expected) significant correlation between nodule size and number of nodules (r=-0.482, p=0.001), only fibrosis area and nodule size were entered into the multivariable model. By backward logistic regression, both parameters remained in the model, that is, both fibrosis area and nodule size were independently predictive of the presence (or absence) of CSPH (r=0.57, p=0.003). Of 11 patients with a fibrosis area <15%, only 1 had CSPH. Conversely, except for one, all 13 patients with a nodule size <6 mm, had CSPH.
Table 2. Histological parameters and the presence or absence of clinically significant portal hypertension (results are expressed in medians (ranges).
| Histological feature | HVPG <10 mmHg (n=18) | HVPG >10 mmHg (n= 24) | p |
|---|---|---|---|
| Fibrosis area (%) | 12.6 (4.3-42.3) | 27.0 (14.2-46.0) | 0.01 |
| Nodule size (μ) | 829.2 (596.0-1845.8) | 602.4 (235.8-1561.5) | 0.001 |
| Number of nodules/mm | 0.72 (0.36-1.25) | 0.95 (0.521-1.92) | 0.05 |
| Septal width (μ) | 212 (32.3-975.3) | 179.6 (71.6-1151.4) | 0.65 |
Discussion
Liver biopsy remains the gold standard for staging diffuse liver disease with the highest degree of severity being the cirrhotic stage. In our previous study we had proposed that the cirrhotic stage could be further sub-classified based on histological parameters that correlated with HVPG and the presence of clinically significant portal hypertension (CSPH) [5] which is defined by an HVPG ≥10 mmHg as it is a strong predictor of variceal development [1], clinical decompensation (ascites, encephalopathy and variceal hemorrhage) [2] and hepatocellular carcinoma [11].
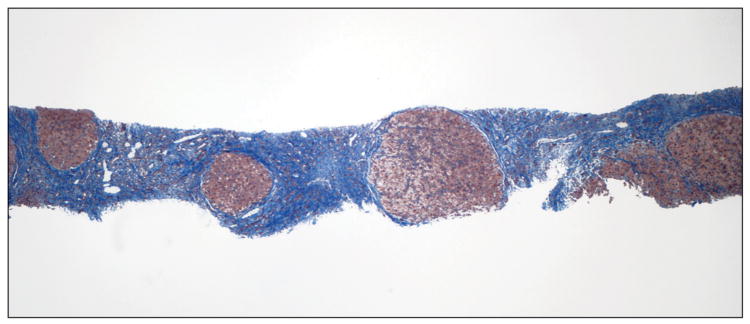
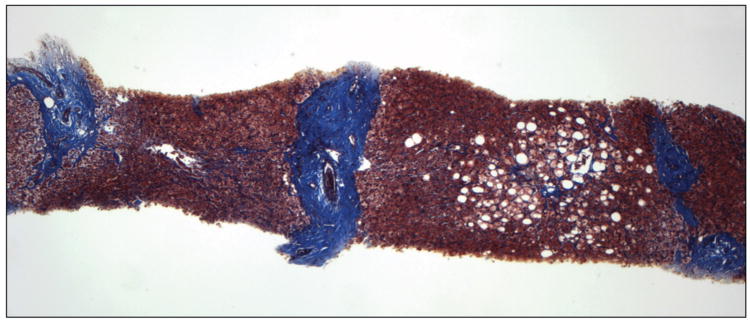
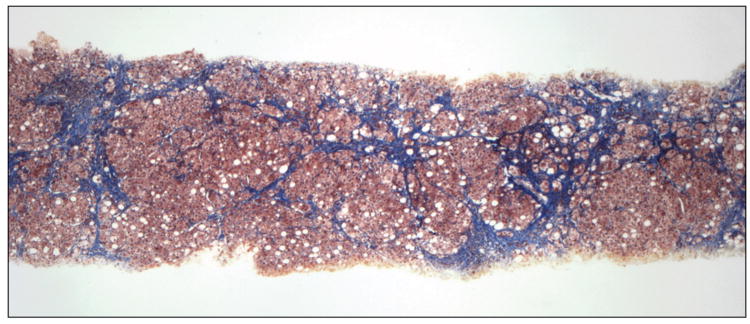
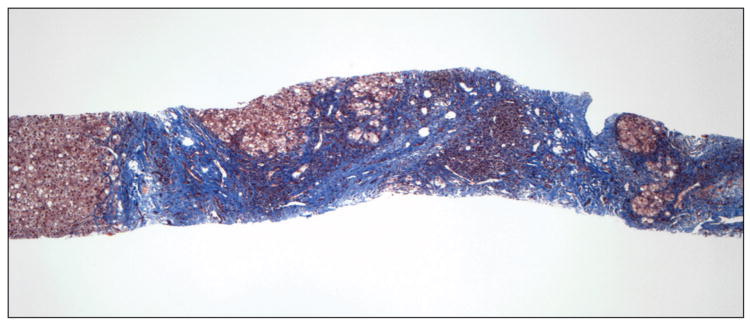
In our previous study, in which liver biopsies were evaluated semiquantitatively, small nodule size and thick fibrous septa were identified as independent predictors of HVPG and the presence of CSPH leading to a position paper putting forward a pathophysiological classification of cirrhosis [12]. Our results were subsequently confirmed in a similar study performed in patients with cirrhosis predominantly due to hepatitis B [13].In the present study we partially confirm these findings using a quantitative method previously validated for the assessment of fibrosis area in chronic hepatitis C [6;14]. Small nodule size predicted CSPH and even though septal width did not, total fibrosis area was the most important predictor of CSPH and the only parameter that correlated with HVPG. Examples of liver biopsies from 2 patients with and without CSPH, are shown in figure 3A&B, respectively.
Figure 3.
Liver biopsy of patients with (A) and without (B) clinically significant portal hypertension (Masson stain). In A, there are multiple small nodules (<1mm) separated by wide fibrous septa which are >1mm thick. Fibrosis area was estimated at 46% and HVPG was 28 mmHg. In B, there are multiple large nodules (>2mm) separated by thin fibrous septa which are <1mm thick. Fibrosis area was estimated at 10% and HVPG was 6 mmHg.
Semiquantitative analysis can be performed at the time of the histological evaluation of a liver biopsy, while quantitative fibrosis analysis requires additional resources and time and requires evaluating interobserver and intraobserver reproducibility.
Based on both of our studies we are able to compare and contrast the predictive value of each histological parameter vis-a-vis the method used and in the context of histological changes that occur in cirrhosis.
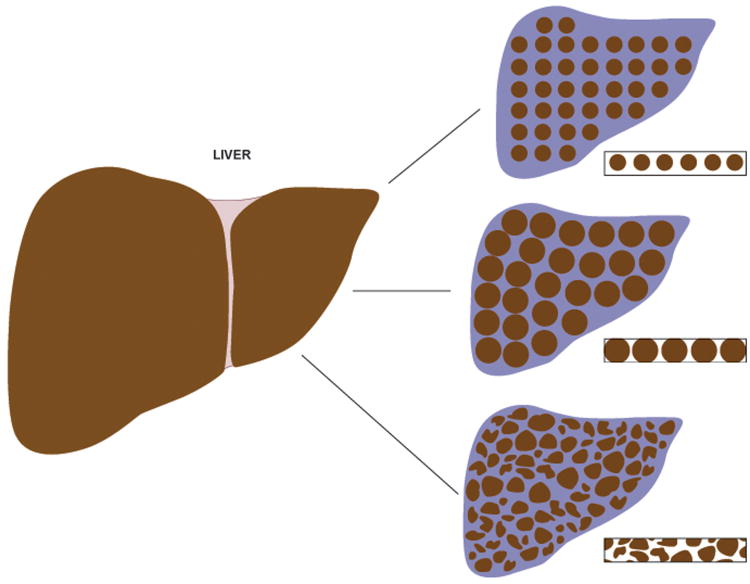
If the fibrotic process occurred uniformly, nodules would be perfectly rounded and distributed evenly throughout the liver. In this setting, increased fibrous tissue (and increased resistance in the liver) would be associated with increased total fibrosis area, increased septal width, smaller nodule size and a larger number of nodules per unit volume of liver tissue (Figure 4A). Conversely, with larger nodules, the area of fibrosis would be smaller, septae would be narrower and there would be fewer nodules per unit of liver tissue (Figure 4B).In these models, any of these parameters (fibrosis area, septal width, nodule size and number of nodules) could be easily calculated by obtaining measurements of two other parameters. However, in reality changes in liver histology are not uniform and nodules of different sizes and septa of different thicknesses are present in the same or different histological sections (Figure 4C). Furthermore, as a needle biopsy specimen often represents <1/50,000 of the liver this in itself could lead to a great potential for sampling error [15].Total fibrosis area is most reliably assessed by quantification using image analysis, while it cannot be evaluated reliably in liver biopsies by semi-quantitative analysis. Conversely, assessment of septal width is most easily performed on a cursory low magnification examination (“bird's eye view”) of a liver biopsy compared to measuring multiple points of the septae between two irregular nodules using image analysis. The situation is similar in a biopsy with very delicate thin fibrous septa where measurement of septal thickness by digital image analysis is difficult, but septal width is fairly obvious with a semi-quantitative subjective analysis (Figure 5A). This explains why in our previous study, septal width was the parameter most predictive of HVPG and CSPH while in the present study it was fibrosis area that predicted these best.
Figure 4.
Three models of cirrhosis and theoretical biopsy slides from each model. A) small perfectly rounded nodules are uniformly distributed throughout the liver, fibrous septae are thick and fibrosis area is large; B) large nodules are uniformly distributed throughout the liver, fibrous septae are thin and fibrous area is smaller; C) real model in which nodules are neither uniformly distributed nor are perfectly rounded. Consequently, septal width is also variable.
Figure 5.
Biopsies exemplifying problems confronted with quantitative analysis (trichrome stain). In A there are variably sized irregular nodules with thin and very delicate fibrous septa. The irregular outline of the nodules and the fibrosis pattern would be very difficult to assess quantitatively. The patient did not have clinically significant portal hypertension. In B there are variably sized nodules with a very large nodule seen on the left edge and multiple small nodules with irregular outlines and thick fibrous septae. While the semiquantitative analysis would conclude that nodules are small, size would be falsely overrepresented in a quantitative analysis by averaging the size of the large nodule. The patient had clinically-significant portal hypertension.
On the other hand, measurements of nodule size with image analysis, while more precise if the nodule evaluated is complete and rounded, is more difficult to evaluate when the nodule is irregular and/or incomplete as often occurs (particularly in fragmented specimens). Subjective assessment of nodule size takes into account the predominant type of nodule (small or large) at a low magnification, while quantification of nodule size by image analysis will average different sizes and may overrepresent a non-predominant type of nodule (Figure 5B). This may explain why in our previous study, nodule size correlated well with HVPG and was predictive of CSPH, while in the current study nodule size was not an independent predictor of HVPG. Notably, in our previous study we had arbitrarily defined small nodules as those smaller than 1 mm and this approximation was quite accurate given that in the present study the median nodule size in patients with CSPH was 0.6 mm while in those without CSPH it was 0.8 mm. Therefore, while all these histological parameters in cirrhosis are conceptually important in assessing the structural remodeling of the liver, they may not be equally assessed by different methodologies. Depending on the method, different parameters may correlate better with HVPG. While fibrosis area is most accurately assessed by quantitative image analysis, nodule size and septal width are better assessed by subjective assessment of liver biopsies at low magnification. Thus, the use of quantitative image analysis may not be currently practical in the substaging of cirrhotic biopsies, while this could be more easily achieved with some standardization of semi-quantitative measurements of septal width and nodule size.
Beyond the clinical implications that this validation study puts forward, that is, that specific histological findings in cirrhosis may be able to predict the likelihood of developing varices or clinical decompensation, this study shows that it is the total fibrosis area that is the most important determinant of portal hypertension. Our findings are not unexpected and are consistent with the pathophysiology of portal hypertension in cirrhosis, where an increased intrahepatic resistance plays a major role [16]. The greater the fibrosis area, the greater the obstruction to portal flow and the higher the portal pressure and this is shown by the positive correlation even among patients who already have clinically significant portal hypertension. Small nodule size is also indicative of greater architectural distortion, decreasing functional reserve of liver and will theoretically further increase intrahepatic resistance as well as indicate more severe disease. Although other factors, such as active constriction of intrahepatic vessels [17] and an increase in portal venous inflow secondary to splanchnic vasodilatation [18] play an important role in the pathogenesis of portal hypertension, our findings support the important role that intrahepatic structural abnormalities play in the pathophysiology of portal hypertension. It may well be that the hyperdynamic splanchnic circulation becomes a more dominant factor in the maintenance of portal hypertension in cases of more severe cirrhosis and portal hypertension [19].
A recent study also using digital image analysis showed that the collagen proportionate area (similar to our fibrosis area) correlates with HVPG and was superior to the semiquantitative Ishak fibrosis system in patients with chronic hepatitis C [14]. It is important to note that this study is different from ours because it included all stages of fibrosis (from no fibrosis to cirrhosis) while our study is restricted to only biopsies at the cirrhotic stage. In another study examining histomorphometry using an image analyzer in cirrhotic biopsies, the only significant (negative) correlation identified was between HVPG and the number of residual portal spaces, i.e. portal spaces not involved in the process of bridging fibrosis [20]. However, evaluation of residual portal tracts is difficult and our findings may be reflective of this process and more compatible with the pathophysiology of cirrhosis and portal hypertension. The issue of reversibility or regression of cirrhosis is an evolving and controversial concept [21], which has become more prominent with the development of new treatments for chronic liver disease and even antifibrotic therapy. It will be of great interest to identify histological patterns in cirrhosis that are more likely to reverse and to evaluate whether clinical and/or hemodynamic improvements in cirrhotic patients correlate with changes from a more severe to a less severe histological pattern.
Follow-up studies need to be undertaken in a larger population to validate the proposed sub-classification of cirrhosis, particularly with regards to clinical outcome. Preliminary data in a separate patient population suggests that septal thickness in biopsies with cirrhosis predicts clinical decompensation [22] If confirmed, a modification of the staging system of biopsies with chronic liver disease could be proposed in which stage 4 (cirrhotic stage) could be further sub-classified by severity based on area of fibrosis/septal width and nodule size.
In conclusion, we have validated our previous results performed using a semiquantitative analysis of histological cirrhosis with a quantitative method using digital image analysis. The results indicate that fibrosis area is an important determinant of the degree of portal hypertension and that both fibrosis area and nodule size are important histological predictors of clinically significant portal hypertension and therefore predictive of the clinical severity of cirrhosis.
Acknowledgments
Grant Support/Funding: Clinical Core, Yale Liver Center NIH P30 DK34989
References
- 1.Groszmann RJ, Garcia-Tsao G, Bosch J, et al. Beta-blockers to prevent gastroesophageal varices in patients with cirrhosis. N Engl J Med. 2005;353:2254–2261. doi: 10.1056/NEJMoa044456. [DOI] [PubMed] [Google Scholar]
- 2.Ripoll C, Groszmann R, Garcia-Tsao G, et al. Hepatic venous pressure gradient predicts clinical decompensation in patients with compensated cirrhosis. Gastroenterology. 2007;133:481–488. doi: 10.1053/j.gastro.2007.05.024. [DOI] [PubMed] [Google Scholar]
- 3.Ripoll C, Groszmann RJ, Garcia-Tsao G, et al. Hepatic venous pressure gradient predicts development of hepatocellular carcinoma independently of severity of cirrhosis. J Hepatol. 2009;50:923–928. doi: 10.1016/j.jhep.2009.01.014. [DOI] [PMC free article] [PubMed] [Google Scholar]
- 4.D'Amico G, Garcia-Tsao G, Cales P, Escorsell A, Nevens F, Cestari R, Caletti G, Zoli M. Diagnosis of portal hypertension: how and when. In: DeFranchis R, editor. Portal Hypertension III; Proceedings of the Third Baveno International Consensus Workshop on Definitions, Methodology and Therapeutic Strategies; Oxford. Blackwell Science; 2001. pp. 36–64. [Google Scholar]
- 5.Nagula S, Jain D, Groszmann R, et al. Histological-hemodynamic correlation in cirrhosis-a histological classification of the severity of cirrhosis. J Hepatol. 2006;44:111–117. doi: 10.1016/j.jhep.2005.07.036. [DOI] [PubMed] [Google Scholar]
- 6.Bedossa P, Dargere D, Paradis V. Sampling variability of liver fibrosis in chronic hepatitis C. Hepatology. 2003;38:1449–1457. doi: 10.1016/j.hep.2003.09.022. [DOI] [PubMed] [Google Scholar]
- 7.Kage M, Shimamatu K, Nakashima E, et al. Long-term evolution of fibrosis from chronic hepatitis to cirrhosis in patients with hepatitis C: morphometric analysis of repeated biopsies. Hepatology. 1997;25:1028–1031. doi: 10.1002/hep.510250439. [DOI] [PubMed] [Google Scholar]
- 8.Caballero T, Perez-Milena A, Masseroli M, et al. Liver fibrosis assessment with semiquantitative indexes and image analysis quantification in sustained-responder and non-responder interferon-treated patients with chronic hepatitis C. J Hepatol. 2001;34:740–747. doi: 10.1016/s0168-8278(01)00006-x. [DOI] [PubMed] [Google Scholar]
- 9.Masseroli M, Caballero T, O'Valle F, et al. Automatic quantification of liver fibrosis: design and validation of a new image analysis method: comparison with semi-quantitative indexes of fibrosis. J Hepatol. 2000;32:453–464. doi: 10.1016/s0168-8278(00)80397-9. [DOI] [PubMed] [Google Scholar]
- 10.Groszmann RJ, Wongcharatrawee S. The hepatic venous pressure gradient: Anything worth doing should be done right. Hepatology. 2004;39:280–283. doi: 10.1002/hep.20062. [DOI] [PubMed] [Google Scholar]
- 11.Ripoll C, Groszmann R, Garcia-Tsao G, et al. Hepatic venous pressure gradient (HVPG) predicts the development of hepatocellular carcinoma (HCC) independent of duration and severity of cirrhosis. Hepatology. 2006 doi: 10.1016/j.jhep.2009.01.014. In press (abstract) [DOI] [PMC free article] [PubMed] [Google Scholar]
- 12.Garcia-Tsao G, Friedman S, Iredale J, et al. Now there are many (stages) where before there was one: In search of a pathophysiological classification of cirrhosis. Hepatology. 2010;51:1445–1449. doi: 10.1002/hep.23478. [DOI] [PMC free article] [PubMed] [Google Scholar]
- 13.Kumar M, Sakhuja P, Kumar A, et al. Histological subclassification of cirrhosis based on histological-haemodynamic correlation. Aliment Pharmacol Ther. 2008;27:771–779. doi: 10.1111/j.1365-2036.2008.03653.x. [DOI] [PubMed] [Google Scholar]
- 14.Calvaruso V, Burroughs AK, Standish R, et al. Computer-assisted image analysis of liver collagen: relationship to Ishak scoring and hepatic venous pressure gradient. Hepatology. 2009;49:1236–1244. doi: 10.1002/hep.22745. [DOI] [PubMed] [Google Scholar]
- 15.Serste T, Melot C, Francoz C, et al. Deleterious effects of beta-blockers on survival in patients with cirrhosis and refractory ascites. Hepatology. 2010;52:1017–1022. doi: 10.1002/hep.23775. [DOI] [PubMed] [Google Scholar]
- 16.Gluud LL, Langholz E, Krag A. Meta-analysis: isosorbide-mononitrate alone or with either beta-blockers or endoscopic therapy for the management of oesophageal varices. Aliment Pharmacol Ther. 2010;32:859–871. doi: 10.1111/j.1365-2036.2010.04418.x. [DOI] [PubMed] [Google Scholar]
- 17.Bhathal PS, Grossman HJ. Reduction of the increased portal vascular resistance of the isolated perfused cirrhotic rat liver by vasodilators. J Hepatol. 1985;1:325–337. doi: 10.1016/s0168-8278(85)80770-4. [DOI] [PubMed] [Google Scholar]
- 18.Vorobioff J, Bredfeldt JE, Grossman HJ. Increased blood flow through the portal system in cirrhotic rats. Gastroenterology. 1984;87:1120–1126. [PubMed] [Google Scholar]
- 19.Vizzutti F, Arena U, Romanelli RG. Liver stiffness measurement predicts severe portal hypertension in patients with HCV-related cirrhosis. Hepatology. 2007;45:1290–1297. doi: 10.1002/hep.21665. [DOI] [PubMed] [Google Scholar]
- 20.Picchiotti R, Mingazzini PL, Scucchi L, et al. Correlations between sinusoidal pressure and liver morphology in cirrhosis. J Hepatol. 1994;20:364–369. doi: 10.1016/s0168-8278(94)80009-x. [DOI] [PubMed] [Google Scholar]
- 21.Senzolo M, Nadal E, Cholongitas E, et al. Is hydrophobia necessary for the hepatologist prescribing nonselective beta-blockers in cirrhosis? Hepatology. 2011;10 doi: 10.1002/hep.24176. [DOI] [PubMed] [Google Scholar]
- 22.Sreenivasan P, Inayat I, Jain D, et al. Histological-clinical correlation in cirrhosis - Validation of a histological classification of the severity of cirrhosis. Hepatology. 2007;46(Suppl 1):579A. (abstract). Hepatology 2007, 46 (Suppl 1):579A (abstract) [Google Scholar]


