

Abstract
Dynamic Contrast Enhancement (DCE) MRI has been used to measure the kinetic transport constant, Ktrans, which is used to assess tumor angiogenesis and the effects of anti-angiogenic therapies. Standard DCE MRI methods must measure the pharmacokinetics of a contrast agent in the blood stream, known as the Arterial Input Function (AIF), which is then used as a reference for the pharmacokinetics of the agent in tumor tissue. However, the AIF is difficult to measure in pre-clinical tumor models and in patients. Moreover the AIF is dependent on the Fahraeus effect that causes a highly variable hematocrit (Hct) in tumor microvasculature, leading to erroneous estimates of Ktrans. To overcome these problems, we have developed the Reference Agent Model (RAM) for DCE MRI analyses, which determines the ratio of Ktrans values of two contrast agents that are simultaneously co-injected and detected during a single DCE-MRI scan session. The RAM obviates the need to monitor the AIF because one contrast agent effectively serves as an internal reference in the tumor tissue for the other agent, and it also eliminates the systematic errors in the estimated Ktrans caused by assuming an erroneous Hct. Simulations demonstrated that the RAM can accurately and precisely estimate the relative Ktrans (RKtrans) of two agents. To experimentally evaluate the utility of RAM for analyzing DCE MRI results, we optimized a previously reported multiecho 19F MRI method to detect two perfluorocarbon contrast agents that were co-injected during a single in vivo study and selectively detected in the same tumor location. The results demonstrated that RAM determined RKtrans with excellent accuracy and precision.
Keywords: Dynamic Contrast Enhanced MRI, Permeability, Reference Agent Model, Pharmacokinetics, 19F MRI, Perfluorocarbons, Linear Models
INTRODUCTION
Angiogenesis is critical for the sustained growth and metastasis of solid tumors, which negatively affects patient outcomes (1,2). Anti-angiogenic therapies are often cytostatic and do not decrease tumor volume, thus evaluations of vascular permeability are often required to assess early therapeutic response (3). Dynamic Contrast Enhanced MRI (DCE MRI) has been used to detect changes in vascular permeability, typically represented by the transfer constant Ktrans, by monitoring the rate of uptake and/or washout of a MRI contrast agent (CA) in the tumor tissue (4). The results from many DCE MRI studies have been correlated with microvessel densities (5), tumor grades (6), expression of VEGF (7), microarray gene expression analyses (8), tumor oxygenation (9), interstitial fluid pressure measurements (10), and biopsies (11).
Despite these promising results, DCE MRI has inherent limitations for quantitative pre-clinical and clinical cancer studies (12). For example, the concentration of a CA in blood plasma must be monitored to provide an Arterial Input Function (AIF) that is required to determine Ktrans using traditional DCE MRI analysis methods (13). Identifying a suitable artery or vein within the MR image can be challenging, particularly for DCE MRI studies of mouse models of human cancers. Motion artifacts and in-flow effects can compromise the quality of the AIF. Furthermore, MR images must be acquired at a rate ≤ 5 sec per image to accurately capture the AIF for accurate determinations of Ktrans (14,15).
An often overlooked limitation of DCE MRI is the inability to account for the exact value of the hematocrit in the tumor microvasculature. Most DCE MRI studies assume that the arterial hematocrit is 40%, which is an acceptable estimate for patients with cancer (16). Moreover, most studies assume that the hematocrit is a single value throughout the tumor and normal tissues. However, the hematocrit decreases as the vessel diameter decreases, so that the hematocrit in tumor microvasculature ranges between 20–80% of the hematocrit of a typical artery that is used for blood sampling (17). This physiological condition is known as the Fahraeus effect (18). The measurement of Ktrans is linearly and inversely dependent on the hematocrit, so that an erroneous overestimation of the microvascular hematocrit directly translates to an erroneous underestimation of Ktrans (19). Similar effects of an erroneous hematocrit on the underestimation of Ktrans have been reported, although these reports have been limited to the variability of large-vessel hematocrit between patients and have not addressed variability of capillary hematocrit in a single tumor (20,21). A low hematocrit may contribute to hypoxia that can stimulate angiogenesis, increase vascular permeability and lead to high values of Ktrans. Therefore, tumor regions with the highest Ktrans may have the most underestimated Ktrans values. This underestimation can be as great as 36%, which may partly explain why a 40% change in DCE MRI measurements is typically required to detect a statistically significant change in tumor angiogenesis in carefully controlled pre-clinical DCE MRI studies (22,23).
We propose a new model that addresses these limitations of DCE MRI. This new model, termed the Reference Agent Model (RAM), compares the pharmacokinetics of two CAs in the same tumor tissue, so that one agent may be used as a reference for the second agent. The RAM does not require measurement of the AIF. Because both CAs in the same tumor location must experience the same hematocrit, a ratiometric comparison of DCE MRI of both agents is independent of the hematocrit. More generally, a ratiometric approach has potential to cancel other characteristics of DCE MRI measurements that complicate the interpretation of the results. Therefore, this ratio of Ktrans, known as RKtrans, should accurately represent the relative permeabilities of the two CAs. The derivation of RAM is presented in this report, along with computer simulations that evaluated the sensitivity of RAM to signal-to-noise ratio, temporal resolution, and extreme values of Ktrans and the extracellular extravascular fractional volume (ve).
To implement RAM, two MRI contrast agents must be selectively detected during a single DCE MRI scan session in the same tumor region for ROI analyses, or within each pixel within the image of the tumor for pixel-wise analyses. Because two co-injected T1 and/or T2 CAs are difficult to selectively detect with MRI, we have developed 19F CAs and optimized 19F MRI methods to perform simultaneous 19F DCE MRI of two CAs in a mouse model of breast cancer. Our strategy is based on the 19F MRI multi-echo approach developed by Girardeau, et al., for the highly sensitive detection of a single 19F nanoemulsion in vivo (24,25). However, instead of detecting a single 19F CA, we investigated the co-injection of two different nanoemulsions and selective detection of each nanoemulsion in an interleaved fashion. The results of this 19F DCE MRI study were analyzed using the RAM.
THEORY
Derivation of the Model
Our derivation of the RAM uses the notation and symbolic conventions described by Tofts et al. (26). The RAM shares similarities with the Reference Region Model for DCE MRI, and therefore our derivation also uses the notation and symbolic conventions described by Yankeelov et al. (27). The differential equations [1] and [2] describe the pharmacokinetic behavior of two contrast agents (CA) within a voxel. In this equation, CbCA-1(t) and CtCA-1(t) are the concentrations of one CA (CA-1) at time t in the blood and the tissue of interest respectively; Ktrans,CA-1 is the transfer constant (min−1) between the blood and the Extravascular Extracellular Space (EES) of the tissue of interest (TOI) for CA-1; ve is the extravascular-extracellular fractional volume of TOI; and Hct is the hematocrit (fraction of blood volume occupied by red blood cells). A differential equation for the second contrast agent (CA-2) is analogous (Eq. [2]). To emphasize the role of the hematocrit in this derivation, we have elected to include Cb(t) and Hct in these differential equations rather than use Cp(t), which is a term that is more commonly used in derivations of DCE MRI theory. Yet Cp(t), Cb(t), and Hct are related through Eq. [3]. For this derivation, we assumed that both agents are detected within the same TOI, thus ve and Hct are the same for both agents.
| [1] |
| [2] |
| [3] |
The AIF can be eliminated from Eq. [1] by assuming that both agents show the same AIF, solving Eq. [2] for Cb(t)/(1−Hct) (Eq. [4]), and substituting Eq. [4] into Eq. [1], resulting in Eqs. [5a] and [5b].
| [4] |
| [5a] |
| [5b] |
Integrating both sides of Eq. [5b] and assuming that the initial concentrations of CA-1 and CA-2 are equal to zero yields the working equation for the RAM (Eq. [6]) where RKtrans is the relative Ktrans,CA-1 compared to Ktrans,CA-2, and kep,CA-1 is the rate constant (min−1) between the EES of the TOI and plasma for CA-1.
| [6a] |
| [6b] |
The RAM can be expressed in matrix form (Eqs. [7] and [8]). The elements of column two of vector the M in Eq. [8] can be approximated by numerical integration. Eq. [8] is a system of linear equations, which can be solved for the elements of vector b using linear algebra.
| [7] |
where
| [8] |
Interpretation of RKtrans
Equation [10] shows the most general definition of Ktrans, where P is the total permeability of the capillary wall (cm min−1); S is the surface area per unit mass of tissue (cm2 g−1); F is the flow rate of whole blood per unit mass of tissue (mL g−1 min−1), ρ is the density of tissue (g mL−1), and E is the extraction ratio, defined in Eq. [11] (6). This definition of Ktrans is reduced to simpler cases under very specific conditions. If the flux of the CA across the tumor endothelium has low permeability relative to flow, then Ktrans can be approximated by Eq. [13], known as the permeability-limited model of DCE MRI.
| [10] |
| [11] |
| [12] |
| [13] |
The CAs used in this study fulfill the conditions for the permeability-limited model (4). If two large CAs are simultaneously detected in the same TOI, their ratio of Ktrans values can be expressed as RKtrans (Eq. [14]), where PCA-1 and PCA-2 are the apparent permeabilities of the TOI for CA-1 and CA-2, respectively. Because both agents experience the same S and ρ, RKtrans is simply the relative permeability of the two contrast agents.
| [14] |
METHODS
Simulations
Computer simulations were used to study the effect of temporal resolution, a wide range pharmacokinetic constants, and statistical noise on the accuracy and precision of RAM to estimate RKtrans and kep,CA-1. First, the arterial input function for the 19F nanoemulsions used in this study was experimentally measured (for details, see the section below titled “Determination of the AIF using in vivo 19F DCE MRI”) and a biexponential equation was fit to these results (Eq. [15]).
| [15] |
Although this experimental measurement produced relative values of the distribution volumes of the AIF (A and B of Eq. [15]), converting these relative values to absolute volumes requires careful calibration of MR signals relative to known volumes, which is technically challenging. Therefore, we used previously reported values of A and B with our experimentally determined values of α and β to simulate the AIF from 0 to 30 min (28,29). The final values for each parameter were A=24.0 kg/L; α=16.54 min−1; B=5.5 kg/L; β=0.03935 min−1. Next, the temporal dependence of contrast agent concentrations, CtCA-1(t) and CtCA-2(t), were calculated using the standard Tofts model and the simulated AIF with Ktrans equal to 8.2×10⁻³ min−1 and 4.3×10⁻³ min−1 for CA-1 and CA-2, respectively (Eq. [16]) (26). These values assigned to Ktrans are characteristic for 19F nanoemulsions with diameters of 225 and 293 nm in animal models of solid tumors (30,31). The ve was set to 0.5 mL/mL for both agents, which has been reported previously for human tumors and animal models of breast cancer (32).
| [16] |
Two sources of systematic error were explored using the simulated data with no noise added. To test the effect of temporal resolution (Δt), the AIF, CtCA-1(t) and CtCA-2(t) were down-sampled from their initial Δt of one second to Δt=0.5, 2.0 and 4.0 minutes. The parameters RKtrans and kep,CA-1 were then estimated using the simulated data at each new Δt. To test the effect of extreme pharmacokinetic constants, RKtrans and kep,CA-1 were estimated from simulated data generated with Ktrans,CA-1 ranging from 0.001 to 0.150 min−1 in steps of 0.003 min−1 while fixing Ktrans,CA-2 at 4.3×10⁻³ min−1 and fixing ve at 0.5 mL/mL. In a similar analysis, ve was changed from 0.10 to 0.9 mL/mL in steps of 0.005 mL/mL while Ktrans,CA-1 and Ktrans,CA-2 were fixed at 8.2×10⁻³ and 4.3×10⁻³ min−1, respectively.
The combined effect of signal-to-noise ratio (SNR) and Δt on the accuracy and precision of RAM was studied by adding Gaussian noise to the CtCA-1(t) and CtCA-2(t) curves at Δt=0.5, 2.0 and 4.0 min to produce SNRs from 5 to 100. The SNR was defined as SNR=Smax/σ, where Smax represents the maximum signal of each curve and σ is the standard deviation of the noise (SD). This process was repeated 1000 times for each condition of SNR and Δt. The accuracy of parameter estimation was evaluated in terms of the mean percentage error (Eq. [17]), and the precision was evaluated using the standard deviation of the percentage error (Eq. [18]), where P̂ij is the estimated value of the jth data of the ith parameter, Pi is the true value of the ith parameter, and N is the number of data points (1000 for this study).
| [17] |
| [18] |
Experimental
Preparation of 19F nanoemulsions
A total of 14 mg of dipalmitoyphosphatidylcholine (DPPC), 5 mg of 1,2-dipalmitoyl-sn-glycero-3-phosphoethanolamine-N-[methoxy(polyethylene glycol)-2000] (16:0-PEG2000-PE) and 1 mg of 1,2-dipalmitoylphosphatidic acid (DPPA) were dissolved in 1 mL of chloroform. The organic solvent was evaporated in a rotary evaporator at 35°C to obtain a thin film, and solvent traces were removed by maintaining the lipid film under a vacuum overnight. The film was hydrated with 1.0 mL of PBS buffer using a sonicator (Branson 510, CT, USA) at a 250 W intensity at room temperature for 10 min. This mixture was subjected to 10 freeze-thaw cycles using a liquid nitrogen bath at −196°C and a water bath at 60°C. Next, perfluorinated-15-crown-ether (PCE) or perfluorooctane (PFO) was added at 40% v/v to the system, followed by 20 manual extrusions at 60°C through a 100 nm filter (Avanti Lipids, Alabama, USA). Samples of the resulting emulsions were diluted to 1% v/v in HEPES buffer to measure their particle sizes using dynamic light scattering (Zetasizer Nano, Malvern, Worcestershire, UK).
Correlation of 19F MR signal and 19F concentration
Phantoms of PCE nanoemulsions that ranged in 0.40 to 25.0 M 19F concentration were prepared by serial dilution. Phantoms of PFO nanoemulsions with the same 19F concentration were also prepared. All MR experiments were performed using a 7T Biospec scanner with a 30 cm bore from Bruker Biospin, Inc. (Ettlingen, Germany) equipped with a double-tuned 1H/19F linear birdcage coil with a 3.2 cm diameter from M2M Imaging, Inc. (Cleveland, OH). The temperature was maintained at 37°C for all MRI studies using an automated system (SA Instruments, Inc.). A series of spin echo MR images of these phantoms were acquired using the following parameters: TR=4000 msec; TE=8.0 msec; NEX=2, excitation pulse=90°; FOV=3.5 cm2; matrix=64×64; slice thickness=4.0 mm; number of slices=1. The MR signal for each concentration of fluorine was fitted to the linear model (Eq. [19]) where Sig is the MRI signal in arbitrary units, [19F] is the 19F concentration in Molar, m is the slope and b is the y-intercept.
| [19] |
Measurement of T1 relaxation time
The T1 relaxation times of PCE and PFO were measured by acquiring a series of spin-echo MR images with variable TR using the following parameters: TR=150, 300, 600, 900, 1500, 2500, 4000, and 8000 msec; TE=8.01 msec; NEX=4; RARE factor=2; slice thickness=1.0 mm; matrix=64×64; and FOV=3.0 cm2. The average signal for a region of interest of the sample was fitted to Eq. [20], where α is the flip angle and A is a constant that includes the proton density and scanner gain. We assumed that that TE ≪ T2*.
| [20a] |
| [20b] |
Evaluation of effects of J-modulation and T2 relaxation time
Inspired by the previous reports by Giraudeau, et al., we investigated the dependence of the T2 relaxation of PCE and PFO on TE following selective excitation (24,25). A multi spin-echo MRI protocol was used with the following parameters for both agents: TR= 5000 msec; TE/number of echos =15/60, 20/60, 25/60, 30/50, 40/37, 50/30, 60/25, 80/18 msec; NEX=4; excitation pulse=90°; FOV=3.0; matrix=64×64; slice thickness=1.0 mm; number of slices=1. To preserve good SNR, only a maximum of 60 echoes and a maximum effective echo time (TE multiplied by the number of echos) of 1500 msec were used. The r2 goodness of fit coefficient was ≥ 0.95 for all fittings of the average signal to an exponential function to determine T2 relaxation times (Eq. [21]). This multi-echo approach has proven to be very sensitive for in vivo detection of a single 19F nanoemulsion, but has not been used after selective excitation nor for the detection of more than one contrast agent.
| [21] |
Selective detection of two 19F nanoemulsions
Spin-echo MR images were obtained using phantoms consisting of 100% PCE, 100% PFO, and a 50:50 mixture of PFO and PCE (v/v). These images were acquired with the same geometry and parameters used to measure T2 relaxation times, with TE=15 msec. The bandwidth of the 90° excitation pulse was varied between 1,000 and 10,000 Hz. The frequency of the excitation pulse was set to the frequency of PCE, and the bandwidth that maximized the SNR of PCE while limiting SNR ≤ 5.0 for PFO was considered to be selective for PCE. The same procedure was used to determine the bandwidth that was selective for PFO. The bandwidth of the 180° refocusing pulse remained constant at 1000 Hz during these studies.
Animal model and general procedure for in vivo MRI studies
Five female SCID mice weighting approximately 21 g were housed and maintained under specific pathogen-free conditions in accordance with the guidelines of the American Association for Laboratory Animal Care. All experiments met the current regulations and standards of the U.S. Department of Agriculture, the U.S. Department of Health and Human Services, the National Institutes of Health, and the University of Arizona Animal Care Facility. All mice were injected subcutaneously in the right flank with 106 MDA-MB-231 cells in 0.1 mL of saline. The tumor was measured every 2 to 3 days using electronic calipers and allowed to grow for 22–26 days to an average volume of 250 mm3 before initiating 19F MRI studies. Mice were scanned 22–26 days after tumor implantation.
Before the MRI scan, a mouse were anesthetized with 1.5–2% isoflurane in O2 carrier gas, a 27 G catheter was inserted in the tail vein and physiological monitoring leads were connected to monitor respiration rate and core body temperature during the MRI session. Each mouse was kept at 37.0 ± 0.2°C during the MRI studies using warmed air that is controlled by an automated temperature-feedback system (SA Instruments, New York, USA). Anatomical positioning was performed prior to injecting the emulsions by acquiring T1-weighted 1H images with the following parameters: TR=250 msec; TE=5.0; NEX=1; excitation pulse=90°; FOV= 35 mm2; matrix=128×128; slice thickness=1 mm; number of contiguous slices=11. Each image set was acquired in 32 seconds.
Determination of the AIF using in vivo 19F DCE MRI
Four mice with a subcutaneous MDA-MB-231 tumor were used to obtain an AIF of a PCE nanoemulsion. A vial with 100 mL of a 40% v/v nanoemulsion of PCE was placed next to the mouse as fiducial marker. A series of dynamic 19F MR images were acquired using a Spoiled Gradient-echo MRI protocol with the following parameters: TR=150 msec; TE=2.5 msec; NEX=8; excitation pulse=33.3°; FOV= 35 mm2; matrix= 64×64; slice thickness= 4.0 mm; number of contiguous slices=3. The location of the three 19F image slices was matched to the location of the eleven 1H image slices that were used for anatomical referencing. Each image set was acquired in 1.28 min, and a series of 25 image sets were acquired for a total acquisition time of 32 min. After the first image set was acquired, 150 μL of a 40% v/v nanoemulsion of PCE were injected manually through a tail vein catheter over 20 seconds. The increase in 19F MR signal was monitored in a 2×2 voxel region that represented a tail vein. Results from the four mice were averaged, and the average signal-intensity curve was fitted with a bi-exponential model (Eq. [16]) using Matlab (Mathworks Inc., Natick MA).
Selective Detection of two agents during in vivo 19F DCE MRI
One mouse with a subcutaneous MDA-MB-231 tumor was used to test the selective in vivo detection of PCE and PFO. Two vials each containing 100 μL of a 40% v/v nanoemulsion of PCE and PFO were placed next to the mouse to serve as internal controls. The selective imaging of each CA was achieved by setting the transmitter to the MR frequency of PCE or PFO, while using a pulse bandwidth of 2700 Hz for both excitation and refocusing. This imaging scheme was repeated 18 times using a multi-echo MRI protocol and the following parameters: TR=3000 msec; TE= 25 msec; number of echoes=20; NEX=2; excitation pulse=90°, refocusing pulse=180°, FOV=35 mm2; matrix=64×64, slice thickness=4.0 mm; number of contiguous slices=3. The location of the three 19F image slices was matched to the location of the eleven 1H image slices obtained for anatomical referencing. Each image set was acquired in 3.2 min, and the selective excitation of PCE and PFO was iterated, so that the effective temporal resolution for each nanoemulsion was 6.4 min. A total acquisition time of 57.6 minutes was required to obtain 18 images. Mid-way through the acquisition of the second time point (i.e., the first selective excitation of PFO), 200 μL of a mixture of the emulsions consisting of 3.5 mM of PCE and 4.6 mM of PFO were manually co-injected through a tail vein catheter during 45 seconds. After the data acquisition was finished, all of the echoes were summed for each slice at each time point. Summing the echoes formed a 19F DCE MRI dataset with an increasing SNR as previously reported (24,25). All data were processed using customized Matlab functions. The echoes for each slice at each time point were summed, then an ROI for analysis was determined, and a bioexponetial function (Eq. [15]) was fit to the signal as function of time to obtain a smoothed curve for each nanoemulsion. Finally the RAM (Eq. [9]) was fit to the smoothed curves to estimate RKtrans.
RESULTS
Simulations
The concentration-time curves of two nanoemulsions in tumor tissue were simulated to assess the systematic and random errors when estimating RKtrans using RAM (Fig. 1). These simulations were constructed using Ktrans values that have been previously reported for other nanoemulsions in similar tumor models (30,31). Unfortunately, these previous studies did not report the characteristics of the AIF of these nanoemulsions. Therefore, we experimentally measured the exponential decay rates of the biexponential AIF of PCE in four mice (α and β of Eq. [15]). Experimentally measuring the distribution volumes of the AIF (A and B of Eq. [15]), requires careful calibration of MR signals relative to known volumes, which is technically challenging. Therefore, we relied on previously reported values of A and B, and our experimentally determined values of α and β, to construct the AIF for this simulation (30,31).
Fig. 1.

The simulated concentration-activity curves of the tumor for RAM. The pharmacokinetics of each contrast agent in the tumor were simulated using intervals of 1 sec and setting Ktrans equal to 8.2×10⁻³ min−1 and 4.3×10⁻³ min−1 for CA-1 and CA-2, respectively. The AIF used for this simulation was based on Eq. [16] using experimental measurements of exponential decay rates (a=16.54 min−1, β=−0.040 min−1), and reported values for the distribution volumes (A= 24.0 kgL−1, B=5.5 kgL−1) (26,27). The EES fractional volume (ve) was set to 0.5 mL/mL for both curves (28).
The accuracy of estimating RKtrans from the RAM was determined by measuring the systematic error between RKtrans used to construct the simulated data and the value calculated by the RAM. This systematic error was dependent on the temporal resolution of the DCE MRI acquisition protocol (Fig. 2A). The systematic error was greatest for slow temporal resolutions when RKtrans was large, which suggests that the rapid pharmacokinetics of one agent cannot be adequately compared with the slower pharmacokinetics of the other agent when temporal resolution is slow. Yet when the pharmacokinetics of both agents was comparable, creating a small to moderate value of RKtrans, then a slow temporal resolution accurately estimated RKtrans with a systematic error of less than 1%. The systematic error in estimating RKtrans also depended on ve, but this error was less than 1% for all values of ve for the range of ve that was evaluated (Fig. 2B).
Fig. 2.

Systematic errors as a function of temporal resolution. To estimate systematic errors in estimated RKtrans, A) activity curves were simulated with Ktrans,CA-1 ranging from 0.001 to 0.150 min−1 in steps of 0.003 min−1 while fixing Ktrans,CA-2 at 4.3×10⁻³ min−1 and ve at 0.5 mL/mL, or B) activity curves were simulated with ve ranging from 0.10 to 0.9 mL/mL in steps of 0.005 mL/mL while fixing Ktrans,CA-1 and Ktrans,CA-2 at 8.2×10⁻³ and 4.3×10⁻³ min−1, respectively. These curves were down-sampled to 0.5, 2, and 4 min temporal resolutions. C, D) The same procedure was used to estimate systematic errors in estimated kep,CA-1.
For comparison, a slow temporal resolution caused a greater systematic error in kep,CA-1 for all values of RKtrans (Fig. 2C). A low value of ve also caused a greater systematic error in kep,CA-1 (Fig. 2D). Furthermore, the systematic error in estimating kep,CA-1 was > 1% for all cases except the fastest temporal resolution, the lowest values of RKtrans, and the highest values of ve. These results demonstrated that the effects of a slow temporal resolution can be canceled or reduced by estimating the ratiometric parameter RKtrans relative to determining the absolute parameter kep,CA-1.
Analyses of the accuracy and precision of RKtrans measurements were performed by adding Gaussian noise to the simulated concentration-time curves, then using RAM to estimate RKtrans, and then repeating this process for 1000 iterations. The systematic error represented the level of accuracy, and the standard deviation of these 1000 random errors represented the level of precision (Fig. 3A). The accuracy was within 2% with high SNR greater than 30:1, and within 10% with moderate SNR greater than 15:1 for all temporal resolutions. The precision was within 3.6% with high SNR greater than 30:1 at all temporal resolutions that were tested, and within 3.6% with moderate SNR greater than 15:1 for 0.5 and 2 minute temporal resolutions. Therefore, the RAM can accurately and precisely determine RKtrans under conditions of moderate or high SNR. For comparison, the accuracy and precision of estimating kep,CA-1 were highly dependent on SNR (Fig. 3B). These errors in kep,CA-1 were an order of magnitude greater than the errors in RKtrans, as shown by comparing the scales of the y-axes of Figures 3A and 3B. These results demonstrated that the ratiometric parameter RKtrans has advantages relative to the absolute parameter kep,CA-1.
Fig. 3.
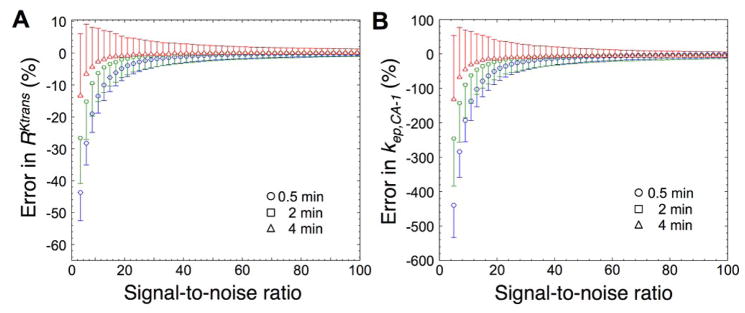
Random errors as a function of signal-to-noise ratio and temporal resolution. Simulated activity curves were down-sampled to 0.5, 2, and 4 min temporal resolutions. Gaussian noise was added to produce SNRs from 5 to 100 for 1000 data sets. A) The accuracies of estimating RKtrans are shown by the data symbols, and the precisions of the RKtrans estimates are shown by the error bars that represent the standard deviation of 1000 trials. B) The accuracies and precisions of estimating kep,CA-1 are also shown, with a y-axis that spans a range that is approximately 10-fold greater than the range of the y-axis in Figure 3A to highlight the greater error in estimating kep,CA-1.
Experimental Results
The PCE and PFO nanoemulsions were synthesized using commercially available reagents and standard procedures. As expected, PCE showed a single MR frequency from 20 magnetically equivalent 19F nuclei (Fig. 4A). PFO generated a MR frequency that was 7.58 ppm downfield from the frequency of PCE (2275 Hz at 300 MHz magnetic field strength), which was assigned to the two magnetically equivalent fluoromethyl groups. Due to differences in weight density and fluorine density of the perfluorcarbons, the integral of the PCE signal was 2.22 times higher compared to the fluoromethyl signal of PFO. PFO also showed three MR frequencies at −30.11, −32.3, and −39.5 ppm upfield from the frequency of PCE (9033, 9600, and 10112 Hz), which were assigned to the fluoromethylene groups. The large chemical shift of these fluoromethylene groups provided the opportunity to selectively detect the MR frequency of PCE and the fluoromethyl group of PFO using excitation bandwidths that were much smaller than 9033 Hz, so that the signals from the fluoromethylene groups could be neglected. Therefore, we refer to the fluoromethyl group of PFO in the emulsion as “PFO” for the remainder of this report.
Fig. 4.

19F MR signals. A) A MR spectrum shows a single resonance for PCE and a single resonance for the fluoromethyl group of PFO. The fluoromethylene groups of PFO have multiple resonances, but these resonances can be neglected when PCE and the fluoromethyl group of PFO are selectively detected. B) The MR imaging signal from PCE was linearly related to 19F concentration of the sample. A spin-echo MRI protocol was used at 37°C. Error bars represent the standard deviation of signal values from pixels of the image of each phantom. C) MR images of phantoms consisting of 100% PCE, 100% PFO, and a 50:50 v/v mixture of PFO and PCE were acquired with selective detections of PCE and PFO, and with no selective detection.
The 19F MRI signal of PCE was found to be linearly correlated with the 19F concentration of the PCE nanoemulsion within the tested range of 0.4 to 12.5 M (Fig. 4B). The average standard deviation of 19F signals from pixels of the image of each phantom was equivalent to 0.10 M based on the signal-concentration calibration. This standard deviation had a range of 0.05 to 0.20 M for all samples, which indicated that this standard deviation was independent of concentration and therefore represented the scanner noise that was independent of the sample. Therefore, a minimum of 0.60 M of 19F nuclei were required to generate a signal with SNR greater than 1 using our MRI scanner and 1H/19F transceiver coil. This minimum detection limit equated to a concentration of 0.030 M for the PCE emulsion and .033 M for the PFO emulsion, based on the number of detected 19F nuclei (20 for PCE and 6 for PFO) and average concentration per nanoemulsion particle (61 M for PCE and 71 M for PFO). Although these results established our minimum detection limits, the detection limit for biomedical studies is higher due to biological noise (e.g., motion artifacts).
The estimated T1 relaxation rate for PCE was 1.031 sec. (with a 95% confidence interval, 95CI, between 0.98 sec. and 1.08 sec.), and the T1 time of PFO was estimated to be 1.15 sec. (95CI between 1.09 sec. and 1.21 sec.). These relaxation times are significantly different at the 95% confidence level, but this difference leads nly to a 3% difference in signal under the conditions of our in vivo studies if both agents exhibity the same spin density.
The selective detection of PCE and PFO nanoemulsions was conducted by optimizing the bandwidth of the 90° excitation pulse while acquiring spin-echo MR images of phantoms (Fig. 4C). A bandwidth of 2700 Hz was found to produce the best SNR for one agent while limiting the SNR of the other agent to less than 5. This design criterion of reducing SNR below 5 for the other agent matched the CNR criterion for statistical significance during our biological studies of the AIF as discussed below. Therefore, a 2700 Hz bandwidth was used for selective detection of each agent during subsequent studies. The bandwidth of the 180° refocusing pulse was found to be inconsequential for selective detection, provided that the excitation pulse was optimized for selective detection. Yet the bandwidth used for the refocusing pulse in subsequent studies was also set to 2700 Hz for consistency.
To optimize detection sensitivity, we also investigated the T2 relaxation times of PCE and PFO (Fig. 5). PCE exhibited a T2 relaxation time of 650 msec in a solution of HEPES buffer. For PFO, the measurement of T2 relaxation time was discovered to be dependent on the echo time (TE) of the spin-echo imaging protocol. This effect was attributed to J-coupling between the methyl and methylene groups of PFO (24,25). Because the refocusing pulse of the spin-echo protocol was selective for the methyl group, the spin states of the methylene groups were not inverted and therefore the J-coupling was not refocused (data not shown). Longer TE times caused greater J-coupling evolution, leading to greater signal loss. To mitigate this problem, a TE time of 25 msec was used for subsequent studies, which provided equal T2 relaxation times for both PFO and PCE. The ability to ‘tune’ the effective T2 relaxation time of PFO to match PCE removed the complication of different relaxation times from subsequent analyses. Subsequent studies with a TE time of 25 msec acquired and summed 20 spin-echo images that had excellent signal-to-noise. More specifically, the twentieth image had approximately 50% of the signal-to-noise relative to the first image, based on a T2 relaxation time of 650 msec. This multiecho sequence was also used to measure the in vivo T2 relaxation time of PCE and PFO, which were 645 msec (95CI between 580 and 715 msec) and 648 msec (95CI between 596 and 719 msec), respectively. The overlapping confidence intervals indicated that the estimated values are not significantly different at the 95% confidence level.
Fig. 5.

The effect of J-modulation on T2 relaxation of the 19F nanoemulsions. The effective echo time is equal to the number of echoes multiplied by TE. A) The T2 relaxation of the 19F MRI signal of PCE is not affected by TE. B) The T2 relaxation of the 19F MRI signal of PFO is affected by TE due to J-modulation caused by the fluoromethylene groups. C) PCE and PFO have equal T2 values when TE equals 25 msec.
To support the simulations, the AIF of PCE was measured in four mice (Fig. 6). A 2×2 voxel region was identified in the tail that showed strong 19F MRI signal, which was assumed to represent a tail vein (Fig. 6C). As expected, the 19F MRI signal quickly peaked soon after injection, followed by a rapid decrease during the first few minutes and a slow decrease throughout the remainder of the 32-minute scan session (Fig. 6A). The 19F MRI signal was averaged at each time point for the four mice and a biexponential function was fit to teh results, resulting in values of A=6.11×10¹⁸ (95CI between −3.19×1027 and 3.19×1027) and α=−16.54 (95CI between −2.72×10⁸ and 2.72 x10⁸) for the first exponential term, and B=9.96×10⁴ (95CI between 8.43×10⁴ and 1.15×10⁵) and β=−0.039 (95CI between −0.049 and −0.029) for the second exponential term. Although the first exponential term was fit poorly due to poor temporal resolution relative to rapid signal changes, the inclusion of the first exponential term was warranted to produce a good fit to the second exponential term. This analysis was also conducted with the temporal change in 19F MRI SNR (Fig. 6B), which was almost identical to the temporal dependence of 19F MRI signal because the noise level was 1.0 relative to our scale for MRI signals.
Fig. 6.

The experimental AIF of PCE. Four mice with subcutaneous MDA-MB-231 tumors were injected with 150 μL of a 40% v/v nanoemulsion of PCE. A) The average 19F MRI signal and B) the average 19F MRI SNR was monitored in C) a 2×2 voxel region in the tail that represented a tail vein (highlighted in green). The noise level was 1.0 relative to the MRI signal scale that was used for this analysis, so that the signal and SNR were identical at each time point. Error bars represent the standard deviation of the measurements of four mice. The signal activity curve shown as a solid red line was fitted with a biexponential model (Eq. [15]).
Three mice with a subcutaneous MDA-MB-231 tumor were used to perform in vivo 19F DCE MRI and analysis with RAM. A total of 18 multi-echo images were acquired by iterating the selective detection of PCE and PFO, which produced 9 images of each nanoemulsion that were unshuffled to show the temporal dependence of the 19F MRI signals from each nanoemulsion (Fig. 7). The mixture of the nanoemulsions was injected during the acquisition of the second image, so that the first two images showed no significant 19F MR signal. Subsequent images showed a consistently increasing 19F MRI signal in a region of the tumor (Fig. 7A, 7B). These 19F MRI signals in the tumor were converted to 19F concentrations (Fig. 4B). The RAM was used to estimate a value of RKtrans of 1.16 min−1/min−1 (95CI between 1.01 and 1.27), which is equal to Ktrans of PCE divided by Ktrans of PFO (Fig. 7C). A value of RKtrans of ~1 was expected because the relative diameters of the PCE and PFO nanoemulsions are the same. The root mean square error of the RAM fitting was 2.7×10⁻² mM, which was a ~1% error relative to the magnitudes of the 19F concentrations that were measured. This small error provided assurance that RKtrans was determined with outstanding precision using RAM. In addition, kep,CA-1 was estimated to be 9.1×10⁻³ min−1 (95CI between 8.6×10⁻³ min−1 and 10.1×10⁻³ min−1), which was in the range of expected kep values for nanoemulsions. Therefore, the in vivo 19F DCE MRI results demonstrated that RKtrans can be measured with RAM.
Fig. 7.

Selective detection of two 19F nanoemulsions during an in vivo MRI study. A) The 19F DCE MRI results of a mouse model with a MDA-MB-231 tumor after co-injection of PCE and PFO showed accumulation of each agent in the tumor tissue. B) A 1H MR image provides an anatomical reference for the 19F MRI results, which demonstrates that a region of the tumor showed substantial 19F MR signal. C) The 19F concentrations of PCE and PFO show a similar temporal dependence in tumor tissue. Based on the dynamic changes in concentration of PCE and PFO in tumor tissue, the RKtrans of the tumor tissue was determined to be 1.16 min−1, kep,CA-1 was 9.1×10⁻³ min−1, and the root mean square error of the fitting was 2.7×10⁻²mM.
For comparison, the MR images of the phantoms of PCE and PFO that were placed next to the mouse showed no changes in SNR during the 19F DCE MRI scan session (data not shown). This validated that 19F signal changes in the tumor were attributed to dynamic changes in the tumor concentration of the nanoemulsions, and were not attributed to potential changes in experimental conditions. Notably, 19F MRI signal was also detected in the center of the abdominal region of the mouse, which indicated that the nanoemulsions accumulated in other areas of the body. The 19F MRI signal was not detected in the bladder, which indicated that the large diameters of the nanoemulsions prevented excretion through the kidneys within the rime frame of our DCE MRI studies. This result was expected, as 19F nanoemulsions are typically cleared from the body through the liver or lungs.
DISCUSSION
The analysis of systematic and random errors using simulated results showed that RAM can estimate accurate and precise results for RKtrans. Yet RAM was shown to be unable to produce the same level of level of accuracy and precision when estimating kep,CA-1. This indicates that RAM is well-suited for determining the ratiometric parameter RKtrans but is not suited for determining an absolute parameter such as kep,CA-1. Furthermore, RAM was relatively insensitive to the effects of temporal resolution and SNR, which may provide technical advantages during pre-clinical and clinical DCE MRI acquisition protocols.
The average standard deviation of 19F SNR for each time point was 5.2 (Fig. 6B), which was greater than the average standard deviation of SNR measured with phantoms (Fig. 4). This indicated that biological noise contributed to the variability in 19F MRI signal. Yet a SNR > 5 observed during and after the initial signal peak was equivalent to a contrast-to-noise ratio (CNR) > 3√2 (CNR can be considered to be the difference in experimental SNR relative to a baseline SNR of 1.0). A CNR greater than 3√2 has a >99% probability of being real, which demonstrates that the 19F signals used to generate the AIF for PCE can be assigned to the dynamic changes of the PCE nanoemulsion in the tail vein, even in the presence of the biological noise (33).
The non-linear Reference Region Model (RRM) has been proposed as an alternative method for analyzing DCE MRI results (27,34). The RRM measures the presence of a single MRI contrast agent in two tissues (typically tumor and muscle), and therefore has similarities to the RAM that measures the presence of two MRI contrast agent in a single tissue. Both RAM and RRM have the advantage of canceling effects that may complicate DCE MRI analyses by using a ratiometric approach. For example, both RAM and RRM avoid the need for an AIF. RAM avoids the effect of the hematocrit by comparing results from two MRI contrast agents that inherently experience the same hematocrit. For comparison, the RRM cannot address the problem of the hematocrit, because the hematocrit in tumor and muscle tissues may be unequal, may have different inequalities for different tumor types, and may have different inequalities throughout the notoriously heterogeneous composition of a single tumor. Therefore, RAM has advantages relative to RRM for DCE MRI analyses.
RKtrans can be most easily applied to permeability-limited conditions of DCE MRI studies, which typically occur with MRI contrast agents that have diameters greater than ~3 nm (4). Under these conditions, RKtrans reduces to a simple ratio of vascular permeability for each contrast agent (Eq. [14]). Importantly, the effects of vessel surface area and tissue density are canceled using this ratiometric approach under permeability-limited conditions, which further improves the physiological interpretation of the results. The traditional DCE MRI evaluations of Ktrans, and the improved evaluations with RRM, cannot cancel the effects of vessel surface area and tissue density from the analyses.
This study used two 19F nanoemulsions that were intentionally designed to have the same average diameter, so that RKtrans is expected to have a value of ~1. The experimentally measured value of RKtrans was 1.16 min−1/min−1 (95CI between 1.01 and 1.27), which matched this expectation. In future studies, contrast agents with different average diameters should be tested to experimentally investigate the range of RKtrans that can be reliably measured, which can be compared with the simulated results in this report. Furthermore, DCE MRI has been used to measure relative differences in vascular permeabilities to assess differences in angiogenesis between tumors and longitudinal changes in a single tumor caused by anti-angiogenic chemotherapies (13). To assess these relative differences and changes in angiogenesis, the value of RKtrans should change from ~1. Therefore the relative diameters of the two contrast agents should be different for these biomedical applications to measure a change in vascular permeability.
Other DCE MRI methods have used two relaxivity-based MRI contrast agents that were sequentially administered to a single animal, with a delay of minutes, hours, or days between injections of each agent. Yet changes in the hematocrit within tumor vascular physiology may occur between sequential injections, which will compromise a ratiometric comparison of the agents. Furthermore, rapid fluctuations in the hematocrit likely occur at the microscopic scale, which requires two agents to be simultaneously present to experience the same hematocrit in the same location in a tumor microvasculature (35). Therefore, DCE MRI results with sequential injections of contrast agents are inappropriate for analyses with the RAM. For comparison, the simultaneous injection and selective detection of two contrast agents is appropriate for the RAM, which we accomplished in this study by using two 19F MRI contrast agents.
To our knowledge, our report demonstrates the first example of two 19F MRI contrast agents that were selectively detected after co-injection during an in vivo study. Optimizing the selective excitation was critical for this demonstration. Attempts to implement selective detection after nonselective or selective excitation resulted in lower SNR, and therefore were not implemented in the final method. Optimizing a multi-echo detection method while considering the effects of J-modulation and T2 relaxation were also critical for optimizing the SNR of images for each agent. For comparison, MR spectroscopic methods have been used to simultaneously detect two 19F contrast agents in the same mouse, but not in the same tissue location (36,37).
The wide range of 19F chemical shifts facilitated the selective detection of the two agents in this study. Similarly, the selective detection of two co-injected agents has also been accomplished using Chemical Exchange Saturation Transfer (CEST) MRI (38), which exploited a wide ~70 ppm range of 1H chemical shifts generated by paramagnetic lanthanide chelates to selectively detect each agent. These CEST MRI studies used two polymer-based agents that had different average diameters, which showed different pharmacokinetic rates in tumor tissue. The RAM is ideally suited to quantitatively analyze DCE-CEST MRI results with two selectively detectable CEST agents.
The selective detection of two MRI contrast agents at the same time and same location has important implications for molecular imaging. As an analogy, selective detection of optical imaging contrast agents at different color wavelengths has revolutionized molecular evaluations during biochemical tests, in vitro studies, and ex vivo analyses. However, optical imaging during in vivo studies is limited due to its limited spatial resolution and inability to interrogate deeper tissues. The selective detection of two or more MRI contrast agents such as the two 19F nanoemulsions detected in this DCE MRI study, and quantitative analysis of two agents with models such as the RAM presented in this study, has strong potential to impact in vivo molecular imaging.
CONCLUSIONS
In conclusion, the RAM can accurately and precisely estimate relative vascular permeabilities of two contrast agents in a tumor. This model provides multiple advantages relative to traditional analyses of DCE MRI and advanced analysis of DCE MRI with the RRM. This study also demonstrated that two perfluorinated MRI contrast agents can be selectively detected in tumor tissue during a single DCE MRI scan session.
Footnotes
Publisher's Disclaimer: This is a PDF file of an unedited manuscript that has been accepted for publication. As a service to our customers we are providing this early version of the manuscript. The manuscript will undergo copyediting, typesetting, and review of the resulting proof before it is published in its final citable form. Please note that during the production process errors may be discovered which could affect the content, and all legal disclaimers that apply to the journal pertain.
References
- 1.Folkman J. Tumor angiogenesis: therapeutic implications. N Engl J Med. 1971;285:1182–1186. doi: 10.1056/NEJM197111182852108. [DOI] [PubMed] [Google Scholar]
- 2.Folkman J, Watson K, Ingber D, Hanahan D. Induction of angiogenesis during the transition from hyperplasia to neoplasia. Nature. 1989;339:58–61. doi: 10.1038/339058a0. [DOI] [PubMed] [Google Scholar]
- 3.Kaban K, Herbst RS. Angiogenesis as a target for cancer therapy. Hematol Oncol Clin North Am. 2002;16:1125–1171. doi: 10.1016/s0889-8588(02)00047-3. [DOI] [PubMed] [Google Scholar]
- 4.Taylor JS, Tofts PS, Port R, Evelhoch JL, Knopp M, Reddick WE, Runge VM, Mayr N. MR imaging of tumor microcirculation: promise for the new millennium. J Magn Reson Imaging. 1999;10(6):903–907. doi: 10.1002/(sici)1522-2586(199912)10:6<903::aid-jmri1>3.0.co;2-a. [DOI] [PubMed] [Google Scholar]
- 5.Gillies R, Zafrani B, Guinebretiere JM, Meunier M, Lucidarme O, Tardivon AA, Rochard F, Vanel D, Neuenschwander S, Arriagada R. Ductal carcinoma in situ: MR imaging-histopathologic correlation. Radiology. 1995;196:415–419. doi: 10.1148/radiology.196.2.7617854. [DOI] [PubMed] [Google Scholar]
- 6.Daldrup H, Shames DM, Wendland M, Okuhata Y, Link TM, Rosenau W, Lu Y, Brasch RC. Correlation of dynamic contrast-enhanced MR imaging with histologic tumor grade: comparison of macromolecular and small molecular contrast media. Am J Roentgenol. 1998;171:941–949. doi: 10.2214/ajr.171.4.9762973. [DOI] [PubMed] [Google Scholar]
- 7.Jordan BF, Runquist M, Raghunand N, Gillies RJ, Tate WR, Powis G, Baker AF. The Thioredoxin-1 Inhibitor 1-Methylpropyl 2-Imidazolyl Disulfide (PX-12) Decreases Vascular Permeability in Tumor Xenografts Monitored by Dynamic Contrast Enhanced Magnetic Resonance Imaging. Clin Cancer Res. 2005;11:529–36. [PubMed] [Google Scholar]
- 8.Costouros NG, Lorang D, Zhang Y, Miller MS, Diehn FE, Hewitt SM, Knopp MV, Li KCP, Choyke PL, Alexander HR, Libutti SK. Microarray gene expression analysis of murine tumor heterogeneity defined by dynamic contrast-enhanced MRI. Molec Imaging. 2002;1(3):301–308. doi: 10.1162/15353500200202124. [DOI] [PubMed] [Google Scholar]
- 9.Cooper RA, Carrington BM, Loncaster JA, Todd SM, Davidson SE, Logue JP, Luthra AD, Jones AP, Stratford I, Hunter RD, West CM. Tumour oxygenation levels correlate with dynamic contrast-enhanced magnetic resonance imaging parameters in carcinoma of the cervix. Radiother Oncology. 2000;57(1):53–59. doi: 10.1016/s0167-8140(00)00259-0. [DOI] [PubMed] [Google Scholar]
- 10.Haider MA, Sitartchouk I, Roberts TPL, Fyles A, Hashmi AT, Milosevic M. Correlations between dynamic contrast-enhanced magnetic resonance imaging-derived measures of tumor microvasculature and interstitial fluid pressure in patients with cervical cancer. J Magn Reson Imaging. 2007;25(1):153–159. doi: 10.1002/jmri.20795. [DOI] [PubMed] [Google Scholar]
- 11.Tunca F, Giles Y, Salmaslioglu A, Poyanli A, Yilmazbayhan D, Terzioglu T, Tezelman S. The preoperative exclusion of thyroid carcinoma in multinodular goiter: Dynamic contrast-enhanced magnetic resonance imaging versus ultrasonography-guided fine-needle aspiration biopsy. Surgery. 2007;142(6):992–1002. doi: 10.1016/j.surg.2007.09.027. [DOI] [PubMed] [Google Scholar]
- 12.Evelhoch JL. Key factors in the acquisition of contrast kinetic data for oncology. J Magn Reson Imaging. 1999;10:254–259. doi: 10.1002/(sici)1522-2586(199909)10:3<254::aid-jmri5>3.0.co;2-9. [DOI] [PubMed] [Google Scholar]
- 13.Cárdenas-Rodríguez J, Li Y, Galons JP, Cornnell H, Gillies RJ, Pagel MD, Baker AF. Imaging biomarkers to monitor response to the hypoxia-activated prodrug TH-302 in the MiaPaCa2 flank xenograft model. Magn Reson Imaging. 2012;30:1002–1009. doi: 10.1016/j.mri.2012.02.015. [DOI] [PMC free article] [PubMed] [Google Scholar]
- 14.Heisen M, Fan X, Buurman J, van Riel NA, Karczmar GS, ter Haar Romeny BM. The influence of temporal resolution in determining pharmacokinetic parameters from DCE-MRI data. Magn Reson Med. 2010;63:811–816. doi: 10.1002/mrm.22171. [DOI] [PMC free article] [PubMed] [Google Scholar]
- 15.Henderson E, Rutt BK, Lee T-Y. Temporal sampling requirements for the tracer kinetics modeling of breast disease. Magn Reson Imaging. 1998;16:1057–1073. doi: 10.1016/s0730-725x(98)00130-1. [DOI] [PubMed] [Google Scholar]
- 16.Dintenfass L. Hemorheology of cancer metastases: an example of malignant melanoma. Survival times and abnormality of blood viscosity factors. Clin Heorheol. 1982;2:259–271. [Google Scholar]
- 17.Barbee JH, Cokelet GR. The Fahraeus effect. Microvasc Res. 1971;3(1):6–16. doi: 10.1016/0026-2862(71)90002-1. [DOI] [PubMed] [Google Scholar]
- 18.Fahraeus R, Lindqvist T. The viscosity of the blood in narrow capillary tubes. Am J Physiol. 1931;96:562–8. [Google Scholar]
- 19.Tofts PS. Modeling tracer kinetics in dynamic Gd-DTPA MR imaging. J Magn Reson Imaging. 1997;7:91–101. doi: 10.1002/jmri.1880070113. [DOI] [PubMed] [Google Scholar]
- 20.Roberts C, Hughes S, Naish JH, Holliday K, Watson Y, Cheung S, Buonaccorsi GA, Young H, Clarke N, Parker GJ. Use of An Individually Measured Hematocrit in DCE-MRI studies. Proc Intl Soc Mag Reson Med. 2011;19:1078. [Google Scholar]
- 21.Just N, Koh DM, D’Arcy J, Collins DJ, Leach MO. A ssessment of the effect of haematocrit-dependent arterial input functions on the accuracy of pharmacokinetic parameters in dynamic contrast-enhanced MRI. NMR Biomed. 2011;24(7):902–915. doi: 10.1002/nbm.1648. [DOI] [PubMed] [Google Scholar]
- 22.Strecker R, Scheffler K, Buchert M, Mross K, Drevs J, Hennig J. DCE-MRI in clinical trials: data acquisition techniques and analysis methods. Int J Clin Pharmacology Therapeutics. 2003;41(12):603–605. doi: 10.5414/cpp41603. [DOI] [PubMed] [Google Scholar]
- 23.O’Connor JPB, Jackson A, Parker GJM, Jayson GC. DCE-MRI biomarkers in the clinical evaluation of antiangiogenic and vascular disrupting agents. Br J Cancer. 2007;96(2):189–195. doi: 10.1038/sj.bjc.6603515. [DOI] [PMC free article] [PubMed] [Google Scholar]
- 24.Giraudeau C, Flament J, Marty B, Boumezbeur F, Meriaux S, Robic C, Port M, Tsapis N, Fattal E, Giacomini E, Lethimonnier F, Le Bihan D, Valette J. A New Paradigm for High- Sensitivity F-19 Magnetic Resonance Imaging of Perfluorooctylbromide. Magn Reson Med. 2010;63:1119–24. doi: 10.1002/mrm.22269. [DOI] [PubMed] [Google Scholar]
- 25.Giraudeau C, Djemaï B, Ghaly MA, Boumezbeur F, Meriaux S, Robert P, Port M, Robic C, Bihan DL, Lethimonnier F, Valette J. High sensitivity 19F MRI of a perfluorooctyl bromide emulsion: application to a dynamic biodistribution study and oxygen tension mapping in the mouse liver and spleen. NMR Biomed. 2011;25:654, 60. doi: 10.1002/nbm.1781. [DOI] [PubMed] [Google Scholar]
- 26.Tofts P, Brix G, Buckley D, Evelhoch J, Henderson E, Knopp M, Larsson H, Lee T, Mayr N, Parker G, Port R, Taylor J, Weisskoff R. Estimating kinetic parameters from dynamic contrast-enhanced T-1-weighted MRI of a diffusable tracer: Standardized quantities and symbols. J Magn Reson Imaging. 1999;10:223–32. doi: 10.1002/(sici)1522-2586(199909)10:3<223::aid-jmri2>3.0.co;2-s. [DOI] [PubMed] [Google Scholar]
- 27.Yankeelov T, Luci J, Lepage M, Li R, Debusk L, Lin P, Price R, Gore J. Quantitative pharmacokinetic analysis of DCE-MRI data without an arterial input function: a reference region model. Magn Reson Imaging. 2005;23:519–29. doi: 10.1016/j.mri.2005.02.013. [DOI] [PubMed] [Google Scholar]
- 28.Jaspers K, Aerts H, Leiner T, Oostendorp M, van Riel N, Post M, Backes W. Reliability of pharmacokinetic parameters: Small vs. medium-sized contrast agents. Magn Reson Med. 2009;62:779–87. doi: 10.1002/mrm.22035. [DOI] [PubMed] [Google Scholar]
- 29.Neubauer AM, Sim H, Winter PM, Caruthers SD, Williams TA, Robertson JD, Sept D, Lanza GM, Wickline SA. Nanoparticle Pharmacokinetic Profiling In Vivo Using Magnetic Resonance Imaging. Magn Reson Med. 2008;60:1353–1361. doi: 10.1002/mrm.21795. [DOI] [PMC free article] [PubMed] [Google Scholar]
- 30.Kassner A, Thornhill RE, Liu F, Winter PM, Caruthers SD, Wickline SA, Lanza GM. Assessment of tumor angiogenesis: dynamic contrast-enhanced MRI with paramagnetic nanoparticles compared with Gd-DTPA in a rabbit Vx-2 tumor model. Contrast Media Mol Imaging. 2010;5:155–61. doi: 10.1002/cmmi.380. [DOI] [PubMed] [Google Scholar]
- 31.Fan X, River J, Muresan A, Popescu C, Zamora M, Culp R, Karczmar G. MRI of perfluorocarbon emulsion kinetics in rodent mammary tumours. Phys Med Biol. 2006;51:211–20. doi: 10.1088/0031-9155/51/2/002. [DOI] [PubMed] [Google Scholar]
- 32.Galbraith S, Lodge M, Taylor N, Rustin G, Bentzen S, Stirling J, Padhani A. Reproducibility of dynamic contrast-enhanced MRI in human muscle and tumors: comparison of quantitative and semi-quantitative analysis. NMR Biomed. 2002;15:132–142. doi: 10.1002/nbm.731. [DOI] [PubMed] [Google Scholar]
- 33.Haacke EM, Brown RW, Thompson MR, Venkatesan R. Magnetic Resonance Imaging: Physical Principles and Sequence Design. New York: Wiley & Sons; 1999. [Google Scholar]
- 34.Kovar D, Lewis M, Karczmar G. A new method for imaging perfusion and contrast extraction fraction: Input functions derived from reference tissues. J Magn Reson Imaging. 1998;8:1126–34. doi: 10.1002/jmri.1880080519. [DOI] [PubMed] [Google Scholar]
- 35.Kamoun WS, Chae S-S, Lacorre DA, Tyrrell JA, Mitre M, Gillissen MA, Fukumura D, Jain RK, Munn LL. Simultaneous measurement of RBC velocity, flux, hematocrit and shear rate in vascular networks. Nature Methods. 2010;7(8):655–660. doi: 10.1038/nmeth.1475. [DOI] [PMC free article] [PubMed] [Google Scholar]
- 36.Yu JX, Kodibagkar VD, Liu L, Mason RP. A 19F NMR Approach using Reporter Molecule Pairs to Assess β-Galactosidase in Human Xenograft Tumors in Vivo. NMR Biomed. 2008;21(7):704–712. doi: 10.1002/nbm.1244. [DOI] [PMC free article] [PubMed] [Google Scholar]
- 37.Partlow KC, Chen J, Brant JA, Neubauer AM, Meyerrose TE, Creer MH, Nolta JA, Caruthers SD, Lanza GM, Wickline SA. 19F magnetic resonance imaging for stem/progenitor cell tracking with multiple unique perfluorocarbon nanobeacons. FASEB J. 2007;21:1647–1654. doi: 10.1096/fj.06-6505com. [DOI] [PubMed] [Google Scholar]
- 38.Ali MM, Yoo B, Pagel MD. Tracking the relative in vivo pharmacokinetics of nanoparticles with PARACEST MRI. Molec Pharmaceutics. 2009;6(5):1409–1416. doi: 10.1021/mp900040u. [DOI] [PMC free article] [PubMed] [Google Scholar]