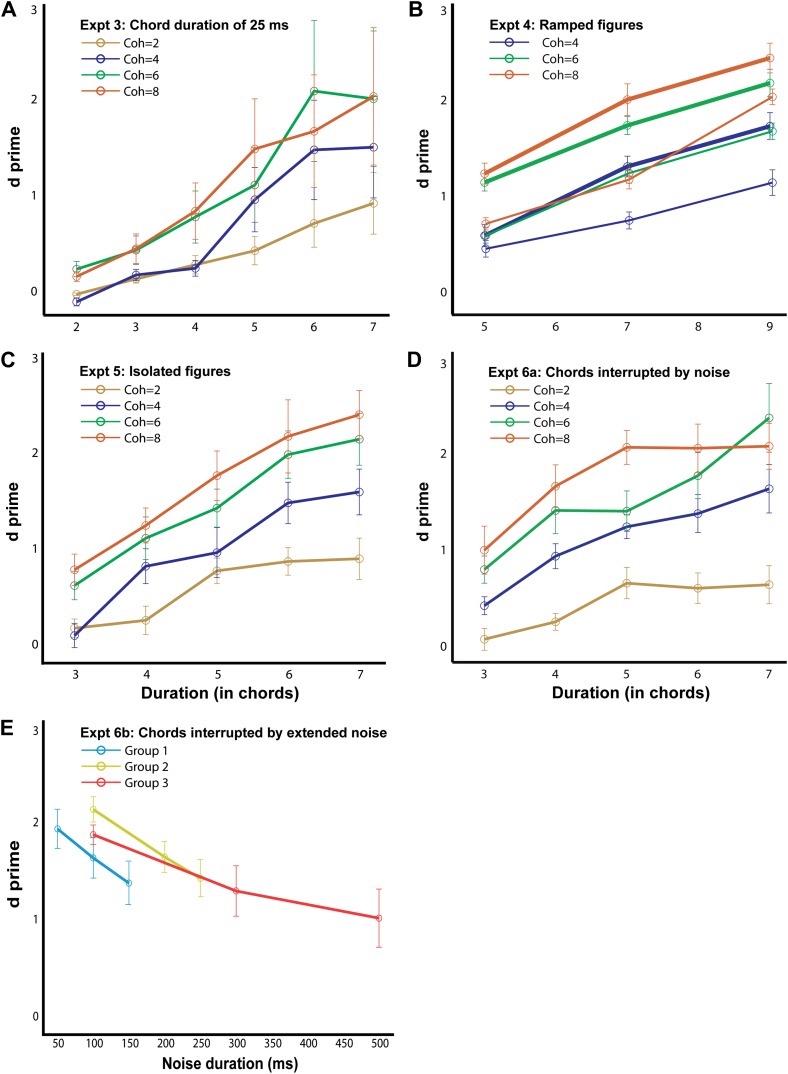
Figure 4. Behavioral performance in the psychophysics experiments.
The d′ for experiment 3, 4a (thick lines; ramp step = 2), 4b (thin lines, ramp step = 5), 5, 6a and 6b are shown here, as labeled in each figure (n = 10 for all conditions). The abscissa represents the duration of the figure (A–D) and the duration of the masking noise in E. Note that the maximum duration value in experiments 4a and 4b is larger (9 chords) than in the other experiments. Error bars signify one SEM.

