

Abstract
Background:
In previous studies, the Forkhead/winged-helix-box-class-O3 (FOXO3) transcription factor has displayed both tumour suppressive and metastasis-promoting properties.
To clarify its role in human colorectal cancer (CRC) progression, we examined in vivo FOXO3 expression at key points of the metastatic cascade.
Methods:
Formalin-fixed paraffin-embedded resection specimens from normal colon, adenomas, primary CRC specimens of different pathological stage and CRC specimens with matched liver metastases were used to generate three separate custom-designed tissue microarray (TMA) representations of metastatic progression. Triplicate cores, immunostained for FOXO3 were scored semiquantitatively by two investigators.
Results:
The FOXO3 expression is significantly reduced in CRC specimens compared with normal tissue, and progressive FOXO3 downregulation is associated with advancing pathological stage. In addition, recurrent stage I/II primary tumours show a significantly lower FOXO3 expression compared with stage-matched non-recurrent tumours. When stratified according to high and low FOXO3 expression, mean disease-free survival in the low-expressing group was 28 months (95% CI 15.8–50.6) compared with 64 months (95% CI 52.9–75.4) in the high-expressing group.
Conclusion:
We have demonstrated an association between low FOXO3 expression and CRC progression in vivo using purpose-designed TMAs. Forkhead/winged-helix-box-class-O3 may represent a novel biomarker of nodal and distant disease spread with clinical utility in CRC.
Keywords: colorectal neoplasms, neoplasm metastasis, FOXO3 protein, tissue microarray analysis
Forkhead box (FOX) proteins are an evolutionarily conserved family of transcription factors characterised by the presence of ‘Forkhead-box' DNA-binding domains. In cancer, the FOXO subfamily controls diverse genetic pathways and are considered tumour suppressor genes, as combined somatic deletion in mice of individual subfamily members, FOXO1, FOXO3 and FOXO4 initiates a progressive cancer-prone condition characterised by thymic lymphoma and haemangioma development (Myatt and Lam, 2007; Paik et al, 2007). However, recent data suggest that in the context of high nuclear β-catenin expression, FOXO3 may also have a pro-metastatic role promoting tumour progression in colorectal cancer (CRC) through co-regulation of metastasis relevant genes (Tenbaum et al, 2012).
Nevertheless, in vitro the tumour suppressive actions of the FOXO family are well described: FOXO3 regulates tumour suppressor genes involved in apoptosis (Brunet et al, 1999; Dijkers et al, 2000a; Modur et al, 2002), DNA damage repair (Tran et al, 2002), cell cycle regulation (Medema et al, 2000; Dijkers et al, 2000b; Stahl et al, 2002) and protection from oxidative stress (Nemoto and Finkel, 2002). Phosphorylation by AKT inhibits FOXO transcriptional functions contributing to cell survival, proliferation and growth, and aberrant activation of the AKT/PI3K pathway of which FOXO3 is an important component drives colorectal pathogenesis (Sasaki et al, 2000; Itoh et al, 2002; Khaleghpour et al, 2004).
However, FOXO3 expression in vivo is less well characterised and as a consequence, the clinical significance of FOXO proteins during CRC progression remains unclear.
To address this issue, we developed three distinct custom-designed TMAs to allow evaluation of FOXO3 expression from several different and clinically relevant perspectives. First, to assess FOXO3 expression in different stages of CRC, we arrayed normal colorectal mucosa, adenomas, and early- and late-stage primary CRC tissue. Second, to examine the expression of FOXO3 between primary and metastatic lesions, we arrayed primary tumour tissue and matched (synchronous and metachronous) liver metastases. Third, to evaluate any potential contribution of FOXO3 as a marker of micrometastases, we arrayed early-stage (I/II) tumours with or without subsequent disease recurrence.
Our results show FOXO3 expression is reduced in CRC specimens of progressive pathological stage. Furthermore, FOXO3 expression is reduced in stage I/II (node negative) tumour specimens from patients who subsequently develop metastases compared with patients who remain metastasis free. These findings add to a body of evidence that suggests that FOXO proteins act as tumour suppressors in CRC, and that dysregulation and loss of FOXO3 is a consistent step in progression to metastasis.
Materials and methods
Patient cohort selection
Three TMAs were generated using formalin-fixed specimens from 164 primary tumours, 58 matched liver metastases and 10 samples of normal colonic tissue from patients who underwent resections for CRC at the Southampton General Hospital between 2004 and 2011. Only patients for whom blood, frozen and formalin-fixed tumour tissue were available alongside adequate histopathological, pre-, intra- and post-operative clinical information were used for construction of TMAs. All patients provided written informed consent and ethical approval was obtained (REC B07/H0504/125). Pathological verification of diagnosis and staging was in accordance with the Association of Coloproctology of Great Britain and Ireland guidelines on the management of CRC.
Tissue microarray 1 examined FOXO3 expression in advancing CRC disease stage and comprised 20 benign specimens, 20 early-stage (I/II) specimens and 20 late-stage (III/IV) specimens selected at random from an archive of 400 non-mucinous tumours. TMA2 compared all available paired primary CRC specimens and liver metastases (n=58), and TMA3 compared patients with stage I/II CRC, with no significant histological or clinical features of biologically aggressive disease but who subsequently developed metastases within 5 years with carefully matched patients who remained metastasis free (n=33 vs 33).
Tissue microarray construction
Haematoxylin and eosin-stained slides from each tissue block were reviewed by a senior consultant pathologist (GJT), together with pathological reports to select triplicate areas of representative adenocarcinoma in colon and liver resections, adenoma and normal colonic mucosa. Tissue microarrays were constructed using a semiautomatic array machine (ALPHELYS MiniCore 3, Plaisir, France) using a 1-mm core punch, annealed at 40 °C.
Immunohistochemical staining
Tissue microarray sections were immunostained using a primary rabbit polyclonal FOXO3 antibody (Cell Signalling Technology #9467; Danvers, MA, USA) pre-optimised by our group for use with paraffin-embedded specimens, using tonsilar tissue as a positive control. Specificity of staining was confirmed by western blotting of high- and low-expressing tumour cell lines, as well as FOXO3 overexpression and knockdown studies. Sections were deparaffinised and rehydrated through graded alcohols. Endogenous peroxidase activity was blocked using 0.5% hydrogen peroxide in methanol for 10 min, and antigen retrieval was performed using pressure cooker treatment for 2 min in 0.01 ℳ citrate buffer (pH 6.0) at 13 lbs pressure. Sections were first incubated with avidin and biotin solutions, blocking non-specific antibody binding. Each step was preceded by three Tris-buffered saline (TBS) washes. Sections were incubated in culture medium for 20 min, directly followed by overnight incubation at 4 °C with FOXO3-specific rabbit polyclonal-antibody (1 : 100 dilution). Sections received three TBS washes before secondary DAKO-biotinylated swine anti-rabbit antibody (Glostrup, UK) (1 : 400 dilution) was applied for 30 min. Following further TBS washes, sections were incubated in streptavidin biotin–peroxidase complexes (Vectastain ABC Vector laboratories, Burlingame, CA, USA) diluted in TBS at 1 : 75 concentration for 30 min. After further TBS washes and application of the staining substrate diaminobenzidinesubstrate (Biogenex, Fremont, CA, USA) for 5 min, specimens were washed and counter-stained in Harris's haematoxylin before being dehydrated through graded ethanols. Sections were cleared in Clearene (Leica Microsystems, Wetzlar, Germany) and mounted with Pertex mounting medium (Leica Microsystems) and cover slips. Positive controls and negative controls were included on each staining run.
Immunohistochemical scoring
All analyses were conducted within the three distinct TMAs. Inter-TMA comparisons were not conducted.
The FOXO3 expression in tumour epithelial cells and surrounding peri-tumoural stroma was assessed by two investigators (GJT and AHM) blinded to the clinical data and to the other investigator's score. Each core was semiquantitatively scored on a scale of 1–4 corresponding to staining intensity and percentage of cells with positive nuclear staining: (1) low/negative staining <5% positivity; (2) focal/patchy staining 5–25% cell positivity; (3) moderate staining 25–50% positive and (4) strong staining >50% positivity (Figure 1). Three cores were evaluated from each tumour. Scoring was calculated from the mean of the two independently conducted readings. Concordance between readings was 90%, confirming interobserver repeatability of the scoring method. In the 10% of cases where scoring was non-concordant, a consensus score was agreed on further review.
Figure 1.

Immunohistochemistry for the purpose of FOXO3 quantitation. Tissue microarray sections immunostained with primary FOXO3 antibody. FOXO3 expression was measured semiquantitatively on a scale of 1–4 corresponding to staining intensity and percentage of cells with positive nuclear staining: (1) low/negative staining <5% positivity; (2) focal/patchy staining 5–25% positivity; (3) moderate staining 25–50% positivity and (4) strong staining >50% positivity.
Statistical analysis
Analysis of clinicopathological patient data was performed using a combination of independent t-tests, Mann–Whitney U, χ2- and Fisher's exact tests.
The FOXO3 expression scores were analysed using the SPSS Statistics-19 (IBM-USA, Armonk, NY, USA) software package and expressed as mean±s.e.m. Statistical significance was assessed using independent t-tests for independent data and paired t-tests for primary colorectal and matched metastatic liver tissue.
Disease-free survival and cancer-specific survival were analysed using Kaplan–Meier survival curves with log-rank tests for significance. Recurrence was defined by positive radiological imaging (CT, MRI or PET) and/or biopsy information. Deaths from other causes were censored.
The ROC curve analysis was used to evaluate the sensitivity and specificity of FOXO3 as a prognostic tool.
The threshold level of significance was set to 0.05 for all statistical tests in this study.
Results
This study addresses two important clinical questions. First, whether expression of FOXO3, a gene with potent in vitro tumour-suppressing properties, correlates in vivo with CRC phenotype, and second whether FOXO3 expression has the potential as a prognostic or even diagnostic biomarker of CRC recurrence. Tissue microarray 1 and TMA2 were designed to address the first question, and TMA3 was designed to address the second question.
A total of 164 patients with CRC who underwent colonic resection were included in this study. Clinical and histopatholological data for these patients are summarised in Tables 1, 2, 3. Specimens containing adenomatous polyp were obtained from a further 10 patients. Normal colorectal tissue was obtained from 10 patients from synchronous uninvolved segments of the CRC resection specimens. Sections of liver metastases (29 synchronous/29 metachronous), obtained from 58 patients, were mounted side by side in TMA2.
Table 1. Tissue microarray (TMA) 1 tumours of progressive pathological stage.
| Baseline and tumour characteristics | Stage I/II | Stage III/IV | P-value |
|---|---|---|---|
| Age, years at diagnosis (mean+s.d.) |
70.5 (12.7) |
66.1 (15.2) |
0.331a |
| Gender (m : f) absolute numbers |
12 : 8 |
13 : 7 |
0.774b |
|
ASA grade |
|
|
0.723b |
| Fit | 6 | 7 | |
| Relevant disease | 11 | 10 | |
| Restrictive disease | 2 | 3 | |
| Life-threatening disease |
1 |
0 |
|
|
Tumour site |
|
|
0.568b |
| Caecum | 4 | 1 | |
| Ascending colon | 3 | 1 | |
| Transverse colon | 1 | 1 | |
| Descending colon/sigmoid colon | 6 | 9 | |
| Rectosigmoid colon | 0 | 1 | |
| Rectum |
6 |
7 |
|
|
Surgical setting |
|
|
1.000c |
| Elective | 20 | 19 | |
| Emergency |
0 |
1 |
|
|
Histopathological data |
|
|
0.060a |
| Maximum tumour diameter (mm)
Mean (s.d.) |
47.8(19.6) |
37.1(14.1) |
|
|
T stage |
|
|
0.617c |
| T2 | 6 | 5 | |
| T3 | 8 | 11 | |
| T4 |
6 |
4 |
|
|
N stage |
|
|
|
| N0 | 20 | 0 | |
| N1 | 0 | 13 | |
| N2 |
0 |
7 |
|
|
M stage |
|
|
0.487c |
| M0 | 20 | 18 | |
| M1 | 0 | 2 | |
| Extramural vascular invasion | 3 | 5 | 0.434c |
| Involved CRM | 0 | 3 | 0.200c |
| Tumour perforation |
2 |
2 |
1.000c |
|
Adjuvant therapy | |||
| Neoadjuvant chemotherapy | 1 | 0 | 1.000c |
| Neoadjuvant radiotherapy | 1 | 1 | 1.000c |
| Adjuvant chemotherapy | 5 | 18 | |
| Adjuvant radiotherapy | 1 | 4 | |
| Median follow-up, months (95% CI) | 52 (33.3–70.6) | 60 (56.5–63.5) | 0.130d |
Abbreviation: ASA=American Society of Anesthesiologists; CI=confidence interval; CRM=Circumferential resection margin.
Independent t-test.
χ2-test.
Fisher's exact test.
Log-rank (Mantle–Cox's) test.
Table 2. Tissue microarray (TMA) 2 primary tumour with paired liver metastases.
| Baseline and tumour characteristics | Synchronous metastasis group | Metachronous metastasis group | P-value |
|---|---|---|---|
| Age, years at diagnosis (mean+s.d.) |
65.0(11.1) |
63.6(9.1) |
0.531a |
| Gender (m : f) absolute numbers |
19 : 10 |
22 : 7 |
0.387b |
|
Tumour site |
|
|
0.426b |
| Caecum | 4 | 3 | |
| Ascending colon | 4 | 2 | |
| Transverse colon | 3 | 1 | |
| Descending colon/sigmoid colon | 6 | 9 | |
| Rectosigmoid colon | 5 | 5 | |
| Rectum |
7 |
9 |
|
|
Surgical setting |
|
|
0.490b |
| Elective | 23 | 20 | |
| Emergency | 6 | 8 | |
| Data unavailable |
— |
1 |
|
|
Histopathological data | |||
| Maximum tumour diameter (mm) mean |
28.09 |
26.82 |
0.772c |
|
T stage/N stage |
|
|
0.301b |
| T0/Tx | 1 | 0 | |
| T2 | 0 | 3 | |
| T3 | 21 | 17 | |
| T4 | 7 | 9 | |
| N0 | 7 | 10 | |
| N1 | 17 | 13 | |
| N2 |
5 |
6 |
|
| Extramural vascular invasion |
10 |
12 |
0.516b |
| Involved CRM |
3 |
1 |
0.612d |
| Tumour perforation |
3 |
4 |
1.000d |
| Neoadjuvant therapy |
14 |
9 |
0.104b |
| Median follow-up, months (95% CI) | 43 (18.6–67.4) | 59 (36.9–81.0) | 0.064e |
Abbreviation: CI=confidence interval.
Independent t-test.
χ2-test.
Mann–Whitney U–test.
Fisher's exact test.
Log-rank (Mantle–Cox's) test.
Table 3. Tissue microarray (TMA) 3 stage I/II tumours with and without subsequent metastatic progression.
| Baseline and tumour characteristics | Recurrence group | No recurrence group | P-value |
|---|---|---|---|
| Age, years at diagnosis (mean+s.d.) |
75.0 (10.9) |
71.9 (10.5) |
0.252a |
| Gender (m : f) absolute numbers |
26 : 7 |
23 : 10 |
0.394b |
|
Tumour site |
|
|
0.381b |
| Caecum | 2 | 4 | |
| Ascending colon | 2 | 5 | |
| Transverse colon | 6 | 4 | |
| Descending colon/sigmoid colon | 10 | 10 | |
| Rectosigmoid colon | 2 | 2 | |
| Rectum | 10 | 7 | |
| Synchronous tumour | — | 1 | |
| Stoma |
1 |
— |
|
|
Surgical setting |
|
|
0.792b |
| Elective | 23 | 22 | |
| Emergency |
10 |
11 |
|
|
Histopathological data | |||
| Maximum tumour diameter (mm)
Mean (s.d.) |
47.7(23.9) |
46.0(18.8) |
0.316a |
|
T stage |
|
|
0.531b |
| T2 | 1 | 3 | |
| T3 | 22 | 19 | |
| T4 |
10 |
11 |
|
|
N stage | |||
| N0 | 33 | 33 | |
| N1 | 0 | 0 | |
| N2 |
0 |
0 |
|
|
AJCC stage, 5th edition |
|
|
0.238c |
| Stage I | 1 | 3 | |
| Stage II |
32 |
30 |
|
| Extramural vascular invasion |
6 |
1 |
0.105c |
| Tumour perforation |
3 |
5 |
0.708c |
|
Adjuvant therapy | |||
| Neoadjuvant chemotherapy | 4 | 2 | 0.672c |
| Neoadjuvant radiotherapy | 6 | 2 | 0.258c |
| Adjuvant chemotherapy | 8 | 5 | 0.537b |
| Adjuvant radiotherapy |
3 |
2 |
1.000c |
| Median follow-up, months (95% CI) | 62 (51.0—72.4) | 71 (59.6—82.4) | 0.282d |
Abbreviations: AJCC=American Joint Committee on Cancer; CI=confidence interval.
Independent t-test.
χ2-test.
Fisher's exact test.
Log-rank (Mantle–Cox's) test.
Expression of FOXO3 in benign and malignant disease and in CRC specimens of progressive pathological stage
Baseline demographical and tumour characteristics for TMA1 are summarised in Table 1.
A pattern of decreasing FOXO3 expression was observed with advancing disease stage, mirroring the transition from normal colorectal epithelium to benign adenoma and from stage I/II (node negative) CRC to stage III/IV (metastatic) disease.
The mean FOXO3 expression score in stage I/II CRC specimens was 3.083, compared with 1.586 in stage III/IV disease, representing a highly significant difference in means of 1.497 (t-test, P=0.001; Figure 2). This suggests that FOXO3 expression in vivo is generally downregulated rather than induced in tumours that have acquired the capacity to metastasise.
Figure 2.
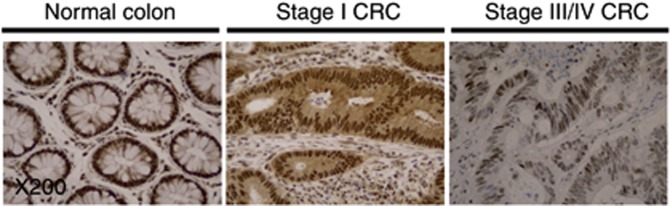
Representative CRC tissue sections immunostained for FOXO3 at × 200 magnification. Brown DAB chromagen nuclear staining is seen most prominently in normal colon tissue with a weaker staining observed in stage I CRC tissue. The most notable change is observed between stage I and stage III/IV CRC, as low intensity staining is seen in only a small number of epithelial nuclei in stage III/IV disease.
Forkhead/winged-helix-box-class-O3 expression in primary and metastatic CRC
The FOXO3 expression was low both in primary CRC specimens (1.920±0.068) and matched liver metastases (1.640±0.074) compared with benign tissue.
The overall mean FOXO3 expression score was higher in primary CRC tissue than in matched liver metastases, with a small but significant difference of 0.2803 (paired t-test, P<0.003). Although no significant differences were observed between synchronous metastasis and matched primary tumours, FOXO3 expression in metachronous metastases was significantly lower than that in primary CRC tissue, with a difference of 0.492 (paired t-test, P<0.001; Figure 3).
Figure 3.

FOXO3 expression in primary CRC specimens and paired liver metastases. (A) Primary CRC specimens demonstrate marginally higher mean FOXO3 expression scores (1.920±0.068) than paired liver metastases (1.640±0.074), representing a mean difference of 0.2803 (P<0.003). (B) CRC and paired metachronous liver metastasis. The difference in mean FOXO3 score between primary tumour and paired metachronous liver metastasis is 0.492. Although this difference is modest, it is highly statistically significant (P-value<0.001). (C) CRC and paired synchronous liver metastasis. The difference in mean FOXO3 expression score between primary tumour and paired synchronous liver metastasis is small (0.086) and not significant (P=0.4775).
Other than metastatic status, no differences were identified in any clinicopathological or tumour parameter (Table 2). This highlights the potential application of FOXO3 as a marker of micrometastatic disease, with utility in the identification of subclinical metastases.
Forkhead/winged-helix-box-class-O3 role as predictive biomarker in early-stage (I/II) CRC
The median follow-up period in recurrence and non-recurrence groups was 62 and 71 months, respectively. Both groups were well matched with no significant differences in demographics, histopathological parameters, tumour stage or location (Table 3).
Immunohistochemical analysis of primary CRCs revealed that the mean FOXO3 expression in patients with subsequent metastatic recurrence was significantly lower (2.33±0.13) than that in the non-recurrence group (3.15±0.11; t-test, P<0.0001), equating to a mean difference of 0.82 (Figure 4A).
Figure 4.

(A) Tissue microarray 3: FOXO3 expression in stage I/II CRC specimens with and without metastatic recurrence within 5 years. (a) Mean FOXO3 expression score in the recurrence group and non-recurrence group is 2.33±0.13 and 3.15±0.11, respectively, representing a mean difference of 0.82. (b) Kaplan–Meier curve of 5 years disease-free survival (DFS) for TMA3. Patients were stratified according to FOXO3 expression score (low FOXO3 expression ⩽2 and high FOXO3 expression >2). Mean DFS in the low expression group was 28 months (95% CI 15.8–40.6) compared with 64 months (95% CI 52.9–75.4) in the high expression group. (B) Analysis of ROC curve using FOXO3 expression as a predictive test of future recurrence in stage I/II CRC. Area under the curve=0.714 (95% CI 0.586–0.842) P=0.004. The optimal cut-off threshold for FOXO3 expression as a predictive test of future recurrence in stage I/II CRC was determined as 2.75 (low vs high FOX03 expression), which as a test for recurrence within 3 years is associated with a sensitivity of 65.5%, specificity of 66.7%, positive predictive value of 63.3% (19 out of 30) and negative predictive value of 68.8% (22 out of 32). (C) Kaplan–Meier analysis based on the optimal cut-off threshold for FOXO3 expression of 2.75. (a) The 5-year mean DFS was 38.1 months (95% CI 26.3–50.1) in the low FOXO3 expression group and 69.6 months (95% CI 56.7–82.6) in the high FOXO3 expression group. Log-rank P=0.003. (b) The 5-year CSS was 54 months (95% CI 54.1–77.5) in the low FOXO3 expression group and 77 months (95% CI 41.7–87.2) in the high FOXO3 expression group. Log-rank test, P=0.024.
Stratification of tumours into high (>2) and low (<2) FOXO3 expression revealed that low FOXO3 expression was associated with mean disease-free survival of 28 months (95% CI 15.8–50.6) compared with 64 months (95% CI 52.9–75.4) with high FOXO3 expression (log-rank test, P=0.001; Figure 4A). Approximately 87.5% (14 out of 16) of patients in the low FOXO3 expression group experienced recurrence within 5 years compared with 38% (19 out of 50) in the high FOXO3 expression group.
Higher cancer-specific mortality (62.5%) and shorter cancer-specific survival (47 months) was observed in the low FOXO3 group compared with the high FOXO3 expression group (32% cancer-specific mortality and 73.8-month cancer-specific survival).
Analysis for potential clinicopathological confounders identified no statistical differences between FOXO3 groupings, except that patients in the low FOXO3 group more frequently received neoadjuvant radiotherapy (Table 4).
Table 4. Stage I/II tumours characterised by low (<2) or high (>2) FOXO3 expression.
| Baseline and tumour characteristics | Low FOXO3 | High FOXO3 | P-value |
|---|---|---|---|
| Age, years at diagnosis (mean+s.d.) |
74.8 (11.6) |
73.1 (10.6) |
0.598a |
| Gender (m : f) absolute numbers |
13 : 3 |
35 : 15 |
0.379b |
|
Tumour site |
|
|
0.272b |
| Caecum | 0 | 6 | |
| Ascending colon | 2 | 5 | |
| Transverse colon | 2 | 8 | |
| Descending colon/sigmoid colon | 3 | 17 | |
| Rectosigmoid colon | 2 | 2 | |
| Rectum | 7 | 10 | |
| Synchronous tumour | — | 1 | |
| Stoma |
— |
1 |
|
|
Surgical setting |
|
|
0.955b |
| Elective | 11 | 34 | |
| Emergency |
5 |
16 |
|
|
Histopathological data |
|
|
|
| Maximum tumour diameter (mm)
Mean (s.d.) |
45(20.3) |
47.5(21.8) |
0.688a |
|
T stage |
|
|
0.489b |
| T2 | 0 | 4 | |
| T3 | 11 | 30 | |
| T4 |
5 |
16 |
|
|
AJCC stage, 5th edition |
|
|
1.000c |
| Stage I | 0 | 3 | |
| Stage II |
16 |
47 |
|
| Extramural vascular invasion |
1 |
6 |
0.671c |
| Tumour perforation |
3 |
5 |
0.390c |
|
Adjuvant therapy |
|
|
|
| Neoadjuvant chemotherapy | 3 | 3 | 0.148c |
| Neoadjuvant radiotherapy | 5 | 3 | 0.017c |
| Adjuvant chemotherapy | 5 | 8 | 0.276c |
| Adjuvant radiotherapy |
1 |
4 |
1.000c |
| Recurrence |
14/16 |
19/50 |
|
| Mean DFS, months (s.d.) |
28.2(6.3) |
64.2(5.7) |
0.0001d |
| Mortality |
10/16 |
16/50 |
0.011d |
| Mean postoperative survival, months (s.d.) | 47.0(8.6) | 73.8(4.3) |
Abbreviations: DFS=disease-free survival; FOXO3=Forkhead/winged-helix-box-class-O3.
Independent t-test.
χ2-test.
Fisher's exact test.
Log-rank (Mantle–Cox's) test.
Given this pattern of more frequent and earlier recurrence associated with tumours expressing low levels of FOXO3, we sought to quantify the predictive value of FOXO3 in terms of recurrence risk in the early-stage CRC. Using ROC curve analysis, a threshold of 2.75 for predicting 3 year recurrences was selected, achieving positive and negative predictive values of 63.3% and 68.8% coupled with sensitivity and specificity values of 65.5% and 66.7%, respectively (Figure 4B and C).
This evidence suggests that FOXO3 has biomarker potential and may prove useful in assisting the identification of patients at an elevated risk of developing metastases. This would represent an important clinical development, as currently there are no effective prognostic markers of disease recurrence in stage II CRC.
Discussion
FOXO3 and CRC progression
Recent work by Tenbaum et al (2012) highlights a previously unidentified role of FOXO3 in the promotion, rather than suppression of CRC metastasis, observed when high FOXO3 expression is found in conjunction with high intranuclear β-catenin expression Their data suggest that the physical association of FOXO3 and β-catenin within colorectal cell nuclei impairs FOXO3-induced apoptosis and cell cycle arrest, and promotes expression of an alternative gene-set involved in cytoskeletal remodelling, cell shape and mobility. Induction of both exogenous FOXO3 and β-catenin in HT29 and DLD1 CRC cell lines was associated with relocation of E-cadherin from normal epithelial cell-to-cell contacts to cytoplasmic aggregates, loss of epithelial organisation and increased cell scattering.
An association between high FOXO3, metastases and poor prognosis in cancer had previously been described (Storz et al, 2009; Chen et al, 2010); however, the consensus view based on accumulated in vitro evidence was that FOXO transcription factors have a tumour-suppressing role.
Forkhead/winged-helix-box-class-O3 regulates the expression of a cluster of genes that encode tumour suppressor proteins involved in cell cycle regulation (p27Kip1,Cyclin D1, Cyclin D2, p130; Medema et al, 2000; Dijkers et al, 2000b; Schmidt et al, 2002; Stahl et al, 2002; Kops et al, 2002b), apoptosis (Bim, Fas L, TRAIL; Brunet et al, 1999; Dijkers et al, 2000a; Modur et al, 2002), DNA damage repair (GADD45a; Tran et al, 2002) and protection from oxidative stress (MnSOD, catalase; Nemoto and Finkel, 2002; Kops et al, 2002a). Furthermore, FOXO proteins have been shown in several cancer types to mediate the cellular response to traditional chemotherapeutic agents and EGFR-targeted monoclonal antibodies (Real et al, 2005; Gomes et al, 2008; Yang and Hung, 2009).
In CRC, suppression of FOXO3 by activated AKT is an important mechanism by which the EGFR signalling pathway, through impaired expression of the cell cycle inhibitor p27kip1, stimulates proliferation in normal and transformed colonic epithelium (Qi et al, 2011). Recent studies also link FOXO3 activity to the induction of G1 cell cycle arrest through an alternative, cMyc-dependent, microRNA-34b/34c-mediated pathway (Kress et al, 2011), and low FOXO3 expression in CRC has been shown to increase resistance to chemotherapy (Fernández de Mattos et al, 2008).
To inform the ongoing debate concerning the biological impact of FOXO proteins, we constructed three separate custom-designed TMA representations of CRC progression to examine FOXO3 expression in vivo. Our data demonstrates a metastatic predisposition associated with reduced nuclear FOXO3 expression. We found that FOXO3 was significantly downregulated in metastatic CRC compared with non-metastatic disease, and low expression was associated with poor prognosis, findings that are consistent with a tumour suppressor role.
The analysis of Tenbaum et al (2012) contends that the tumour suppressor activity of FOXO3 is subverted by β-catenin in the nucleus; that is to say elevated nuclear β-catenin and FOXO3 in combination are associated with a metastatic predisposition.
This apparent inconsistency between studies may be explained by contrasting methodology. Whereas Tenbaum et al (2012) examined nuclear-only expression of FOXO3 and defined high and low FOXO3 expression relative to group-mean FOXO3 expression, in the present study FOXO3 expression was quantified using absolute, predefined criteria, based on conventional immunohistochemistry techniques used routinely by pathological departments dealing with CRC.
Importantly, in our study, we applied this methodology not only to identify that FOXO3 expression is suppressed in late-stage vs early-stage CRC but also to validate these findings in metastasis vs primary tumour tissue and in stage II tumours with and without subsequent metastatic progression.
Stage I/II CRC: FOXO3 as a potential biomarker for predicting future tumour recurrence
Disease recurrence remains a substantial problem in stage I/II CRC, as 20–25% of patients following surgery with curative intent develop metastases within 5 years (Manfredi et al, 2006). There is strong evidence to support the routine use of adjuvant chemotherapy in stage III (node positive) disease; however, in stage II CRC, treatment is recommended only for patients judged to be at high risk of recurrence based on a number of loosely defined clinical and pathological parameters (Baddi and Benson, 2005). A significant minority of patients with stage II CRC who might therefore benefit from selective chemotherapy are suboptimally managed, highlighting the utility of robust biomarkers of tumour recurrence in this context.
Results from the present study demonstrate a strong correlation in stage I/II tumours between low FOXO3 expression and short disease-free survival (low expression=28 months compared with high expression=64 months) and cancer-specific survival (low expression=47 months; high expression=73.8 months). Rigorous examination for potential confounding factors was conducted but no other statistically significant differences were identified between the high and low FOXO3 expression groups.
As a predictive biomarker of CRC recurrence in stage II disease, FOXO3 is associated with 66% and 67% sensitivity and specificity, respectively, which is insufficient for clinical application. However, when considering the inherent heterogeneity of cancer, it is unlikely that a single biomarker will ever be capable of effectively predicting outcome in all tumours, and the advantage of our approach, which is both novel and physiologically relevant, is that it offers a rapid and versatile discovery pipeline capable of interrogating the validity of multiple tumour-relevant proteins either alone or in combination.
Carefully designed tissue microarrays create an ideal platform for biomarker discovery as their design allows direct comparisons of protein expression to be drawn between recurrence and matched non-recurrence groups. In this way, we were able to demonstrate that patients with stage I/II CRC with no significant histological or clinical features of biologically aggressive disease but who subsequently developed colorectal metastases could be reliably identified at the point of surgery based on FOXO3 expression in the CRC resection specimen.
Correlating FOXO3 expression with other clinical and pathological variables, such as K-Ras, B-Raf and β-catenin status, may enhance the sensitivity and specificity of the TMA-based approach in future.
Study limitations
This study represents a retrospective observational study examining the expression of a single protein and was not designed to produce a definitive biomarker capable of use in isolation in CRC. However, to date, our work represents the most detailed analysis of the key tumour suppressor FOXO3 in CRC and will inform the development of future prospective studies, powered to determine the utility of FOXO3 as a clinical tool.
Conclusion
Our findings support a tumour-suppressing role of FOXO3 in CRC with low FOXO3 expression correlating in particular with more advanced disease stage and shorter disease-free survival. The use of multiple, purpose-designed TMAs also enabled identification of FOXO3 as a potential biomarker of nodal and micrometastatic disease, with clinical applications aiding the early identification of ‘at-risk' node-negative CRC patients who might benefit from selective adjuvant therapy.
Acknowledgments
This work is supported by Medical Research Council project funding to MDB. AHM is supported by grant funding from Wessex Medical Research and Cancer Research UK/RCS (England; C28503/A10013).
The authors declare no conflict of interest.
Footnotes
This work is published under the standard license to publish agreement. After 12 months the work will become freely available and the license terms will switch to a Creative Commons Attribution-NonCommercial-Share Alike 3.0 Unported License.
References
- Baddi L, Benson A., 3rd Adjuvant therapy in stage II colon cancer: current approaches. Oncologist. 2005;10 (5:325–331. doi: 10.1634/theoncologist.10-5-325. [DOI] [PubMed] [Google Scholar]
- Brunet A, Bonni A, Zigmond MJ, Lin MZ, Juo P, Hu LS, Anderson MJ, Arden KC, Blenis J, Greenberg ME. Akt promotes cell survival by phosphorylating and inhibiting a Forkhead transcription factor. Cell. 1999;96 (6:857–868. doi: 10.1016/s0092-8674(00)80595-4. [DOI] [PubMed] [Google Scholar]
- Chen J, Gomes AR, Monteiro LJ, Wong SY, Wu LH, Ng TT, Karadedou CT, Millour J, Ip YC, Cheung YN, Sunters A, Chan KY, Lam EW, Khoo US. Constitutively nuclear FOXO3a localization predicts poor survival and promotes Akt phosphorylation in breast cancer. PLoS One. 2010;5 (8:e12293. doi: 10.1371/journal.pone.0012293. [DOI] [PMC free article] [PubMed] [Google Scholar]
- Dijkers PF, Medema RH, Lammers JW, Koenderman L, Coffer PJ. Expression of the pro-apoptotic Bcl-2 family member Bim is regulated by the forkhead transcription factor FKHR-L1. Curr Biol. 2000a;10 (19:1201–1204. doi: 10.1016/s0960-9822(00)00728-4. [DOI] [PubMed] [Google Scholar]
- Dijkers PF, Medema RH, Pals C, Banerji L, Thomas NS, Lam EW, Burgering BM, Raaijmakers JA, Lammers JW, Koenderman L, Coffer PJ. Forkhead transcription factor FKHR-L1 modulates cytokine-dependent transcriptional regulation of p27(KIP1) Mol Cell Biol. 2000b;20 (24:9138–9148. doi: 10.1128/mcb.20.24.9138-9148.2000. [DOI] [PMC free article] [PubMed] [Google Scholar]
- Fernández de Mattos S, Villalonga P, Clardy J, Lam EW. FOXO3a mediates the cytotoxic effects of cisplatin in colon cancer cells. Mol Cancer Ther. 2008;7 (10:3237–3246. doi: 10.1158/1535-7163.MCT-08-0398. [DOI] [PMC free article] [PubMed] [Google Scholar]
- Gomes AR, Brosens JJ, Lam EW. Resist or die: FOXO transcription factors determine the cellular response to chemotherapy. Cell Cycle. 2008;7 (20:3133–3136. doi: 10.4161/cc.7.20.6920. [DOI] [PubMed] [Google Scholar]
- Itoh N, Semba S, Ito M, Takeda H, Kawata S, Yamakawa M. Phosphorylation of Akt/PKB is required for suppression of cancer cell apoptosis and tumor progression in human colorectal carcinoma. Cancer. 2002;94 (12:3127–3134. doi: 10.1002/cncr.10591. [DOI] [PubMed] [Google Scholar]
- Khaleghpour K, Li Y, Banville D, Yu Z, Shen SH. Involvement of the PI 3-kinase signaling pathway in progression of colon adenocarcinoma. Carcinogenesis. 2004;25 (2:241–248. doi: 10.1093/carcin/bgg195. [DOI] [PubMed] [Google Scholar]
- Kops GJ, Dansen TB, Polderman PE, Saarloos I, Wirtz KW, Coffer PJ, Huang TT, Bos JL, Medema RH, Burgering BM. Forkhead transcription factor FOXO3a protects quiescent cells from oxidative stress. Nature. 2002a;419 (6904:316–321. doi: 10.1038/nature01036. [DOI] [PubMed] [Google Scholar]
- Kops GJ, Medema RH, Glassford J, Essers MA, Dijkers PF, Coffer PJ, Lam EW, Burgering BM. Control of cell cycle exit and entry by protein kinase B-regulated forkhead transcription factors. Mol Cell Biol. 2002b;22 (7:2025–2036. doi: 10.1128/MCB.22.7.2025-2036.2002. [DOI] [PMC free article] [PubMed] [Google Scholar]
- Kress TR, Cannell IG, Brenkman AB, Samans B, Gaestel M, Roepman P, Burgering BM, Bushell M, Rosenwald A, Eilers M. The MK5/PRAK kinase and Myc form a negative feedback loop that is disrupted during colorectal tumorigenesis. Mol Cell. 2011;41 (4:445–457. doi: 10.1016/j.molcel.2011.01.023. [DOI] [PubMed] [Google Scholar]
- Manfredi S, Bouvier AM, Lepage C, Hatem C, Dancourt V, Faivre J. Incidence and patterns of recurrence after resection for cure of colonic cancer in a well defined population. Br J Surg. 2006;93 (9:1115–1122. doi: 10.1002/bjs.5349. [DOI] [PubMed] [Google Scholar]
- Medema RH, Kops GJ, Bos JL, Burgering BM. AFX-like Forkhead transcription factors mediate cell-cycle regulation by Ras and PKB through p27kip1. Nature. 2000;404 (6779:782–787. doi: 10.1038/35008115. [DOI] [PubMed] [Google Scholar]
- Modur V, Nagarajan R, Evers BM, Milbrandt J. FOXO proteins regulate tumor necrosis factor-related apoptosis inducing ligand expression. Implications for PTEN mutation in prostate cancer. J Biol Chem. 2002;277 (49:47928–47937. doi: 10.1074/jbc.M207509200. [DOI] [PubMed] [Google Scholar]
- Myatt SS, Lam EW. The emerging roles of forkhead box (Fox) proteins in cancer. Nat Rev Cancer. 2007;7 (11:847–859. doi: 10.1038/nrc2223. [DOI] [PubMed] [Google Scholar]
- Nemoto S, Finkel T. Redox regulation of forkhead proteins through a p66shc-dependent signaling pathway. Science. 2002;295 (5564:2450–2452. doi: 10.1126/science.1069004. [DOI] [PubMed] [Google Scholar]
- Paik JH, Kollipara R, Chu G, Ji H, Xiao Y, Ding Z, Miao L, Tothova Z, Horner JW, Carrasco DR, Jiang S, Gilliland DG, Chin L, Wong WH, Castrillon DH, DePinho RA. FoxOs are lineage-restricted redundant tumor suppressors and regulate endothelial cell homeostasis. Cell. 2007;128 (2:309–323. doi: 10.1016/j.cell.2006.12.029. [DOI] [PMC free article] [PubMed] [Google Scholar]
- Qi W, Weber CR, Wasland K, Roy H, Wali R, Joshi S, Savkovic SD. Tumor suppressor FOXO3 mediates signals from the EGF receptor to regulate proliferation of colonic cells. Am J Physiol Gastrointest Liver Physiol. 2011;300 (2:G264–G272. doi: 10.1152/ajpgi.00416.2010. [DOI] [PMC free article] [PubMed] [Google Scholar]
- Real PJ, Benito A, Cuevas J, Berciano MT, de Juan A, Coffer P, Gomez-Roman J, Lafarga M, Lopez-Vega JM, Fernandez-Luna JL. Blockade of epidermal growth factor receptors chemosensitizes breast cancer cells through up-regulation of Bnip3L. Cancer Res. 2005;65 (18:8151–8157. doi: 10.1158/0008-5472.CAN-05-1134. [DOI] [PubMed] [Google Scholar]
- Sasaki T, Irie-Sasaki J, Horie Y, Bachmaier K, Fata JE, Li M, Suzuki A, Bouchard D, Ho A, Redston M, Gallinger S, Khokha R, Mak TW, Hawkins PT, Stephens L, Scherer SW, Tsao M, Penninger JM. Colorectal carcinomas in mice lacking the catalytic subunit of PI(3)K gamma. Nature. 2000;406 (6798:897–902. doi: 10.1038/35022585. [DOI] [PubMed] [Google Scholar]
- Schmidt M, Fernandez de Mattos S, van der Horst A, Klompmaker R, Kops GJ, Lam EW, Burgering BM, Medema RH. Cell cycle inhibition by FoxO forkhead transcription factors involves downregulation of cyclin D. Mol Cell Biol. 2002;22 (22:7842–7852. doi: 10.1128/MCB.22.22.7842-7852.2002. [DOI] [PMC free article] [PubMed] [Google Scholar]
- Stahl M, Dijkers PF, Kops GJ, Lens SM, Coffer PJ, Burgering BM, Medema RH. The forkhead transcription factor FoxO regulates transcription of p27Kip1 and Bim in response to IL-2. J Immunol. 2002;168 (10:5024–5031. doi: 10.4049/jimmunol.168.10.5024. [DOI] [PubMed] [Google Scholar]
- Storz P, Döppler H, Copland JA, Simpson KJ, Toker A. FOXO3a promotes tumor cell invasion through the induction of matrix metalloproteinases. Mol Cell Biol. 2009;29 (18:4906–4917. doi: 10.1128/MCB.00077-09. [DOI] [PMC free article] [PubMed] [Google Scholar]
- Tenbaum SP, Ordóñez-Morán P, Puig I, Chicote I, Arqués O, Landolfi S, Fernández Y, Herance JR, Gispert JD, Mendizabal L, Aguilar S, Ramón y Cajal S, Schwartz S, Vivancos A, Espín E, Rojas S, Baselga J, Tabernero J, Muñoz A, Palmer HG. β-catenin confers resistance to PI3K and AKT inhibitors and subverts FOXO3a to promote metastasis in colon cancer. Nat Med. 2012;18 (6:892–901. doi: 10.1038/nm.2772. [DOI] [PubMed] [Google Scholar]
- Tran H, Brunet A, Grenier JM, Datta SR, Fornace AJ, DiStefano PS, Chiang LW, Greenberg ME. DNA repair pathway stimulated by the forkhead transcription factor FOXO3a through the Gadd45 protein. Science. 2002;296 (5567:530–534. doi: 10.1126/science.1068712. [DOI] [PubMed] [Google Scholar]
- Yang JY, Hung MC. A new fork for clinical application: targeting forkhead transcription factors in cancer. Clin Cancer Res. 2009;15 (3:752–757. doi: 10.1158/1078-0432.CCR-08-0124. [DOI] [PMC free article] [PubMed] [Google Scholar]