Abstract
To provide for accurate dosimetry in a 137Cs irradiator, the following were investigated: (1) correct mapping of the irradiator cavity's dose distribution, (2) rotated versus stationary dose rate measurements, (3) exposure-to-dose calibration selection for exposure time calculation, and (4) irradiator-timer error correction. This work introduces techniques to map dose distributions and measure dose rates with new high-sensitivity radiochromic films and a small-volume ion chamber constructed for in-beam, high-intensity gamma irradiation. Measured film distributions were compared to manufacturer-provided data and independent measurements from an ion chamber and TLD-100 chips. Measured film distributions agreed with the manufacturer-provided data in the central-vertical region, but disagreed by as much as 95% in surrounding regions. The independent measurements agreed within 96% with the measured dose distribution. Dose rates varied by: ~11% for a rotational versus stationary setup, by ~10% for the dose-to-medium correction between air and soft tissue, and by ~4–12% for irradiation times from 0.2–0.7 min due to timer error. In conclusion a critical irradiator characterization should be performed, initially, as apart of the acceptance testing of a newly installed irradiator, and periodically as an ongoing quality assurance protocol. We investigated, and recommend as part of a comprehensive irradiator verification protocol, the inclusion of radiochromic film-measured dose distributions, dose rates measured during rotation–when samples are likewise rotated for exposure, timer error corrections for short-time irradiation, and exposure-to-dose corrections that reflect typical sample compositions, e.g., soft tissue or air.
Keywords: 137Cs Irradiator, Radiochromic Film, Gamma Dosimetry, Irradiator Calibration
INTRODUCTION
Due to its predominate gamma-ray (γ-ray) energy (662 keV) and long half life (30 years), the 137Cs irradiator is an ideal irradiator for biological and clinical laboratories that is used for diverse experimental sample populations. Commercially available 137Cs irradiators come in two main configurations: (1) with a fixed source or (2) with a translatable source. With either type, once the source is located in the “on” position, the source is held stationary while exposing a sample; thus, at any time, dt, during beam on, the sample is exposed to a well-defined flux field. With a fixed irradiation geometry, one can sample a “planar fluence,” as defined by Roesch and Attix (Roesch 1968), to create two-dimensional (2-D) flux density of particular planes within the irradiator's cavity. Once measured, the 2-D flux density is converted to isodose mappings used to spatially localize the 100% region of exposure for dose rate measurement and sample placement. Common procedures for mapping dose distributions entail using an ion chamber or arrays of Thermoluminescent Dosimeters (TLDs) to determine the regions of isodose. Isodose curves can are drawn by interpolation of the measured data from the sampled dosimeter points. These methods result in low-resolution mappings (Niroomand-Rad et al. 1998), are laborious, time-consuming, and allow for dosimeter placement inaccuracies in regions of high-dose gradients. With modern high-sensitivity radiochromic films, high-resolution isodose curve mappings can be created for analysis in a matter of hours, compared to what can be days using ion chamber or TLD detectors. Representing the latest technology in radiochromic film dosimetry, GafChromic™ EBT film (International Specialty Products, Wayne, NJ) is a self-developing film that can be handled in normal laboratory or clinical lighting conditions without jacket or sleeve protection (Niroomand-Rad et al. 1998), it has a dose range from 0.01 to 8 Gy (Devic et al. 2005), it can measure 662 keV γ-rays (Butson et al. 2005, Chiu-Tsao et al. 2005, Soares 2006, Rink et al. 2007), it has a near water-equivalent effective atomic number (Devic et al. 2005, Fiandra et al. 2006) of 6.98 (value quoted by the manufacturer), and it can be digitized with a commercial optical transmission flatbed scanner (ISP , Devic et al. 2004, Devic et al. 2005, Lynch et al. 2006, Paelinck et al. 2007). In the following work, EBT film is used to create high-resolution, 2-D dose distribution mappings, which are compared to manufacturer-provided distribution mappings. Also, independent measurements with ion chamber and TLD detectors are used to verify the accuracy of EBT film.
A dose rate value is the second key piece of information necessary to accurately operate a 137Cs irradiator. A dose rate is used for calculating irradiation exposure times, (“beam on” times), for the delivery of a prescribed dose. The manufacturer provided no dose rate information for the irradiator; the users of the irradiator, or their support staff, must obtain this information. Establishing a dose rate value is a well understood technique, namely: measure dose at a point and divide the dose by the time of measurement. However, It will be shown in this work that the accuracy of delivering a prescription dose is related to the methodology employed to measure the dose rate. For example, typical samples are irradiated while rotated to deliver uniform doses to small samples, (e.g., small animals, Petri dishes, blood vials, cell cultures, etc). Due to the rotational motion of the sample, at time t during irradiation different points within the sample are exposed to different dose rates as a function of their distance, d, from the source, due to the 1/d2 law of radiation propagation. In effect, the samples are exposed to an average dose rate over the area transversed during irradiation. In this work, two dose rate measurement methodologies are compared: (1) dose rates measured during rotation, and (2) dose rates measured while stationary. Additionally, exposure-to-dose conversion factors for air and soft tissue were compared to assess overall delivered dose accuracy, and the need for timer error correction was investigated.
MATERIALS
The irradiator employed in these experiments was a Mark I-68A 137Cs irradiator (JL Shepherd and Associates, San Fernando, CA). The irradiator was housed in a compact, self-shielded module (81 cm in diameter × 198 cm tall), Fig. 1(a), with an interior irradiation cavity (31 cm wide × 36 cm tall × 15.5 cm deep), Fig. 1(b). The source material is in the form of two Cesium Chloride (CsCl) sources, which have the consistency of a solid that are triply encapsulated in stainless steel containers and are welded to a translatable rod. The sources are stacked in a vertical column ~21 cm apart within a cylindrical source guide. The lowest source is ~7 cm from the irradiator cavity floor during “beam on”. The sources (referred to cumulatively as the source) reside in a large vault at the base of the irradiator during times of “beam off”. The source moves into position by compressed air during “beam on” to expose the irradiation cavity with gamma radiation. The source transitions from the storage vault to the “beam on” position in 1.14 ± 0.05 s negating any need for raise time dose corrections when calculating exposure time. Dose distribution and dose rates were measured in three locations. Each location corresponded to the location of a motor shaft used to rotate the sample turntables. The three motor shafts were labeled positions 1, 2, and 3 where position 1 is the closest to the source and position 3 the furthest, Fig. 1(c).
Fig. 1.
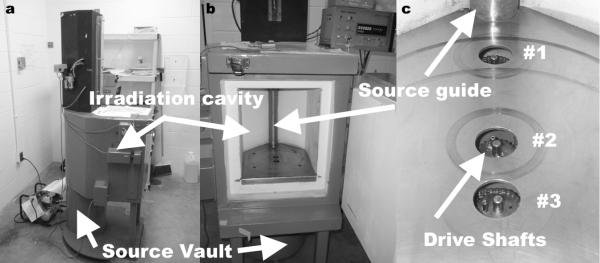
The Mark I-68A 137Cs irradiator is shown from the side demonstrating the location of the source vault in relationship to the irradiation cavity, (a). The source resides in the source vault while in the “off” position and moves up along the source guide, (b), into the “on” position to expose the irradiation cavity with gamma radiation. The manufacturer provided dose distribution mappings are delineated at three specific cross-sectional planes that correspond with three drive shafts used to rotate sample turntables, (c).
EBT films irradiated at positions 1, 2, and 3 were from lot numbers 36076-002I, 36348-02I, and 35322-002I, respectively. All film samples were handled in accordance with the recommendations set forth in the American Association of Physicists in Medicine's TG-55 report (Niroomand-Rad et al. 1998). All films were digitized pre- and post-exposure using a 48-bit transmission/reflection flatbed photo scanner with its accompanying scanning software (Perfection V700 PHOTO, EPSON, Japan). The scanner employs a white, cold-cathode fluorescent lamp for light transmission, and a Matrix CCD™ line scanner photoelectric device for image digitization. The digitized EBT film was analyzed using an in-house algorithm created in Matlab (7.0 Release 14, Mathworks, Natick, MA).
Due to 137Cs's γ-ray energy of 662 keV, a 2 mm buildup plate of Polymethyl Methacrylate (Plexiglas) material was used for charged particle equilibrium (CPE). The buildup plate thickness was calculated using continuous slowing down approximation values for electrons with energies of 662 keV in Plexiglas (Attix 1986).
A 0.18 cc ion chamber (10×5-0.18, Radcal, Monrovia, CA) with an ion chamber monitor (9015, Radcal) was used for calibration purposes, independent film distribution verification, and dose rate measurements. The ion chamber's active volume (with build up cap) has a diameter of 14 mm and a length of 19 mm. The overall length of the chamber is 45 mm (active volume plus stem). 3 × 3 × 1 mm Harshaw TLD-100 (LiF:MgTi) chips (Thermo Scientific, Franklin, MA) were also used for an independent comparison of the measured EBT film and manufacturer-provided dose distributions. The TLDs were first tested for uniformity; all chips that deviated > 2 SD from the batch mean were discarded. TLDs were annealed using a TLD-annealing furnace (168-300, Radiation Products Design, Inc., Albertville, MN), and read using a TLD reader (Harshaw 5500, Thermo Fisher Scientific, Inc., Waltham, MA) with WinREMS software. Nitrogen gas was introduced during the readout cycle to reduce non-radiation-induced signals (Horwitz 1984).
METHODS
Comparison of Film, Manufacturer's Data, and Independent Dosimeters
The data provided by the manufacturer (provided at the time of irradiator installation September 16th, 1989) was compared with measured isodose plots using vertical and horizontal line profiles. Vertical profiles along the central axis of the manufacturer-provided and EBT-measured dose distributions were sampled from the top of the irradiator cavity to the cavity floor. The horizontal profiles consisted of seven points measured from left to right of the irradiator cavity at two heights: 11 and 19 cm from the cavity floor. The manufacturer's plots were sampled at the central point of each isodose region. TLD and ion chamber data were used to verify the EBT film dose response at position 2. EBT film that is digitized > 10 min after exposure dose not measure a dose rate dependence (Ali et al. 2005, Rink et al. 2005, Fuss et al. 2007, Rink et al. 2007), thus, the results of the ion chamber and TLD measured dose responses at position 2 represent a similar response to dose by EBT film at positions 1 and 3. The ion chamber and TLD detectors were placed inside empty (air filled) 50 ml plastic vials and were positioned on top of a Styrofoam block, Fig. 2(a-b), allowing exposure measurements in air. A beam attenuation of 0.6% was introduced by the vials and was accounted for in the calculation of dose:
| (1) |
where X is the exposure reading measured by the ion chamber that was temperature and pressure corrected, κ is the ion chamber correction factor, provided by the University of Wisconsin Accredited Dosimetry Calibration Laboratory on June 7th 2007, α is the plastic vial attenuation correction, and is the exposure-to-dose correction factor for energy (E) and medium (med):
| (2) |
where 0.869 cGy R−1 is a value derived from the definition of the roentgen (R) and W̄air/e (Hendee 1970), and μen/ρ were mass energy attenuation coefficients retrieved from the NIST website (Hubbell and Seltzer 2004). This work compares two fFactors: (1) air-0.869 cGy R−1, and (2) soft tissue-0.9620 cGy R−1 (E=662 keV).
Fig. 2.
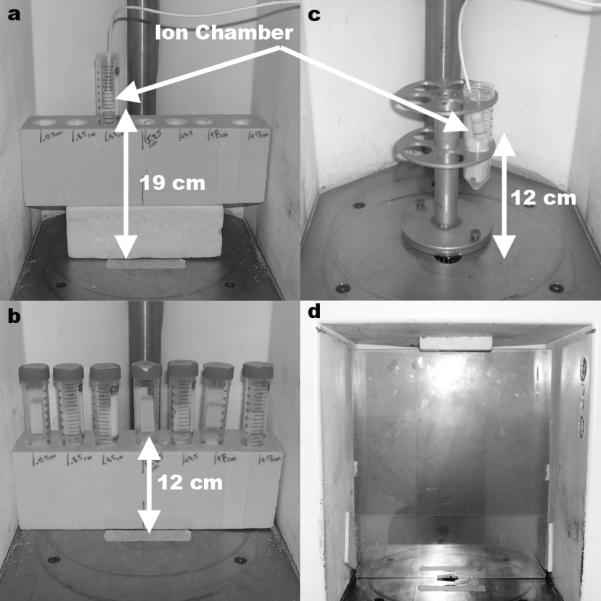
Two horizontal dose profiles were used to verify film results. Horizontal profiles were measured at 12 cm and 19 cm from the irradiator floor and centered over position 2. Each horizontal profile was independently measured with both an 0.18 cc ion chamber, (a), and TLD chips, (b), suspended in 50 ml plastic vials across seven locations. The dose rate measurements used a rotating vial platform and a 0.18 cc ion chamber suspended in a 50 ml plastic vial 12 cm above the irradiator floor, (c). Dose distribution mappings were measured at each position (position 2 shown) using a Plexiglas buildup plate and four EBT films, (d).
Dose Rate Calculations
Stationary dose rates were measured while the ion chamber was suspended in air, 12 cm above the irradiator cavity floor, and centered above the three positions. Source-to-chamber distances (SCD) for the stationary setup were: position 1- 5 cm, position 2-15 cm and position 3-20 cm. Rotationally measured dose rates were measured with the ion chamber suspended in air using a platform (10 cm diameter × 15 cm tall) designed to hold 50 ml vials, Fig. 2(c). The ion chamber was placed inside an air filled 50 ml vial at 12 cm above the irradiator cavity floor and rotated at a radial distance of 3.5 cm from the center of each position. Exposure readings were converted to dose using two dose-to-medium correction factors one for air and another for soft tissue. Air and soft tissue correction factors were calculated using Eqn. 2. Dose was sampled over a range of 1 – 40 Gy, which corresponded to exposure times from 0.09 – 8.80 min. Actual exposure times, tactual, were calculated to measure the presence of timer error using the following:
| (5) |
where is the mean dose rate calculated from exposure times greater than used to deliver a dose of 20 Gy (20 Gy represents a dose delivered for a long exposure time where timing error is minimal), and is the calculated dose rate from the irradiator timer's clock readout, tirradiator, and the ion chamber measured dose.
The measured dose rate values were also corrected for ion chamber placement outside of the 100% isodose for positions 1 and 3. The ion chamber placed 12 cm from the irradiator cavity floor for position 1 was located within the 103% isodose and for position 3 it was located within the 98% isodose.
Film Digitization
EBT film measures 8 × 10 in (20.3 × 25.4 cm). The irradiation cavity measured 31 × 36 cm, which required several films to provide coverage of the cross-sectional area of the irradiation cavity. A central 30 × 35 cm of the irradiator cavity was chosen for dose distribution measurements. Four films were placed at each corner of the cross-section overlapping in the central region, Fig. 2(d). Each film was irradiated separately to avoid attenuation artifacts from overlapping films. The films were combined using Matlab for one continuous EBT film data set. Measured dose distributions were normalized to match the normalization patterns of the manufacturer-provided isodose plots. General points of normalization correlated to locations of maximum dose response. Each film was scanned in transmission mode at a resolution of 72 pixels in−1 (0.4 mm pixels), with no color corrections, and saved in uncompressed Tagged Image File Format. EBT film has a maximum light absorption peak at 635 nm (Devic et al. 2007). All films were digitized in RGB color file format and the red (R) channel (Thomas et al. 2003) was extracted for analysis in Matlab. The scanner's transmission lamp illuminates only during previewing and scanning. To “warm-up” the scanner ten blank scans were performed in succession and then discarded. The EBT film was placed on the scanner bed and repeatedly scanned five times (Paelinck et al. 2007). The five scans were averaged to increase the signal to noise by decreasing the random noise component inherent to each scan. A light-inhomogeneity correction map was created for the field-of-view of a transmission scan using pre-exposed EBT film (pre-scan). The pre-scanned EBT film was used to correct for light scatter caused by the difference in the refractive index between the active layer's particles and the matrix that contains the particles§§ and dead pixels in the CCD camera (Fiandra et al. 2006, Paelinck et al. 2007, van Battum et al. 2008). The refractive index and the size of the active layer particles are essentially unchanged when irradiated. The effects of light scatter can be corrected using the pre-scan as a correction map§§. To create a correction map, the pre-scanned film's median pixel value was divided, pixel-by-pixel, by the pre-scan:
| (3) |
where xcorr is the pixel-by-pixel corrected pre-scan, xi is the ith pixel value of x, and x̄ is the median of x. The pre- and post-exposed films were carefully aligned on the scanner bed by physical blocks for proper registration for light scatter correction for the post-exposed films (post-scans). EBT film, once irradiated, darkens such that the film's optical density (OD) proportionately grows with exposure (Niroomand-Rad et al. 1998, Butson et al. 2005, Cheung et al. 2005, Rink et al. 2005). The film was allowed to stabilize for > 6 hr before it was digitized and converted to OD (Niroomand-Rad et al. 1998, Cheung et al. 2005, Devic et al. 2005). Radiochromic film doesn't require chemical processing to “fix” the measured radiation pattern, but instead requires time for the inherent chemical process to stabilize before digitization.
Dose Calibration
Calibration curves for film and TLD dose responses were created. The film and TLD responses to radiation were calibrated to dose to relate their respective responses to the manufacturer's data. Calibration curves for film and TLD chips were established using the following acquisition setups. For the film, an OD to dose calibration curve was created from seven pieces of EBT film. Each piece was irradiated at different exposure levels along side an ion chamber. A Plexiglas buildup plate was used with the EBT films to provide proper CPE. The films were set atop a Styrofoam block so to be surrounded by air with the surface of the films set perpendicular to the main axis of the 137Cs source, Fig. 3(a). The films used for calibration were allowed the same amount of film stabilization time for equal OD growth as the dose distribution films. Once digitized, the calibration films were treated for light scatter and scanner light inhomogeneities, as described in Eqn. 3, and converted to OD. Similarly, two TLDs were placed next to an ion chamber atop a Styrofoam block within a custom built device, designed to hold the TLDs in air above the block and provide proper buildup for CPE, Fig. 3(b).
Fig. 3.
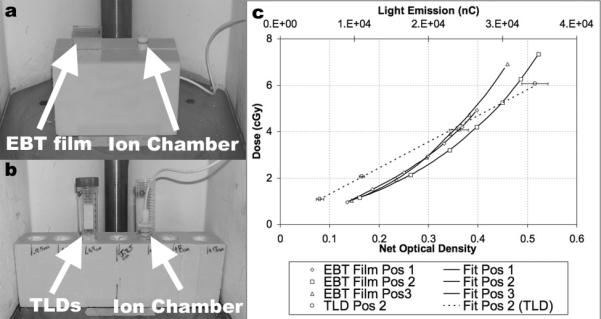
Calibration curve experimental setups: EBT film, (a), and TLDs, (b), required a Styrofoam block to place the dosimeters 12 cm above the irradiator floor to provide a free-in-air irradiation environment. Plexiglas buildup plates were used for film and TLD dosimeters, and dosimeters used in TLD calibration curve setup were corrected for beam attenuation due to the 50 ml plastic vials used to suspend dosimeters in air. Resulting calibration curves, (c), were developed at positions 1, 2, and 3 with net optical density to dose for films and light emission to dose for TLDs, (TLDs were only calibrated at position 2).
The films OD values were plotted versus dose and the data were fit using an exponential curve of the form: Doseair(cGy) = A · exp(B · x). The average, of the three film positions’ goodness of fit was calculated to be 0.9934, Fig. 3(c). TLD light emission values were plotted versus dose and the data were fit using a linear-regression curve:
| (4) |
where TLD(nC) is an average of two TLD light responses, as measured by the TLD reader. The goodness of fit for the TLD dose calibration curve was calculated to be 0.9975, Fig. 3(c).
RESULTS AND DISCUSSION
Film Dose Distribution Measurements
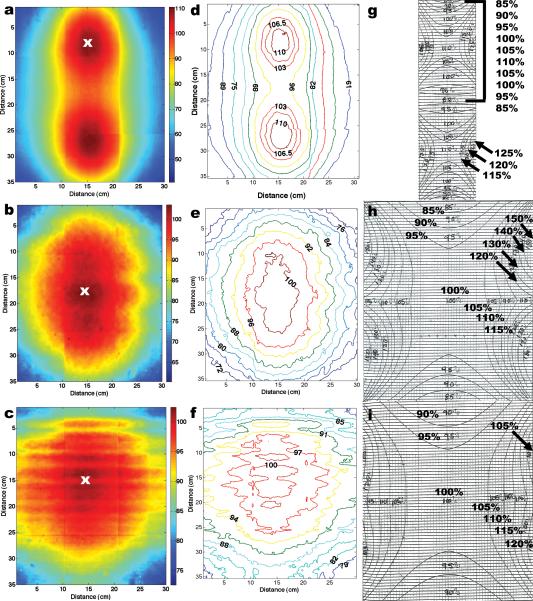
The resulting measured dose distributions are shown in, Fig. 4(a-c), the film's dose distribution converted to isodose in, Fig. 4(d-f), and the manufacturer-provided isodose distributions, Fig. 4(g-i), for positions 1, 2, and 3. By qualitative inspection, the central-vertical 10 cm of the three measured isodose plots agree with the manufacturer-provided isodose plots. However, the surrounding gradient regions in the plots show a substantial difference between the measured and manufacture's data. The measured dose gradients were incrementally lower, in relative dose, compared to the manufacturer-provided values, which incrementally grew larger in the surrounding regions. Typically, samples are placed in the central 100% isodose region to fully deliver the desired prescription dose. An accurate spatial mapping of the 100% dose region is critical for proper sample placement. For position 2, the EBT film's 100% isodose region measured 10 cm (left to right) and 16 cm (top to bottom) compared to the manufacture's data which measured 14 × 18 cm, respectively. For position 3, EBT film's 100% isodose region measured 10 × 12 cm compared to the manufacture's data, which measured 14 × 18 cm, respectively. Overall, the measured central 100% isodose area measured smaller than depicted by the manufacturer-provided plots, which information leads to the possibility of limiting the overall size of samples used in the irradiator.
Fig. 4.
Dose distributions measured with EBT films, (a-c), were converted to isodoses, (d-f), and compared with the manufacturer-provided isodose data, (g-i). The measured dose distributions were normalized at the location marked by the “x”, in (a-c). EBT measured isodose data averaged an agreement of < 2% overall in the central-vertical axis for all three positions with the manufacturer-isodose data. However, a marked difference was observed in the gradient regions surrounding the central axis when the two sets of data were compared.
Some artifacts can be seen in the overall measured dose distribution mappings: horizontal and vertical lines. These lines are located at film boundary interfaces, and are due, predominantly, to intra-batch differences in film response. Film response artifacts had a negligible effect on the conversion from full dose distributions to isodose plots. Recently, International Specialty Products introduced EBT films in sheets of 14 × 17 in (35.6 × 43.2 cm), which would allow one radiochromic film to be cut to fit the full cross section of the irradiation cavity and remove film response artifacts altogether. However, the larger radiochromic films would require a larger scanner, at a significantly greater cost, to digitize the film.
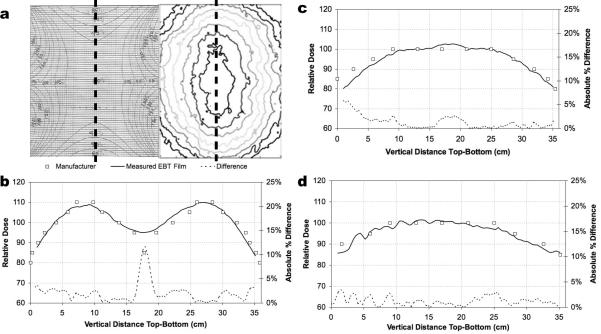
Vertical profiles were used to quantify the agreement along the central-vertical axis where the measured EBT film and manufacturer-provided plots showed the greatest agreement, Fig. 5(a). The high spatial resolution of the film allowed for one continuous sampling along the central-vertical axis whereas the manufacturer-provided data was discretely sampled in the central region of each isodose. The manufacturer-provided data was interpolated to allow a point-by-point absolute difference comparison with the measured EBT film data. A comparison of the measured to the manufacturer-provided profiles at position 1, Fig. 5(b), differed by an average of 2.1%, with a point of maximum difference of 11.7%, position 2, Fig. 5(c), differed by an average of 1.3%, with a point of maximum difference of 5.9%, and position 3, Fig. 5(d), differed by an average of 1.2% with a point of maximum difference of 3.4%. EBT line profiles measured at positions 1 and 2 exhibited low noise (smooth) profile as was expected due to a high uniformity of construction of the film along its long-axis (1.3% variation as quoted by the film manufacturer). Position 3 showed greater variability in the top ~16 cm of the measured data. These undulations were investigated and were reproduced over three separate experiments, and are shown to be a measured effect of the flux pattern at position 3.
Fig. 5.
Vertical line profiles of the manufacturer-provided and EBT film measured data were compared along the central-vertical axis, (a), for positions 1, (b), 2 (c), and 3 (d). Relative dose difference plots showed general agreement within 95% between measured versus manufacturer data along the vertical central axis.
Two horizontal profiles, one measured 11 cm and the other 19 cm from the irradiator floor, were used to compare EBT film with the manufacturer-provided data, and two independent dosimeters: an ion chamber, and TLD chips. Only two horizontal line profiles at position 2 were chosen for a comparison since the manufacturer-provided plots are quadrant-symmetrical, (i.e., symmetrical about the central axis, top to bottom and left to right), and EBT film does not exhibit differences in dose when delivered at different dose rates. Therefore, films at position 1 and 3 will behave similarly to the film at position 2 making more than two line profiles sampled along the upper and lower horizontal quadrants and at different positions in the irradiator redundant for an independent measurement. EBT film, and manufacturer-provided data, agreed only in the central 10 cm of the dose distribution, which corresponded to the 100% isodose region, but not in the peripheral gradient regions. The 11 cm profile, Fig. 6(a), measured an average difference between EBT film and the manufacturer-provided dose profiles of 23.9% with a point of maximum difference of 94.5%, a difference between EBT film and the TLD dose profiles of 3.6% with a point of maximum difference of 9.2%, and a difference between EBT film and ion chamber profiles of 1.7% with a point of maximum difference of 4.9%. The 19 cm profile. Fig. 6(b), measured an average difference between EBT film and the manufacturer-provided dose profiles of 14.9% with a point of maximum difference of 46.2%, a difference between EBT film and TLD dose profiles of 2.0% with a point of maximum difference of 8.6%, and a difference between EBT film and ion chamber profiles of 2.5% with a point of maximum difference of 5.7%.
Fig. 6.
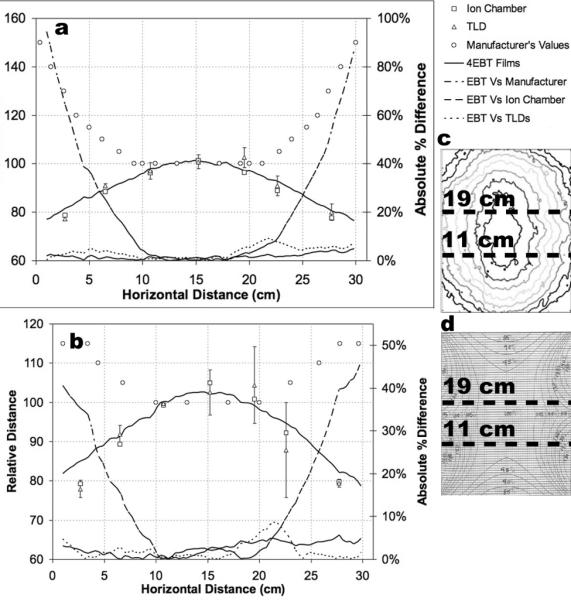
Horizontal line profiles at 11 cm (a) and 19 cm (b) from the irradiator cavity floor sampled the measured distribution (c) and the manufacturer-provided distribution (d). Horizontal line profiles compared relative film dose distributions with manufacturer-provided dose distributions along with two independent dosimeters—TLDs and an ion chamber. Dashed lines depict absolute percent difference between EBT film and the other data sets.
The results of this radiochromic film dosimetry project have highlighted the necessity for irradiator quality assurance verification. Initial acceptance testing should be preformed on all irradiators, when first installed, before scientific and clinical samples are exposed. Additionally,verification of dose distributions should be an ongoing procedure with the integration of radiochromic film dosimetry as a quick and efficient process for measuring large areas of dose distribution for isodose mapping. Radiochromic film dosimetry is a relatively low cost procedure that can be used to verify the mechanical movement of the 137Cs source, and measure areas of isodose for correct sample placement. Specialized irradiation protocols requiring sample placement within dose gradient regions can facilitate a delivery of a lower dose to points surrounding the target by placing the points inside of the dose gradient region. To facilitate such protocols correct mappings of gradient regions are essential, but are difficult to map using conventional measuring systems, such as ion chamber and TLD chips, because they do not provide proper spatial resolution (Niroomand-Rad et al. 1998) whereas modern radiochromic films with spatial resolution quoted at > 1200 lines mm−1 (McLaughlin et al. 1991) can make possible accurate measurements in gradient regions. Moreover, radiochromic film dosimetry provides for archival imaging and data storage (Niroomand-Rad et al. 1998) for long term quality assurance verification.
Dose Rate Measurements
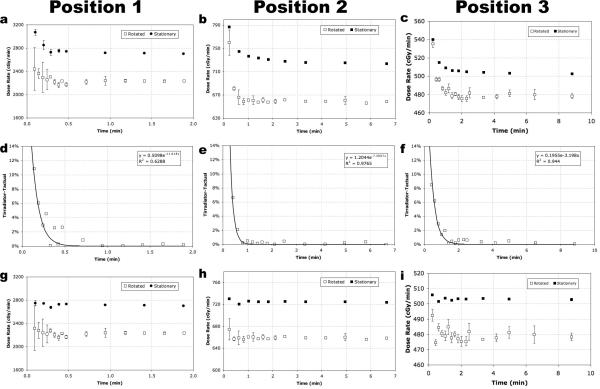
Measured dose rates for positions 1, 2, and 3 are shown in Fig. 7. Dose rates measured during rotation versus stationary exhibit differences of 18%, 10%, and 5% at positions 1, 2, and 3, respectively, Fig. 7(a-c). Differences between rotated and stationary dose rate values represent the magnitude of error of a delivered dose when the delivery method, (e.g., sample is rotated), is inconsistently paired with the dose rate measurement methodology, (e.g., measured while stationary).
Fig. 7.
Measured dose rate values for positions 1, 2, and 3 measure an artificial rise in value do to timer error (a-c). Timer error was measured for a range of times of 0.09-8.80 min. Timer error measured the largest effect for short-time exposures (d-f). Dose rate values corrected for timer error (g-i) exhibit a consistent dose rate value over time with expected experimental fluctuation where greater experimental fluctuation is seen in the dose rate values measured during rotation. Dose rate plots represent values that have been corrected for soft tissue attenuation only.
Larger fluctuations in measured dose rate values are seen in the rotated instead of the stationary dose rate values. Fluctuations in the rotated data were predominately measured for short-exposure times and are caused by the inconsistent pattern of rotation of the ion chamber used for consecutive measurements, namely: the ion chamber rotates at 10 rev min−1, and starts and stops measuring exposure values at random positions. Fluctuation about the average dose rate is a natural stochastic effect where the larger error bars for short exposure time values, measured at exposure times of ~0.1 min, (one full revolution of the ion chamber), are due to insufficient sampling of the flux by the ion chamber. It is understood if many more measurements were taken at the shorter-time values a better-sampled measurement would show a lower deviation in value. However, under realistic experimental conditions, samples are not afforded the option for multiple exposures for a more accurate delivery of a prescribed dose using a short exposure time, and thus the values at ~0.1 min represents a lower-limit threshold for accurately delivering prescribed doses during rotation.
An artificial rise in dose rate was seen in Fig. 7(a-c) due to an irradiator timer error. To quantify the magnitude of the error, the true exposure time, tactual, was calculated using the measured absorbed dose value divided by the measured true dose rate, , (Eqn. 5). The was determined from the linear component of the dose rate plots in, Fig. 7(a-c), which values corresponded to dose rates measured for long exposure times, (~> doses of 20 Gy). The absolute percent difference between tactual and the time the irradiator displayed, tirradiator, was plotted in, Fig. 7(d-f). Since the magnitude of the timer error is larger for short exposure times an exponential curve was fit to the data. By extracting fitted curves of the modeled timer error, over a large range of exposure times, future exposure times can be mathematically corrected, Fig. 7(g-i), to produce the correct time for calculating a prescribed dose, (e.g., for position 2 an exposure time of 0.2 min should be delivered with a time of 0.23 min).
Dose rate values were separately corrected for dose to air and dose to soft tissue. Dose rate values corrected for air at positions 1, 2, and 3 were 2027.0 ± 36.9, 599.0 ± 1.6, and 434.7 ± 2.8 cGy min−1, respectively, and dose rate values corrected for soft tissue at positions 1, 2, and 3 were 2233.6 ± 40.6, 660.1 ± 4.2, and 479.9 ± 3.0 cGy min−1, respectively. Dose rate values for all three irradiator positions that were corrected for soft tissue attenuation where 10.2% higher than the same dose rate values corrected for air-attenuation. 10.2% represents the difference in the mass energy attenuation correction factors of soft tissue and air used to convert exposure-to-dose (Eqn. 2). Dose rate values are used to calculate irradiator “on time.” If a soft tissue target is to be irradiated in a 137Cs irradiator, but a dose rate corrected for air is used to calculate the irradiator “on time” a sample overdose on the order of ~10% will occur. It is important to consider the overall composition of the samples irradiated and which attenuation correction factor should be used in the exposure-to-dose conversion. The average sample composition should be used to choose the appropriate dose rate corrected values. Allowance can be made for mixed sample populations in the form of different dose rate tables for different sample types.
CONCLUSION
With the latest innovations in high-sensitivity radiochromic film and in-beam ion chamber design, an accurate characterization of a 137Cs irradiator is possible. The necessity to utilize modern dosimetric tools has been shown (1) in the measurement and comparison of radiochromic film isodose plots to manufacturer-provided isodose plots, and (2) in the proper measurement of dose rate values considering irradiator timer error, sample exposure method, (rotation versus stationary), and for the exposure-to-dose correction factors. The independent measurements of the ion chamber and TLD chips verified the sensitivity of the EBT film to the 137Cs gamma-ray energy of 662 keV, and validated the use of the radiochromic film with a commercially available flatbed scanner for a modern dosimetry approach to provide accurate 2-D dose distribution mappings. Furthermore, measuring the dose rate requires careful correction for timer error and dose-to-medium correction. Timer error must be corrected using independently modeled timer-error curves on a position-by-position basis since dose rate varies by 1/d2. Improper dose-to-medium correction can lead to irradiation discrepancies as was shown by the comparison of air and soft tissue correction factors. We conclude that initial irradiator acceptance testing and regular irradiator calibration protocols should include dose distribution verifications measured with modern, 2-D high-resolution radiochromic films, and dose rates properly measured to correspond to irradiation protocol methodologies.
ACKNOWLEDGMENT
The authors would like to thank Richard Youngblood for his editorial help with the manuscript. This study was supported by the National Institute of Allergy and Infectious Diseases grant No. U19 A1067798-020
Footnotes
Effects of Light Scattering by Films on the Performance of CCD Scanners, unpublished report accessed from the manufacturer's website: http://online1.ispcorp.com/_layouts/Gafchromic/index.html
REFERENCES
- Ali I, Williamson JF, Costescu C, Dempsey JF. Dependence of radiochromic film response kinetics on fractionated doses. Appl Radiat Isot. 2005;62:609–17. doi: 10.1016/j.apradiso.2004.07.014. [DOI] [PubMed] [Google Scholar]
- Attix F. Introduction to Radiological Physics and Radiation Dosimetry. WILEY-VCH. 1986 [Google Scholar]
- Butson MJ, Cheung T, Yu PK. Absorption spectra variations of EBT radiochromic film from radiation exposure. Phys Med Biol. 2005;50:N135–N140. doi: 10.1088/0031-9155/50/13/N02. [DOI] [PubMed] [Google Scholar]
- Butson MJ, Cheung T, Yu PK. Weak energy dependence of EBT gafchromic film dose response in the 50kVp-10MVp range. Appl Radiat Isot. 2005;64:60–62. doi: 10.1016/j.apradiso.2005.07.002. [DOI] [PubMed] [Google Scholar]
- Cheung T, Butson MJ, Yu PK. Post-irradiation colouration of Gafchromic EBT radiochromic film. Phys Med Biol. 2005;50:N281–5. doi: 10.1088/0031-9155/50/20/N04. [DOI] [PubMed] [Google Scholar]
- Chiu-Tsao ST, Ho Y, Shankar R, Wang L, Harrison LB. Energy dependence of response of new high sensitivity radiochromic films for megavoltage and kilovoltage radiation energies. Med Phys. 2005;32:3350–4. doi: 10.1118/1.2065467. [DOI] [PubMed] [Google Scholar]
- Devic S, Seuntjens J, Hegyi G, Podgorsak EB, Soares CG, Kirov AS, Ali I, Williamson JF, Elizondo A. Dosimetric properties of improved GafChromic films for seven different digitizers. Med Phys. 2004;31:2392–401. doi: 10.1118/1.1776691. [DOI] [PubMed] [Google Scholar]
- Devic S, Seuntjens J, Sham E, Podgorsak EB, Schmidtlein CR, Kirov AS, Soares CG. Precise radiochromic film dosimetry using a flat-bed document scanner. Med Phys. 2005;32:2245–53. doi: 10.1118/1.1929253. [DOI] [PubMed] [Google Scholar]
- Devic S, Tomic N, Pang Z, Seuntjens J, Podgorsak EB, Soares CG. Absorption spectroscopy of EBT model GAFCHROMIC film. Med Phys. 2007;34:112–8. doi: 10.1118/1.2400615. [DOI] [PubMed] [Google Scholar]
- Fiandra C, Ricardi U, Ragona R, Anglesio S, Giglioli FR, Calamia E, Lucio F. Clinical use of EBT model GafchromicTM film in radiotherapy. Med Phys. 2006;33:4314–4319. doi: 10.1118/1.2362876. [DOI] [PubMed] [Google Scholar]
- Fuss M, Sturtewagen E, Wagter CD, Georg D. Dosimetric characterization of GafChromic EBT film and its implication on film dosimetry qualtiy assurance. Phys Med Biol. 2007;52:4211–4225. doi: 10.1088/0031-9155/52/14/013. [DOI] [PubMed] [Google Scholar]
- Hendee W. Medical Radiation Physics. Yearbook Medical Publishers; 1970. [Google Scholar]
- Horwitz YS. Thermoluminescence and Thermoluminescent Dosimetry. CRC Press; 1984. [Google Scholar]
- Hubbell JH, Seltzer SM. Tables of x-ray mass attenuation coefficients and mass energy-absorptioin coefficients (Version 1.4) 2004 [Google Scholar]
- Lynch BD, Kozelka J, Ranade MK, Li JG, Simon WE, Dempsey JF. Important considerations for radiochromic film dosimetry with flatbed CCD scanners and EBT GAFCHROMIC film. Med Phys. 2006;33:4551–6. doi: 10.1118/1.2370505. [DOI] [PubMed] [Google Scholar]
- McLaughlin WL, Chen YD, Soares CG, Miller A, Van Dyke G, Lewis DF. Sensitometry of the response of a new rediochromic film dosimeter to gamma radiation and electron beams. Nucl. Instrum. Methods Phys. Res. A. 1991;302:165–176. [Google Scholar]
- Niroomand-Rad A, Blackwell CR, Coursey BM, Gall KP, Galvin JM, McLaughlin WL, Meigooni AS, Nath R, Rodgers JE, Soares CG. Radiochromic film dosimetry: recommendations of AAPM Radiation Therapy Committee Task Group 55. American Association of Physicists in Medicine. Med Phys. 1998;25:2093–115. doi: 10.1118/1.598407. [DOI] [PubMed] [Google Scholar]
- Paelinck L, De Neve W, De Wagter C. Precautions and strategies in using a commercial flatbed scanner for radiochromic film dosimetry. Phys Med Biol. 2007;52:231–42. doi: 10.1088/0031-9155/52/1/015. [DOI] [PubMed] [Google Scholar]
- Rink A, Vitkin IA, Jaffray DA. Characterization and real-time optical measurements of the ionizing radiation dose response for a new radiochromic medium. Med Phys. 2005;32:2510–6. doi: 10.1118/1.1951447. [DOI] [PubMed] [Google Scholar]
- Rink A, Vitkin IA, Jaffray DA. Energy dependence (75 kVp to 18 MV) of radiochromic films assessed using a real-time optical dosimeter. Med Phys. 2007;34:458–63. doi: 10.1118/1.2431425. [DOI] [PubMed] [Google Scholar]
- Rink A, Vitkin IA, Jaffray DA. Intra-irradiation changes in the signal of polymer-based dosimeter (GAFCHROMIC EBT) due to dose rate variations. Phys Med Biol. 2007;52:N523–N529. doi: 10.1088/0031-9155/52/22/N03. [DOI] [PubMed] [Google Scholar]
- Roesch WCaA FH. Basic concepts of dosimetry. Radiation Dosimetry I. 1968 [Google Scholar]
- Soares CG. New developments in radiochromic film dosimetry. Radiation Protection Dosimetry. 2006;120:100–106. doi: 10.1093/rpd/nci698. [DOI] [PubMed] [Google Scholar]
- Thomas G, Chu RYL, Rabe F. A study of GafChromic XR type R film response with reflective- type densitometers and economical flatbed scanners. Journal of applied clinical medical physics. 2003;4:307–314. doi: 10.1120/jacmp.v4i4.2501. [DOI] [PMC free article] [PubMed] [Google Scholar]
- van Battum LJ, Hoffmans D, Piersma H, Heukelom S. Accurate dosimetry with GafChromicTM EBT film of a 6 MV photon beam in water: What level is achievable? Med Phys. 2008;35:704–716. doi: 10.1118/1.2828196. [DOI] [PubMed] [Google Scholar]


