Abstract
Aedes aegypti (L.) is the principal mosquito vector of dengue fever, the second-most deadly vector-borne disease in the world. In Ae. aegypti and other arthropod disease vectors, genetic markers can be used to inform us about processes relevant to disease spread, such as movement of the vectors across space and the temporal stability of vector populations. In late 2009, 27 locally acquired cases of dengue fever were reported in Key West, FL. The last dengue outbreak in the region occurred in 1934. In this study, we used 12 microsatellite loci to examine the genetic structure of 10 Ae. aegypti populations from throughout the Florida Keys and Miami to assess gene flow along the region’s main roadway, the Overseas Highway. We also assessed temporal genetic stability of populations in Key West to determine whether the recent outbreak could have been the result of a new introduction of mosquitoes. Though a small amount of geographic genetic structure was detected, our results showed high overall genetic similarity among Ae. aegypti populations sampled in southeastern Florida. No temporal genetic signal was detected in Key West populations collected before and after the outbreak. Consequently, there is potential for dengue transmission across southeastern Florida; renewed mosquito control and surveillance measures should be taken.
Keywords: Aedes aegypti, Florida Keys, population genetics, dengue, microsatellites
The population genetic structure of arthropod vectors is of interest in several contexts relevant to disease control. The degree of genetic differentiation among populations is largely controlled by the amount and distance of gene flow (migration) among them, and can be influenced by factors such as the ecology and behavior of the vector, ecological context of the populations (e.g., continuously distributed vs. patchy), longevity of adults, etc. Epidemiologically important factors relevant to genetic structure include spread of vectors carrying disease organisms, spread of genes for insecticide resistance, spread of released sterility factors, and potential spread of transgenes conferring resistance to disease transmission.
Aedes aegypti (L.) bears the common name “the yellow fever mosquito,” but today, it is of increasing medical importance as the major vector of dengue fever as well as Chikungunya. Previous work on the genetic structure of this species has revealed high genetic structure (large genetic differences) among even geographically close populations (Brown et al. 2011a). More typically, however, significant genetic differentiation is observed among populations at least 10s of kilometers apart, though this varies greatly among regions of the species’ broad distribution. Given that Ae. aegypti is a human commensal, the degree of human movement (commerce, etc.) has a major influence in determining the distance among genetically structured mosquito populations (Gorrochotegui–Escalante et al. 2000, 2002; Bosio et al. 2005). Generally, Ae. aegypti populations in highly populated areas with frequent movement among towns and cities, largely determined by highway systems and other forms of transportation, are less genetically differentiated than populations in rural regions or otherwise isolated areas where humans and their goods rarely move long distances.
In recent years, there have been an increasing number of dengue-infected travelers to the United States; between 2006 and 2008, there were an estimated 574 travel-related introductions of dengue to the United States (Franco et al. 2010). However, other than a few isolated cases along the Texas–Mexico border, there were no reports of locally acquired dengue cases in the continental United States since 1946 until a September 2009 outbreak in Florida (Trout et al. 2010). In 2009, there were 27 reported cases of dengue fever, and additional cases were reported in the area in the subsequent year (Trout et al. 2010). The reemergence of dengue occurred in Key West, FL, the southernmost point of the Florida Keys.
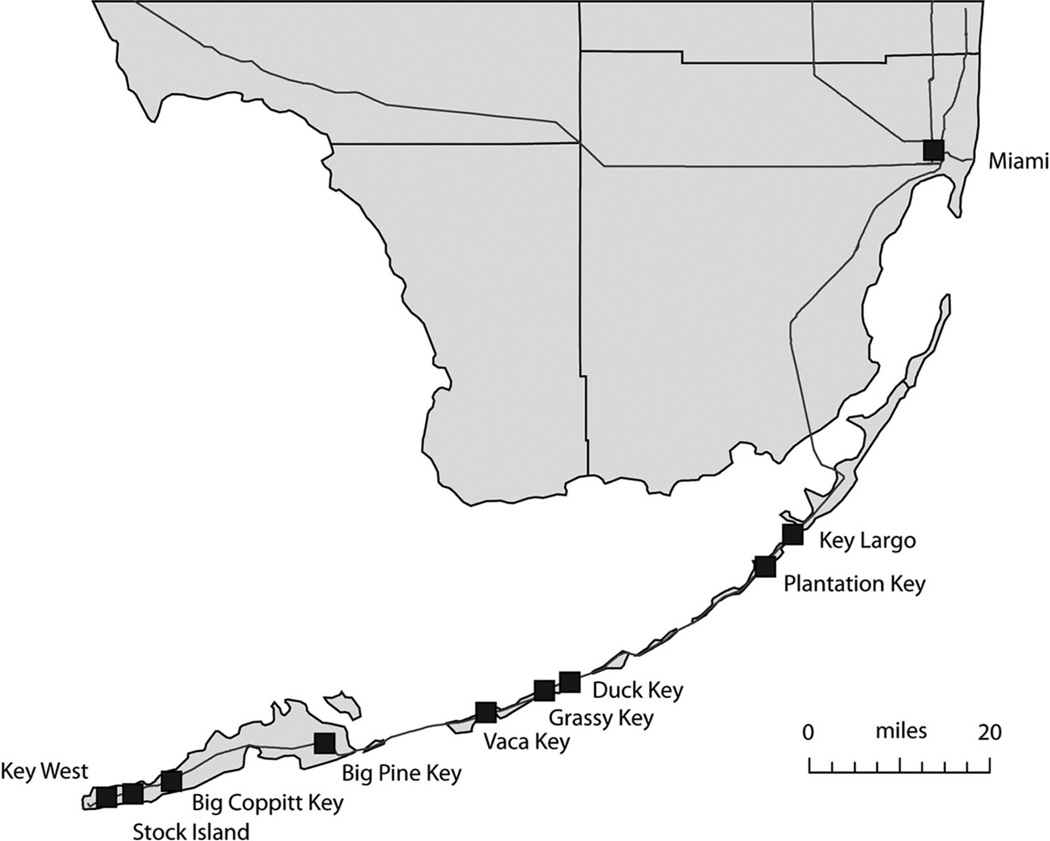
The Florida Keys are an interesting setting in which to study genetic structure of Ae. aegypti; the region is composed of a 160 km one-dimensional linear chain of islands or “keys” (Fig. 1). These keys are connected by a well-traveled highway (US1) that continues into Miami and the Palm Beach area, and the subtropical climate encourages year-round infestation with Ae. aegypti populations. We have sampled nine Ae. aegypti populations in this chain, along with one mainland Florida sample, Miami, as a comparison. Here, we report the pattern of genetic differentiation determined by 12 highly polymorphic microsatellites, and assess gene flow along the island chain and temporal genetic stability of populations in Key West before and after the start of the recent outbreak.
Fig. 1.
Map of collection sites in southern Florida.
Materials and Methods
Mosquito Collections
Ae. aegypti larvae were collected from nine islands spanning the Florida Keys between December 2008 and February 2009 (Table 1; Fig. 1). The collection cities are located all along the Overseas Highway (US1), the major roadway that connects the archipelago to the mainland (Wilkinson 2011). Four of the islands are located in the Lower Keys (as defined by the 7 mile bridge on US1), including Key West, Stock Island, Big Coppitt Key, and Big Pine Key. Three islands, Vaca Key, Duck Key, and Grassy Key, are considered the Middle Keys. The remaining two islands, Plantation Key and Key Largo, are in the Upper Keys. Collections were also made in Miami, FL, to provide a nearby mainland comparison, and from Key West in 2011 to provide a temporal comparison on that island postdengue outbreak. All collections were taken from various artificial containers of standing water in the area.
Table 1.
Population information, including collection site, region, no. of samples (N), allelic richness (AR), and private allelic richness (PAR)
| Collection site | Region | N | AR | PAR |
|---|---|---|---|---|
| Key West (2011) | Lower Keys | 57 | 4.28 | 0.18 |
| Key West (2009) | Lower Keys | 31 | 4.52 | 0.19 |
| Stock Island | Lower Keys | 36 | 3.83 | 0 |
| Big Coppitt Key | Lower Keys | 12 | 3.37 | 0 |
| Big Pine Key | Lower Keys | 59 | 4.09 | 0.04 |
| Vaca Key | Upper Keys | 59a | 3.95 | 0.08 |
| Grassy Key | Upper Keys | 47 | 3.79 | 0.09 |
| Duck Key | Upper Keys | 15 | 3.88 | 0.08 |
| Plantation Key | Upper Keys | 19 | 3.86 | 0.03 |
| Key Largo | Upper Keys | 22 | 3.8 | 0.09 |
| Miami | Mainland | 47b | 4.3 | 0.13 |
Forty two of the Vaca Key samples were previously analyzed in Brown et al. (2011a).
Previously analyzed in Brown et al. (2011b).
Genetic Methods
Genomic DNA was extracted from individual Ae. aegypti mosquito samples using Nucleospin Tissue kits (Macherey–Nagel) and following the manufacturer’s protocols. Brown et al. (2011a) described the 12 polymorphic microsatellite loci that were used to characterize the genetic make-up of the population samples. Primer sequences and polymerase chain reaction (PCR) conditions used for amplification of all loci are described in Brown et al. (2011a) and Slotman et al. (2007).
Analyses
All analyses were carried out using data from 12 polymorphic microsatellite loci. The program GENEPOP v4.1 (Rousset 2008) was used to test the microsatellite loci in all populations for deviations from Hardy–Weinberg equilibrium (HWE). GENEPOP was also used to test all locus-by-locus pairs in each population for linkage disequilibrium (LD). Markov chain parameters were set at 10,000 dememorizations, 20 batches, and 5,000 iterations per batch for both HWE and LD.
Average allelic richness and private allelic richness for each population were obtained using the program HP-RARE (Kalinowski 2004, 2005). HP-RARE uses rarefaction to correct for sample size. The program sampled 12 individuals (24 allele copies) at random from each population to match the smallest population sample size. A regression of allelic richness on straight-line geographic distance from the northernmost site, Miami, was performed to assess whether diversity decreases away from the mainland, down the island chain. The same analysis was performed using private allelic richness.
To assess genetic differences among populations, population pairwise FST values were calculated in GENEPOP v4.1 (Rousset 2008). We also calculated chord distances between each pair of populations in Genetix v4.05 (Belkhir et al. 2004), which were used to create an unrooted neighbor-joining tree in MEGA5 (Tamura et al. 2011) to examine genetic clustering among populations based on geography or other factors. The Bayesian clustering method implemented in the program STRUCTURE v. 2.3 (Pritchard et al. 2000) was used to assign individual mosquitoes to genetic groups based on similarity across the 12 microsatellite loci. For the phylogeography, we conducted four independent runs of STRUCTURE for K = 1 through K = 12 on individuals from all 11 Ae. aegypti populations, including both time points (i.e., 2009 and 2011) for Key West. For each run, we used a burn-in value of 100,000 followed by 500,000 iterations, and allowed for admixture and correlated allele frequencies.
Gene flow among populations was assessed in two different ways. First, isolation by distance was tested using Isolde in GENEPOP, which considers the correlation between genetic differentiation and geographic distance. Next, MIGRATE v3.2.16 (Beerli 1998; Beerli and Felsenstein 1999, 2001) was used to examine the directionality and magnitude of gene flow among six collection sites along the Keys and in Miami using a maximum-likelihood coalescent approach. Preliminary analyses were used to estimate starting parameters for theta and M. The final simulation was run with a Brownian motion model for 20 short chains (50,000 trees sampled) and three long chains (200,000 trees sampled). The first 10,000 steps in each chain were used as a burn-in, and a static heating scheme with four temperatures (1.00, 1.50, 3.00, and 10000.00) was used with a swapping interval of 1. Results were averaged over three replicates.
Results
As expected with previously validated markers, the vast majority of loci were in HWE across most populations. Of 144 population-by-locus tests, seven (4.9%) deviated significantly from HWE after sequential Bonferonni correction (Supp. Table 1 [online only]). Of these, five tests were significant because of an excess of homozygotes, likely because of null alleles. Similarly, 50 out of 792 (6.3%) tests for linkage disequilibrium were significant after correction. However, no two loci were consistently linked across populations.
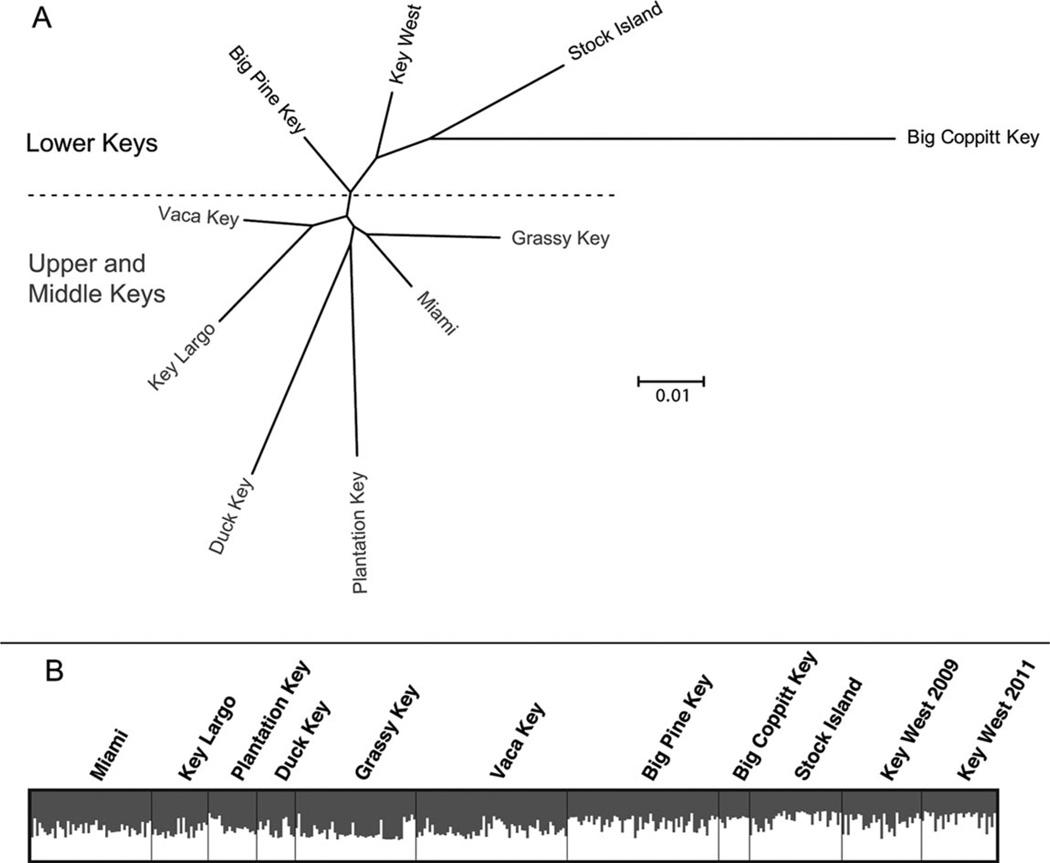
Population pairwise FST values ranged from 0.0043 to 0.1714, with an average of 0.0633 (Supp. Table 2 [online only]). In the context of global populations of Ae. ae. aegypti, these genetic distances are relatively small (Brown et al. 2011a). Additionally, small sample sizes (<50) often inflate FST values. Therefore, it is likely that FST values are even smaller across the region than those reported here. A small degree of clustering based on geography was apparent in a neighbor-joining cluster analysis based on population pairwise chord distances. Mosquito populations from the Lower Keys appeared more genetically similar to each other than to those from the Upper and Middle Keys (plus Miami), which also clustered together (Fig. 2A). No geographic patterns were detected using the Bayesian clustering algorithm implemented in the program STRUCTURE (Fig. 2B). All populations from the Keys, as well as Miami, could not be split into more than one genetic group, and there was no notable genetic change between temporal collections in Key West (Fig. 2B). Additionally, no significant pattern of Isolation by Distance was detected (P = 0.761).
Fig. 2.
Cluster analyses of Ae. aegypti populations in southern Florida. (A) Unrooted neighbor-joining cluster analysis based on population pairwise chord distances (Upper/Middle and Lower Keys division), (B) STRUCTURE bar plot, K = 2. Each vertical bar represents a single individual. The height of each color represents the probability of assignment to that cluster.
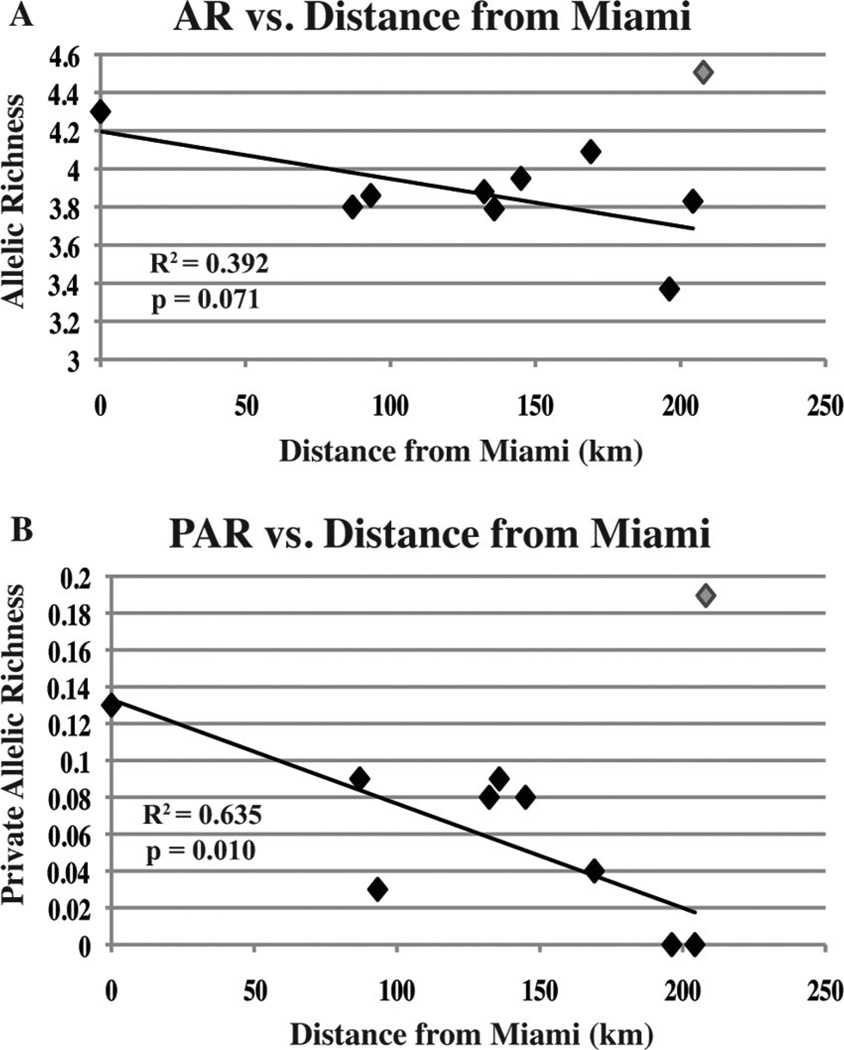
Measures of genetic diversity were highest in Miami and Key West, the northernmost and southernmost populations studied (Table 1). Because of the spike in diversity in Key West, no significant relationships were detected when AR and PAR for each population were plotted against geographic distance from Miami. However, when Key West was removed from analyses, private allelic richness decreased significantly (R2 = 0.635; P = 0.010) moving out from Miami south through the Keys (Fig. 3B). Although no significant relationship was detected in standard allelic richness down the Keys, a nearly significant (R2 = 0.392; P = 0.071) trend was found (Fig. 3A).
Fig. 3.
Regression of corrected average allelic richness (A) and private allelic richness (B) for each population versus geographic distance from Miami (kilometers). The data point for Key West appears in gray and was not included in the analysis.
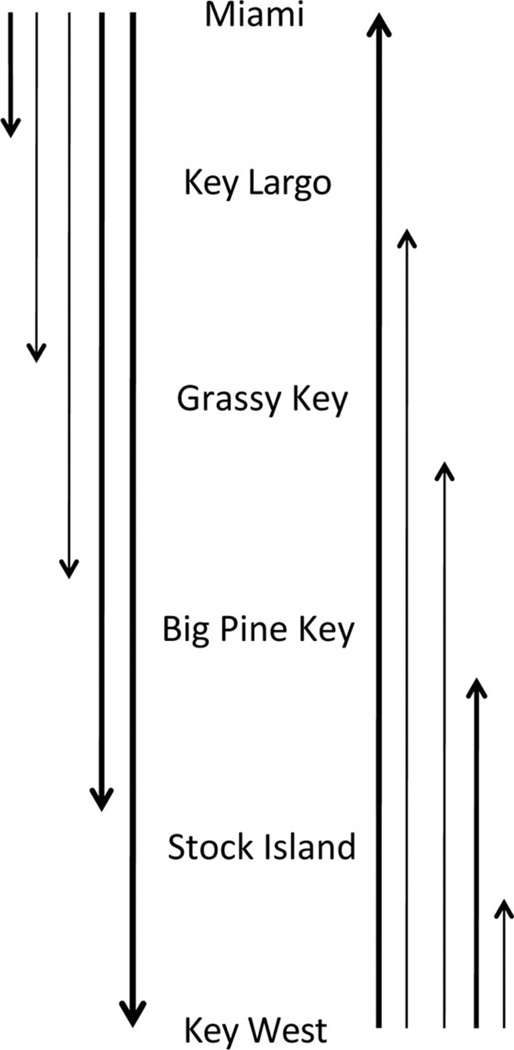
An analysis of migration in the program MIGRATE supported patterns detected in analyses of allelic richness through space. Though migration in this analysis was detected up and down the Keys with little apparent directionality, the magnitude of migration was much higher between Miami and Key West (in both directions) than to or from intermediate points (Fig. 4, full migration matrix in Supp. Table 3 [online only]).
Fig. 4.
Relative migration rates (as indicated by arrow thickness) between select sites in the Florida Keys and Miami.
Discussion
Taken together, the data suggest high genetic similarity among Ae. aegypti populations throughout the Florida Keys and southeast Florida. Our results are indicative of high levels of gene flow up and down the island chain. Considering Ae. aegypti mosquitoes only fly 10–800 m in the course of their lifetimes (da Costa–Ribeiro et al. 2007), passive migration, such as road transport along the Overseas highway, likely explains these patterns. The analysis of migration, along with observed patterns of genetic diversity, suggest that increased gene flow among Ae. aegypti populations occurs between Miami and Key West, the northernmost and southernmost points of our study. High levels of tourist and commercial (i.e., trucks) traffic between these two points may largely explain our findings. Additionally, many of the islands between the mainland and Key West, particularly the Middle Keys, have relatively few microhabitats for Ae. aegypti because of small island size and patterns of land use, and consequently have more effective mosquito control. Therefore, the mosquito populations in these areas are likely smaller, lower in genetic diversity, and generally more isolated from gene flow from both Key West and the mainland.
The neighbor-joining cluster plot revealed a slight association of genetic structure with geography among the Florida Keys Ae. aegypti populations (Fig. 2A). Again, traffic patterns may help to elucidate these weak geographic relationships. For example, there is considerable commuter travel within the Lower Keys between Key West and islands north up to Big Pine Key. It is, however, important to reemphasize that these signals of geographic differentiation are weak, and there is high overall similarity among Ae. aegypti populations in southeast Florida.
In addition to the findings of genetic similarity from the STRUCTURE plot, correlation between genetic structure and geographic distances was not supported by the isolation by distance model. Overall, the data demonstrate that the relatively large geographic distance between Key West and Miami does not prove to be a migratory barrier for Ae. aegypti populations, but it does not rule out some influence of geography on the genetic structure of Florida Keys populations. Additionally, the STRUCTURE plot and a low pairwise FST (0.0274) indicate that mosquitoes collected in Key West post dengue outbreak (2011) are genetically very similar to those collected in early 2009, before the emergence of the disease. Therefore, it is unlikely that an introduction of more competent mosquitoes from elsewhere was linked to the emergence of dengue in the region.
The relative genetic homogeneity of Ae. aegypti populations in the region suggests that gene flow, and therefore migration of mosquitoes, is common in South Florida. For future research on the source of the virus in the region, examination of Ae. aegypti populations from locations in direct trade with Key West may be informative. Furthermore, our analyses of migration suggest that there is high potential for movement of mosquitoes and disease from Key West straight into the urban hub of Miami. Future studies of vector competence, ecology, and control would be an excellent step toward understanding Ae. aegypti population dynamics and the potential for dengue spread in Florida.
Overall, the findings of this study suggest that a risk for dengue viral infection may exist for Floridians and other Americans, and as such, renewed prevention measures should be taken. The results support revived mosquito surveillance and control programs in Key West, FL, and beyond. In addition, increased awareness of dengue among American health practitioners and the wider American public may be a crucial to improve treatment and reporting of the disease. Because few cases of dengue fever have been reported outside of Key West, it remains to be seen whether migration of Ae. aegypti in parts of Florida will contribute to future dengue outbreaks in those regions.
Supplementary Material
Acknowledgments
We thank Mario Porcelli, Walter Tabachnick, Jennifer Simpson, and Larry Hribar for their help in providing mosquito samples. J.E.B. was supported by National Institutes of Health (NIH) Predoctoral Training in Genetics (T32-GM07499-33) and the Yale Institute for Biospheric Studies (YIBS), Center for Field Ecology pilot grant. The rest of the study was supported by NIH R01 AI046018 (J.R.P.) and a Yale Science and Engineering Association (YSEA) undergraduate research grant (V.O.).
References Cited
- Beerli P. Estimation of migration rates and population sizes in geographically structured populations. In: Carvalho G, editor. Advances in Molecular Ecology. NATO-ASI Workshop Series. The Netherlands: IOS Press, Amsterdam; 1998. pp. 39–53. [Google Scholar]
- Beerli P, Felsenstein J. Maximum-likelihood estimation of migration rates and effective population numbers in two populations using a coalescent approach. Genetics. 1999;152:763–773. doi: 10.1093/genetics/152.2.763. [DOI] [PMC free article] [PubMed] [Google Scholar]
- Beerli P, Felsenstein J. Maximum likelihood estimation of a migration matrix and effective population sizes in n subpopulations by using a coalescent approach. Proc. Natl. Acad. Sci. U.S.A. 2001;98:4563–4568. doi: 10.1073/pnas.081068098. [DOI] [PMC free article] [PubMed] [Google Scholar]
- Belkhir K, Borsa P, Chikhi L, Raufaste N, Bonhomme F. Laboratoire Génome, Populations, Interactions, CNRS UMR 5000, Université de Montpellier II. France: Montpellier; 2004. GENETIX 4.05, logiciel sous Windows TM pour la génétique des populations. [Google Scholar]
- Bosio CF, Harrington LC, Jones JW, Sithiprasasna R, Norris DE, Scott TW. Genetic structure of Aedes aegypti populations in Thailand using mitochondrial DNA. Am. J. Trop Med. Hyg. 2005;72:434–442. [PubMed] [Google Scholar]
- Brown JE, McBride CS, Johnson P, Ritchie S, Paupy C, Bossin H, Lutomiah J, Fernandez–Salas I, Ponlawat A, Cornel AJ, et al. Worldwide patterns of genetic differentiation imply multiple ‘domestications’ of Aedes aegypti, a major vector of human diseases. Proc. R. Soc. B. 2011a;278:2446–2454. doi: 10.1098/rspb.2010.2469. [DOI] [PMC free article] [PubMed] [Google Scholar]
- Brown JE, Scholte EJ, Dik M, Den Hartog W, Beeuwkes J, Powell JR. Aedes aegypti mosquitoes imported into The Netherlands, 2010. Emerg. Infect Dis. 2011b;17:2335–2337. doi: 10.3201/eid1712.110992. [DOI] [PMC free article] [PubMed] [Google Scholar]
- da Costa–Ribeiro MCV, Lourenco–De-Oliveira R, Failloux AB. Low gene flow of Aedes aegypti between dengue-endemic and dengue-free areas in southeastern and southern Brazil. Am. J. Trop. Med. Hyg. 2007;77:303–309. [PubMed] [Google Scholar]
- Franco C, Hynes NA, Bouri N, Henderson DA. The dengue threat to the United States. Biosecur. Bioterror. 2010;8:273–276. doi: 10.1089/bsp.2010.0032. [DOI] [PubMed] [Google Scholar]
- Gorrochotegui–Escalante N, Munoz MD, Fernandez–Salas I, Beaty BJ, Black WC. Genetic isolation by distance among Aedes aegypti populations along the northeastern coast of Mexico. Am. J. Trop. Med. Hyg. 2000;62:200–209. doi: 10.4269/ajtmh.2000.62.200. [DOI] [PubMed] [Google Scholar]
- Gorrochotegui–Escalante N, Gomez–Machorro C, Lozano–Fuentes S, Fernandez–Salas I, Munoz MD, Farfan–Ale JA, Garcia–Rejon J, Beaty BJ, Black WC. Breeding structure of Aedes aegypti populations in Mexico varies by region. Am. J. Trop. Med. Hyg. 2002;66:213–222. doi: 10.4269/ajtmh.2002.66.213. [DOI] [PubMed] [Google Scholar]
- Kalinowski ST. Counting alleles with rarefaction: private alleles and hierarchical sampling designs. Conserv. Genet. 2004;5:539–543. [Google Scholar]
- Kalinowski ST. HP-RARE 1.0: a computer program for performing rarefaction on measures of allelic richness. Mol. Ecol. Notes. 2005;5:187–189. [Google Scholar]
- Pritchard JK, Stephens M, Donnelly P. Inference of population structure using multilocus genotype data. Genetics. 2000;155:945–959. doi: 10.1093/genetics/155.2.945. [DOI] [PMC free article] [PubMed] [Google Scholar]
- Rousset F. GENEPOP’ 007: a complete re-implementation of the GENEPOP software for Windows and Linux. Mol. Ecol. Resour. 2008;8:103–106. doi: 10.1111/j.1471-8286.2007.01931.x. [DOI] [PubMed] [Google Scholar]
- Slotman MA, Kelly NB, Harrington LC, Kitthawee S, Jones JW, Scott TW, Caccone A, Powell JR. Polymorphic microsatellite markers for studies of Aedes aegypti (Diptera : Culicidae), the vector of dengue and yellow fever. Mol. Ecol. Notes. 2007;7:168–171. [Google Scholar]
- Tamura K, Peterson D, Peterson N, Stecher G, Nei M, Kumar S. MEGA5: molecular evolutionary genetics analysis using maximum likelihood, evolutionary distance, and maximum parsimony methods. Mol. Biol. Evol. 2011;28:2731–2739. doi: 10.1093/molbev/msr121. [DOI] [PMC free article] [PubMed] [Google Scholar]
- Trout A, Baracco G, Rodriguez M, Barber J, Leal A, Radke E, Weis K, Stanek D, Stark L, Blackmore C, Gallagher G, Hunsperger E, Tomashek K, Gregory C, Sauber–Schatz E. Locally acquired dengue: Key West, Florida, 2009–2010. MMWR Morb. Mortal Wkly. Rep. 2010;59:577–581. [PubMed] [Google Scholar]
- Wilkinson J. History of overseas highway. Florida Keys History Museum. 2011 ( http://www.keyshistory.org/osh.html)
Associated Data
This section collects any data citations, data availability statements, or supplementary materials included in this article.


