

Abstract
Precise measurement of low enrichment of stable isotope labeled amino-acid tracers in tissue samples is a prerequisite in measuring tissue protein synthesis rates. The challenge of this analysis is augmented when small sample size is a critical factor. Muscle samples from human participants following an 8 hour intravenous infusion of L-[ring-13C6]phenylalanine and a bolus dose of L-[ring-13C6]phenylalanine in a mouse were utilized. Liquid Chromatography tandem mass spectrometry (LC/MS/MS), Gas Chromatography tandem mass spectrometry (GC/MS/MS) and Gas Chromatography/Mass spectrometry (GC/MS) were compared to the Gas Chromatography-Combustion-Isotope Ratio mass spectrometry (GC/C/IRMS), to measure mixed muscle protein enrichment of [ring13C6]phenylalanine enrichment. The sample isotope enrichment ranged from 0.0091 to 0.1312 Molar Percent excess (MPE). As compared with GC/C/IRMS, LC/MS/MS, GC/MS/MS and GC/MS showed coefficients of determination of R2 = 0.9962 and R2 = 0.9942, and 0.9217 respectively. However, the precision of measurements (coefficients of variation) for intra-assay are 13.0%, 1.7%, 6.3% and 13.5% and for inter-assay are 9.2%, 3.2%, 10.2% and 25% for GC/C/IRMS, LC/MS/MS, GC/MS/MS and GC/MS respectively. The muscle sample sizes required to obtain these results were 8μg, 0.8μg, 3μg and 3μg for GC/C/IRMS, LC/MS/MS, GC/MS/MS, and GC/MS respectively. We conclude that LC/MS/MS is optimally suited for precise measurements of L-[ring-13C6]phenylalanine tracer enrichment in low abundance and in small quantity samples.
Keywords: L-[ring-13C6]phenylalanine enrichment, GC/C/IRMS, LC/MS/MS, GC/MS/MS/, GC/MS, mixed muscle proteins, amino-acid tracer, tandem mass spectrometry
INTRODUCTION
Skeletal muscle wasting or sarcopenia occurs in many conditions including older people that contributes to many age related disabilities and metabolic problems. In order to understand the underlying mechanisms of sarcopenia and metabolic abnormalities of skeletal muscle, stable isotope tracers of amino acids have been extensively used 1,2,3,4. The advent of stable isotope labeled tracer techniques, together with the availability of sensitive mass spectrometers, has permitted the direct measurement of muscle fractional protein synthesis rates. This has made it possible to study the impact of exercise 5, hormones 6 and aging 7 on human muscle protein metabolism. The direct observation of stable isotope tracer incorporation into muscle proteins during a continuous infusion of 13C or 15N labeled aminoacids (AA) was first achieved using isotope ratio magnetic sector mass spectrometry (IRMS)1. This technique has been considered as a gold standard in tracer studies of muscle protein metabolism 7. Muscle tissue possesses one of the most metabolically stable protein matrices, with overall slow turnover rate of cellular proteins, as compared to other tissues. Tracer incorporation is extremely low, even after several hours of the tracer AA infusion. The use of dual inlet IRMS systems coupled with isolation of the AA via preparative LC or GC allowed measurement of very low tracer to tracee ratios (TTR) in tissues of interest 8,9,10,11, but had certain drawbacks. These included: 1) large sample requirements (20-50mg tissue) and hence collection of the amino acid via preparative techniques, 2) positional requirements of the 13C-label in the tracer i.e. the 1-carbon position in the amino acid was necessary to allow liberation of C as CO2 via the ninhydrin reaction 12. The advent of in-line gas chromatography-combustion-isotope ratio mass spectrometers (GC/C/IRMS) brought higher throughput and lower sample requirements with at least comparable mass sensitivity (especially when multi-labeled amino acids such as L-[ring-13C6]phenylalanine, L[13C6]leucine, etc., are employed). GC/MS systems have also been employed for many years to measure low enrichments of amino acids by utilizing multiple labeled stable isotope tracers such as [2H5]phenylalanine or [2H5]lysine 11, 13, 14. In this approach rather than monitor the m0 to m+5 ratio for [2H5]phenylalanine, for example, the natural isotope signal at m+2 to labeled m+5 is monitored. The tracer to tracee ratio is reduced by several orders of magnitude leading to better precision at levels of enrichment in the 0.005 – 0.1% ranges. This can only be accomplished by injecting at least 40μg-100μg of muscle tissue equivalent. The new generation of triple-quadrupole mass spectrometers connected to Gas or Liquid chromatographs (GC/MS/MS or LC/MS/MS respectively) extends the performance of single quadrupole instruments by offering better selectivity and sensitivity, albeit at an increased cost, and can approach the isotopic performance offered by GC/C/IRMS when multiple labeled stable isotope tracers are employed. The use of LC/MS as a replacement for GC/C/IRMS in the analysis of free fatty acid metabolism utilizing [U-13C]palmitate as a tracer has been shown that the LC based tandem instrument was able to match the precision and accuracy of low level enrichment measurements of the IRMS15. The amount of sample required was substantially less with much shorter run times. The use of GC/ or LC/MS/MS in the study of tracer incorporation into muscle proteins also purports to offer these advantages.
Metabolism studies of individual proteins are of great importance and are the focus of many investigators. High enrichment of precursor amino acids present in plasma or tissue fluid during tracer infusions can be precisely measured with the use of single quad mass spectrometers connected to GC or HPLC. Low enrichment encountered in individual muscle proteins such as myosin heavy chain (MHC) requires the use of highly sensitive mass spectrometers or GC/C/IRMS. Purification of multiple plasma and muscle proteins by multidimensional chromatography16 and 2-dimensional electrophoresis17 allow measurement of synthesis rate of multiple proteins. However small sample size is a limitation that requires a sensitive technique. Although tandem quadrupole mass spectrometers connected to GC or LC and GC/C/IRMS are extensively used it has never been demonstrated the relative merits of any of these approaches. Thus the aim of present study was to compare the measurement of tracer enrichment of a small sample (<10mg tissue) using GC/C/IRMS, LC/MS/MS, GC/MS/MS and GC/MS techniques, in mixed muscle proteins (MMP) after a bolus tracer dose or a continuous tracer infusion. We used L-[ring-13C6]phenylalanine, as this amino-acid quickly equilibrates between plasma and tissue fluid compartments during both the continuous infusion and bolus dose experiments. We studied both human (primed, continuous infusion) and rat tissues (bolus dose of tracer) samples for the analysis.
MATERIALS AND METHODS
Samples
Studies were approved by the Institutional Animal Care and Use Committee (IACUC) and the Mayo Clinic Institutional Review Board. Mixed muscle protein samples were obtained from two independent studies. In the first study, healthy volunteers received a primed continuous infusion of L-[ring-13C6]phenylalanine (0.75 mg/kg/h with 0.75 mg/kg priming dose) 18. Muscle samples were obtained by percutaneous needle biopsy from the vastus lateralis muscle 8. In the second study, male rats were injected with a flooding dose of L- [ring-13C6]phenylalanine (15 mg/kg). Final sample set taken for analysis included muscle tissues from both experiments and with mixed-muscle-protein enrichment values ranging from 0.0091 molar percent excess (MPE) to 0.1321MPE (as measured by GC/C/IRMS). MPE represents [13C] label above the background (MPE=13C/12C +13C)×100). All samples were prepared as follows. Tissue samples weighing approximately 10mg were taken. Mixed muscle proteins were isolated as previously described 19. The mixed muscle proteins precipitate from the isolation was hydrolyzed overnight at 110°C using 6M HCl. Liberated amino acids were purified using Biorad AG-50W×8 cation exchange resin. The final column eluent containing the amino acids was evaporated to dryness using a SpeedVac (Thermo, USA) and subsequently dissolved in 100μl of 0.1M HCL.
Preparation of the calibration curve
One calibration curve was prepared, and then divided into 4 different aliquots for subsequent use on each of the mass spectrometers in this proposed comparison. Appropriate amounts of cold (unlabeled) phenylalanine (Sigma-Aldrich, St. Louis, MO) and L-[ring-13C6]phenylalanine (Cambridge Isotopes, Andover, MA) were mixed together to obtain different enrichment points spanning from 0 to 0.1 MPE. For GC/C/IRMS measurements, amino acids were prepared as their trimethyl acetyl, methyl esters according to the method of Metges et al 20 and the residues dissolved in ethyl acetate. For LC/MS/MS samples were prepared as the isobutyl ester derivative according to a method by Ford et al 21 and dissolved in running buffer A. For both the GC/MS and GC/MS/MS analyses, heptafluorobutyryl isobutyl esters of the amino acids were used.
GC/C/IRMS analysis
The level of enrichment of L-[ring-13C6]phenylalanine derived from 5% of the hydrolyzed mixed-muscle-protein sample was analyzed using a ThermoFisher DeltaPlus Isotope Ratio mass spectrometer (IRMS) (Bremen, Germany) fitted with an Agilent 5890 Series II GC with on-line oxidation and reduction furnaces. One μl of sample was injected in splitless mode at an injection port temperature of 250°C. The peaks were resolved on a 60m × 0.32mm ID × 1μm film J&W DB-5MS capillary column. Temperature program ramp was set from 60 to 300°C at 15°C/min. Helium was used as the carrier gas with a constant flow of 1ml/min. Any amino acid eluting from the gas chromatograph was converted to CO2 and N2 prior to entry into the IRMS. The enrichment of the tracer was measured by monitoring the ratio of 13CO2 to 12CO2 in the IRMS and referenced to a calibration curve, prepared as described in paragraph 2.2. Values of delta per mil given by the IRMS were transformed into MPE for final comparison with other methods. The amount of sample injected per run was comparable with phenylalanine contained in 8μg of muscle tissue. Figure 1 shows a GC/C/IRMS chromatogram of a mixed muscle protein sample with 0.0091 MPE.
Figure 1.
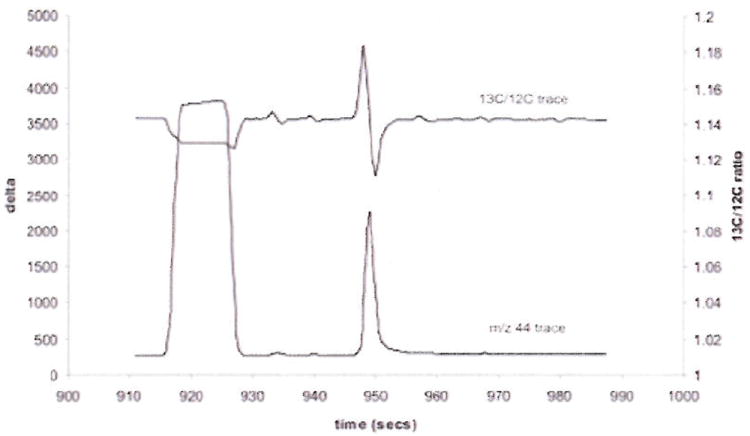
GC/C/IRMS chromatogram of 12CO2 (m/z 44 trace) and 13C/12C ratio from a mmp sample with 0.0091 MPE.
LC/MS/MS analysis
For LC/MS/MS analysis, 2.5 μl of the original MMP extract (2.5%) was taken and the isobutyl ester was prepared. The sample was then analyzed using an Applied Biosystems API 5000 triple quadrupole mass spectrometer with Turbospray ion source (Applied Biosystems, Boston, MA). Samples were resolved on an Ascentis C18 Xpress, 15cm × 2.1mm × 2.7μm HPLC column (Supelco, St. Louis, MO) using a Cohesive TX2 HPLC system (Cohesive Technologies, Franklin, MA). Solvent A consisted of 99% 0.1% formic acid 1% acetonitrile, whereas solvent B composition was 100% Acetonitrile/0.1% formic. Gradient was set as 20% B from 0 – 5.75 min., 70% B to 6.75min., 90% to 8.75min. Selected reaction monitoring conditions were used to monitor transitions of m/z 222.4 > 121.6 and 226.4 > 125.6 for the m+2 and m+6 fragments of phenylalanine and L-[ring-13C6]phenylalanine respectively. The MPE of the unknowns were calculated against the calibration curve (MPE vs. m+6/m+2 ratios) described in section 2.2 above. The amount of phenylalanine injected per run was comparable to that contained in 0.8μg of tissue. Figure 2, upper two panels, shows extracted ion chromatograms of the two species (m+2, m+6) monitored from a sample with an enrichment of 0.0091MPE.
Figure 2.
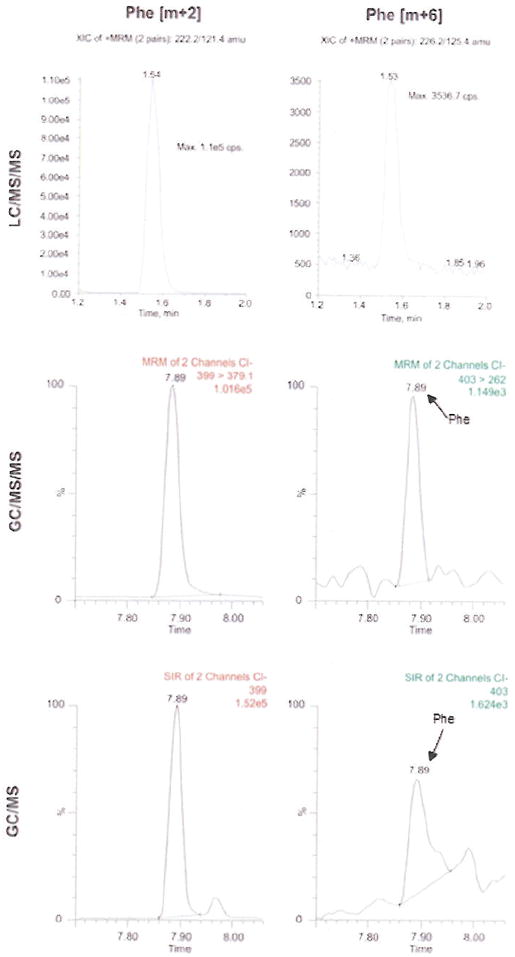
LC/MS/MS, GC/MS/MS and GC/MS chromatograms of m+2 (left panels) and m+6 (right panels) ions of a mmp sample with 0.009 MPE.
The isobutyl ester of phenylalanine was used as a derivative because it gave a better peak shape and sensitivity in comparison with the underivatized condition. Although amino acids can be analyzed in underivatized state the derivatization gave a superior performance, especially when using the low levels as in the current study.
GC/MS/MS
A total of 2.5% of the sample was used for GC/MS/MS analysis. The heptafluorobutyryl isobutyl ester was dissolved in ethyl acetate and analyzed using a Waters Micromass Quattro Micro triple quadrupole GC/MS/MS system (Waters, Milford, MA) operating under negative ion chemical ionization conditions using isobutane as reactant gas. One microliter of the sample was injected in splitless mode (injector temp. 280°C). Peaks were resolved using an Agilent 6890N chromatograph fitted with an Rtx-1701 30m × 0.25mm ID × 0.25μm capillary column (Restek, Bellefonte, PA). Helium was used as carrier gas at 1.2ml/min constant flow rate. The temperature ramp was set from 80 – 165°C at 15°C/min, then to 280°C at 25°C/min and transfer line temperature set at 280°C. Selected ion recording conditions were used to monitor transitions m/z 399.1 > 238.1 and 403.1 > 262.1 for the m+2 and m+6 fragments of phenylalanine and L-[ring-13C6]phenylalanine respectively. The unknown MPE were calculated against the calibration curve described above in section 2.2. Amount of sample injected per run was comparable to phenylalanine from 3μg of muscle tissue. Figure 2, middle 2 panels show extracted ion chromatograms of the two species monitored from a sample with enrichment of 0.009MPE.
GC/MS
The same samples that were run under the GC/MS/MS conditions described above were also run under selected ion monitoring conditions using the same GC conditions and mass spectrometric ionization parameters. The fragments at m/z 399.2 and 403.2 corresponding to the [M-HF]- of phenylalanine and L-[ring-13C6]phenylalanine, respectively, were monitored. The unknown MPE were again calculated against the same calibration curve. The same amount of sample was injected on GC/MS as on GC/MS/MS. Figure 2, lower two panels show extracted ion chromatograms of the two species monitored of the same sample with enrichment of 0.009MPE.
RESULTS AND DISCUSSION
Samples were analyzed on four different conditions that included GC/C/IRMS and three different GC-based mass spectrometers, GC/MS, GC/MS/MS, and LC/MS/MS. Enrichment curve and samples for each instrument were aliquots from the same sample preparation. The constructed enrichment curve was first analyzed by GC/C/IRMS, using 3 injections per point. Figure 3 shows the observed values plotted against theoretical enrichment. We have chosen this as a reference point because historically IRMS has been used to measure very low levels of isotopic enrichment 22. This curve was used in all subsequent analyses on each of the mass spectrometers, but was derivatized differently for each instrument as described in materials and methods section.
Figure 3.
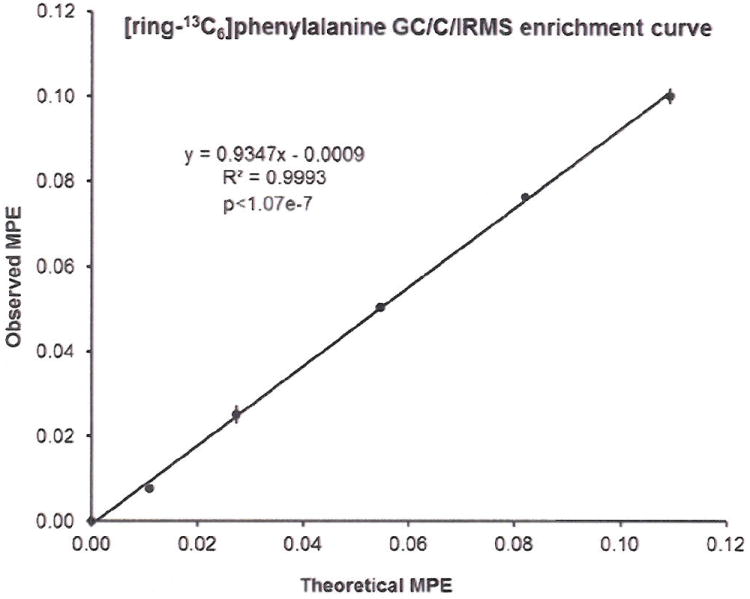
[ring-13C6]phenylalanine enrichment curve measured by GC/C/IRMS.
To establish the correlation between GC/C/IRMS enrichment values to those from other analytical instruments, we ran 18 mixed muscle protein samples with various enrichment as well as the enrichment standard curves in triplicate on each of the mass spectrometers. Mean values were plotted against those obtained by GC/C/IRMS. Linear regression fitting without point weighting was used and the resulting graphs, together with equations of the curves plus linear regression scores are shown in Figure 4. Enrichment values of the mixed-muscle-protein samples measured by LC/MS/MS and by GC/MS/MS showed good correlation with those by GC/C/IRMS, with linear regression scores of R2 = 0.9962 for LC/MS/MS (Fig. 4A) and R2 = 0.9964 for GC/MS/MS (Fig. 4B), and with p<2.5e-7 and p<1.07e-7, respectively. The LC/MS/MS enrichment values almost ideally reflected those obtained by GC/C/IRMS, with fitted curve equation of LC/MS/MS MPE =0.9949 GC/C/IRMS MPE +0.0014 (as compared to y=0.9402x+0.0017 for GC/MS/MS and y=0.8769x-0.0035 for GC/MS). The LC/MS/MS also displayed the lowest standard deviation of the enrichment values within each triplicate, as showed in Fig. 4A (vertical error bars) especially at low levels of enrichment. In contrast, enrichment values obtained by GC/MS did not correlate as well with those obtained by GC/C/IRMS especially for lower enriched samples. This translated to high vertical error bars in Fig. 4C.
Figure 4.
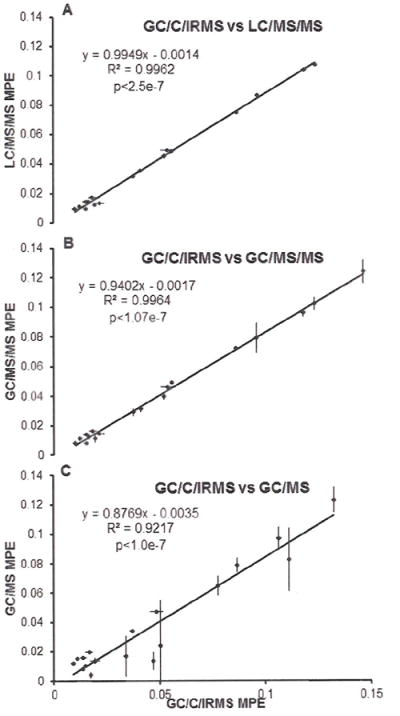
Comparison of 18 mixed muscle protein samples’ mean MPE between GC/C/IRMS and LC/MS/MS(A), GC/MS/MS(B) and GC/MS(C) respectively. Horizontal and vertical barsrepresent standard deviation of the GC/C/IRMS measurements and compared assay, respectively.
To test intra-assay and inter-assay variation of the four different methods, 8 samples were chosen with enrichment values ranging from 0.0091 to 0.0481MPE and were analyzed on 5 consecutive days on each instrument. Each day, the full sample preparation procedure was performed then each sample was split into 3 aliquots for the 3 different instruments. The 8 samples were analyzed 5 times each day in all systems except GC/C/IRMS(only 3 times) to collect data for intra-assay variation. For clarity, only the data of one sample is shown in Table 1. LC/MS/MS showed the lowest intra-assay variation of 1.7 %, whereas GC/MS analysis showed the highest intra-assay variation (13.5%). Similarly, the highest inter-assay variation was observed in GC/MS (CV% of 25.4). LC/MS/MS also displayed lowest day to day variability than that of GC/C/IRMS, GC/MS/MS, CV% of 3.2 vs. 9.2 and 10.2, respectively.
Table 1.
Intra-assay and inter-assay variations of a muscle sample in 4 platforms. Intra-assay values derived from 5 analysis in the same day for all platforms except in GC/C/IRMS where only 3 analysis were performed. Inter-assay values were calculated using data obtained over 5 days. Values are presented as mean enrichment (MPE average), standard deviation (SD) and percent coefficient of variation (CV%).
| GC/C/IRMS | LC/MS/MS | GC/MS/MS | GC/MS | |
|---|---|---|---|---|
| intra-assay (1 day) | ||||
| MPE average | 0.0091 | 0.0093 | 0.0111 | 0.0105 |
| SD | 0.0012 | 0.0002 | 0.0007 | 0.0014 |
| CV% | 13.0 | 1.7 | 6.3 | 13.5 |
| inter-assay (5 days) | ||||
| MPE average | 0.0089 | 0.0097 | 0.0099 | 0.0100 |
| SD | 0.0008 | 0.0003 | 0.0010 | 0.0025 |
| CV% | 9.2 | 3.2 | 10.2 | 25.4 |
| tissue equiv. injected | 8μg | 0.8μg | 3μg | 3μg |
To test how the level of enrichment affects precision of the assay, we divided the sample set into 2 subgroups: 1) Low-MPE group which consisting of samples of relatively “low” enrichment (0.0091MPE - 0.0194MPE by IRMS, n=8) and 2) High-MPE group with “high” enrichment (0.0339MPE - 0.1312MPE by IRMS, n=10). All samples in a given set were analyzed in triplicate in a single sequence. Table 2 shows the mean coefficient of variation (CV%) of the samples from both sample sets as measured by the different instruments. Each instrument showed an increase in CV% with decreasing MPE. GC/MS analysis gave the highest values in both sets (11.51% low-MPE, 31.64% high-MPE). In comparison, the GC/MS/MS values showing less variability as presented by lower CV% for the same samples (9.39 and 5.08 for low- and high-MPE sets respectively). A single quadrupole instrument working in a selective ion monitoring (SIM) mode does not have the same specificity as a triple quadrupole operating in selective reaction monitoring (SRM) mode and therefore cannot effectively filter all interfering ions. This leads to decrease signal to noise ratio, which is a crucial factor in analysis of low enrichment samples. The superior specificity offered by MS/MS spectrometers does not apply to GC/C/IRMS systems, where all organic compounds entering the combustion furnace are converted to CO2 and N2. Therefore the initial chromatographic separation of the compounds of interest is of highest importance in isotope ratio analysis. GC/C/IRMS showed the second best precision in both sets, being outperformed only by LC/MS/MS (CV% 8.16 and 1.85 vs. 3.06 and 1.30). LC/MS/MS also displayed the lowest CV% of measured enrichment in both low and high sets.
Table 2.
Mean percent coefficient of variation (CV%) of low enrichment (low MPE, 0.0091-0.0194, n=8) and high enrichment (high MPE, 0.0339-0.1312, n= 10) sets. All platfoms except GC/MS showed an increase in CV% with decreasing MPE.
| Mean percent coefficient of variation (CV%) | ||||
|---|---|---|---|---|
| GC/C/IRMS | LC/MS/MS | GC/MS/MS | GC/MS | |
| low MPE | 8.16 | 3.06 | 9.39 | 11.51 |
| high MPE | 1.85 | 1.30 | 5.08 | 31.64 |
Our comparison of different mass spectrometry techniques showed that modern LC/MS/MS mass spectrometers can match the precision and reproducibility of GC/C/IRMS systems, when mixed muscle protein enrichment in the order of 0.0091MPE L-[ring-13C6]-Phe is measured. To our knowledge, the only method employing an LC/MS/MS approach in the measurement of amino-acid enrichment has been presented by Meesters et al 23, for the estimation of plasma free L-[ring-2H5]phenylalanine, L-[ring-2H4] and L-[ring-2H2]tyrosine under continuous tracer infusion. The authors demonstrated that tracer-to-tracee ratios (TTR) can be measured reproducibly in a calibration curve prepared in ovalbumin solution for the range of 0.01%-5.0%. The authors also advised that this technique should only be used in situation where TTR is at least 0.01% or higher. The plasma enrichment presented in the article had enrichment of 3.33%, 2.40% and 0.3% for L-[ring-2H5]phenylalanine, L-[ring-2H4] and L-[ring-2H2]tyrosine, respectively. All these levels are well above the “high” enrichment in our experiments. The current study was designed to measure low MPE usually encountered in muscle protein measurements and demonstrated that the LC/MS/MS approach is ideally suited for this type of studies especially when only small sample sizes are available. Time required for analysis is also an important consideration while comparing different approaches. LC/MS/MS analysis of mixed muscle protein is the least time consuming amongst all of the techniques compared, requiring only a single-step derivatization of phenylalanine combined with a shorter HPLC run time, 7 minutes as compared to 14 minutes for GC/MS and GC/MS/MS runs. Higher sample dilution prior to injection and the ability to divert the majority of column flow to waste (except for the time window where the compound of interest elutes from the column) ensures lower maintenance effort and longer instrument lifetime. An example of the use of LC/MS/MS and GC/MS/MS has been their ability to precisely measure low L-[ring-13C6]-Phenylalanine enrichment in samples with low protein concentration obtained from individual protein gel spots via two-dimensional gel electrophoresis (2DGE). This technique was used recently to establish individual synthesis rates of rat muscle mitochondrial proteins 24 and human plasma proteins in type I diabetic, insulin deprived patients 17. Application of tandem mass spectrometry in the analysis of 2DGE protein maps after L-[ring-13C6]Phenylalanine tracer infusion also made it possible to differentiate newly synthesized and relatively old, oxidatively damaged proteins (different isoforms of the sample protein) in human plasma samples 18. The above application would not be possible to achieve by GC/C/IRMS and GC/MS techniques because of the small sample quantities present in 2DGE spots unless of course protein spots from multiple 2DGE are collected.
When sample size is much larger than has been used in the current study the GC/MS approach11,13,14 is a viable approach to measure the differences in proteins. For measurement of mixed muscle protein fractional synthesis rate of isotopic enrichment the GC/MS approach has been extensively used because the large sample size reduces noise to signal ratio. However, as has been shown in the current experiment when sample size is small such as for the measurement of isotopic enrichment in individual muscle proteins GC/MS approach is suboptimal due to its low precision. The tandem mass spectrometry as in the case of GC/MC/MS and LC/MS/MS by monitoring daughter ions of the initial fragments which are more specific to the components of interest achieves superior precision by reducing interfering peaks and background. Moreover, despite its superior ability to detect low isotopic abundance, the requirement of higher (above 10 fold higher than LC/MS/MS) sample size limits the use of GC/I/IRMS for measuring the isotopic enrichment of individual protein samples.
CONCLUSIONS
In summary, we have shown that LC/MS/MS offers the highest overall reproducibility, lowest inter- and intra-assay variation, shortest time of analysis and best precision for measuring very low-enrichment samples. LC/MS/MS analysis also required the lowest amount of sample, and had the highest signal/noise ratio of the m+6 trace ion. We conclude that the LC/MS/MS technique is best suited for precise measurements of low L-[ring-13C6]Phenylalanine tracer enrichments in protein samples especially where only low amounts of sample are available, such as individual proteins purified by multi or 2 dimensional electrophoresis or chromatography.
Acknowledgments
The authors acknowledge the support of Mayo Clinic CTSA Clinical Research Unit Staff for their support and National Institute of Health for the Grants R01 AG09531 and UL1 TR00135 that supported these studies.
References
- 1.Halliday D, McKeran RO. Measurement of muscle protein synthetic rate from serial muscle biopsies and total body protein turnover in man by continuous intravenous infusion of L-(alpha-15N)lysine. Clin Sci Mol Med. 1975;49:581. doi: 10.1042/cs0490581. [DOI] [PubMed] [Google Scholar]
- 2.Nair KS, Welle SL, Halliday D, Campbell RG. Effect of beta-hydroxybutyrate on whole-body leucine kinetics and fractional mixed skeletal muscle protein synthesis in humans. J Clin Invest. 1988;82:198. doi: 10.1172/JCI113570. [DOI] [PMC free article] [PubMed] [Google Scholar]
- 3.Rennie MJ, Edwards RH, Emery PW, Halliday D, Lundholm K, Millward DJ. Depressed protein synthesis is the dominant characteristic of muscle wasting and cachexia. Clin Physiol. 1983;3:387. doi: 10.1111/j.1475-097x.1983.tb00847.x. [DOI] [PubMed] [Google Scholar]
- 4.Volpi E, Ferrando AA, Yeckel CW, Tipton KD, Wolfe RR. Exogenous amino acids stimulate net muscle protein synthesis in the elderly. J Clin Invest. 1998;101:2000. doi: 10.1172/JCI939. [DOI] [PMC free article] [PubMed] [Google Scholar]
- 5.Short KR, Vittone JL, Bigelow ML, Proctor DN, Nair KS. Age and aerobic exercise training effects on whole body and muscle protein metabolism. Am J Physiol Endocrinol Metab. 2004;286:E92. doi: 10.1152/ajpendo.00366.2003. [DOI] [PubMed] [Google Scholar]
- 6.Brodsky IG, Balagopal P, Nair KS. Effects of testosterone replacement on muscle mass and muscle protein synthesis in hypogonadal men--a clinical research center study. J Clin Endocrinol Metab. 1996;81:3469. doi: 10.1210/jcem.81.10.8855787. [DOI] [PubMed] [Google Scholar]
- 7.Balagopal P, Schimke JC, Ades P, Adey D, Nair KS. Age effect on transcript levels and synthesis rate of muscle MHC and response to resistance exercise. Am J Physiol Endocrinol Metab. 2001;280:E203. doi: 10.1152/ajpendo.2001.280.2.E203. [DOI] [PubMed] [Google Scholar]
- 8.Nair KS, Halliday D, Griggs RC. Leucine incorporation into mixed skeletal muscle protein in humans. Am J Physiol. 1988;254:E208. doi: 10.1152/ajpendo.1988.254.2.E208. [DOI] [PubMed] [Google Scholar]
- 9.Baumann PQ, Stirewalt WS, O’Rourke BD, Howard D, Nair KS. Precursor pools of protein synthesis: a stable isotope study in a swine model. Am J Physiol. 1994;267:E203. doi: 10.1152/ajpendo.1994.267.2.E203. [DOI] [PubMed] [Google Scholar]
- 10.Balagopal P, Nair KS, Stirewalt WS. Isolation of myosin heavy chain from small skeletal muscle samples by preparative continuous elution gel electrophoresis: application to measurement of synthesis rate in human and animal tissue. Anal Biochem. 1994;221:72. doi: 10.1006/abio.1994.1381. [DOI] [PubMed] [Google Scholar]
- 11.Patterson BW, Zhang XJ, Chen Y, Klein S, Wolfe RR. Measurement of very low stable isotope enrichments by gas chromatography/mass spectrometry: application to measurement of muscle protein synthesis. Metabolism. 1997;46:943. doi: 10.1016/s0026-0495(97)90084-6. [DOI] [PubMed] [Google Scholar]
- 12.Chow LS, Albright RC, Bigelow ML, Toffolo G, Cobelli C, Nair KS. Mechanism of insulin’s anabolic effect on muscle: measurements of muscle protein synthesis and breakdown using aminoacyl-tRNA and other surrogate measures. Am J Physiol Endocrinol Metab. 2006;291:E729. doi: 10.1152/ajpendo.00003.2006. [DOI] [PubMed] [Google Scholar]
- 13.Calder AG, Anderson SE, Grant I, McNurlan MA, Garlick PJ. The determination of low d5-phenylalanine enrichment (0.002-0.09 atom percent excess), after conversion to phenylethylamine, in relation to protein turnover studies by gas chromatography/electron ionization mass spectrometry. Rapid Commun Mass Spectrom. 1992;6:421. doi: 10.1002/rcm.1290060704. [DOI] [PubMed] [Google Scholar]
- 14.Slater C, Preston T, McMillan DC, Falconer JS, Fearon KCH. GC/MS analysis of [2H5]phenylalanine at very low enrichment: Measurement of protein synthesis in health and disease. Journal of Mass Spectrometry. 1995;30:1325. [Google Scholar]
- 15.Persson XM, Blachnio-Zabielska AU, Jensen MD. Rapid measurement of plasma free fatty acid concentration and isotopic enrichment using LC/MS. J Lipid Res. 2010;51:2761. doi: 10.1194/jlr.M008011. [DOI] [PMC free article] [PubMed] [Google Scholar]
- 16.Jaleel A, Nehra V, Persson XM, Boirie Y, Bigelow M, Nair KS. In vivo measurement of synthesis rate of multiple plasma proteins in humans. Am J Physiol Endocrinol Metab. 2006;291:E190. doi: 10.1152/ajpendo.00390.2005. [DOI] [PubMed] [Google Scholar]
- 17.Jaleel A, Klaus KA, Morse DM, Karakelides H, Ward LE, Irving BA, Nair KS. Differential effects of insulin deprivation and systemic insulin treatment on plasma protein synthesis in type 1 diabetic people. Am J Physiol Endocrinol Metab. 2009;297:E889. doi: 10.1152/ajpendo.00351.2009. [DOI] [PMC free article] [PubMed] [Google Scholar]
- 18.Jaleel A, Henderson GC, Madden BJ, Klaus KA, Morse DM, Gopala S, Nair KS. Identification of de novo synthesized and relatively older proteins: accelerated oxidative damage to de novo synthesized apolipoprotein A-1 in type 1 diabetes. Diabetes. 2010;59:2366. doi: 10.2337/db10-0371. [DOI] [PMC free article] [PubMed] [Google Scholar]
- 19.Ljungqvist OH, Persson M, Ford GC, Nair KS. Functional heterogeneity of leucine pools in human skeletal muscle. Am J Physiol. 1997;273:E564. doi: 10.1152/ajpendo.1997.273.3.E564. [DOI] [PubMed] [Google Scholar]
- 20.Metges CC, Petzke KJ, Hennig U. Gas chromatography/combustion/isotope ratio mass spectrometric comparison of N-acetyl- and N-pivaloyl amino acid esters to measure 15N isotopic abundances in physiological samples: a pilot study on amino acid synthesis in the upper gastro-intestinal tract of minipigs. J Mass Spectrom. 1996;31:367. doi: 10.1002/(SICI)1096-9888(199604)31:4<367::AID-JMS310>3.0.CO;2-V. [DOI] [PubMed] [Google Scholar]
- 21.Ford GC, Cheng KN, Halliday D. Analysis of (1-13C)leucine and (13C)KIC in plasma by capillary gas chromatography/mass spectrometry in protein turnover studies. Biomed Mass Spectrom. 1985;12:432. doi: 10.1002/bms.1200120814. [DOI] [PubMed] [Google Scholar]
- 22.Halliday D, Read WW. Mass spectrometric assay of stable isotopic enrichment for the estimation of protein turnover in man. Proc Nutr Soc. 1981;40:321. doi: 10.1079/pns19810048. [DOI] [PubMed] [Google Scholar]
- 23.Meesters RJ, Wolfe RR, Deutz NE. Application of liquid chromatography-tandem mass spectrometry (LC-MS/MS) for the analysis of stable isotope enrichments of phenylalanine and tyrosine. J Chromatogr B Analyt Technol Biomed Life Sci. 2009;877:43. doi: 10.1016/j.jchromb.2008.11.018. [DOI] [PubMed] [Google Scholar]
- 24.Jaleel A, Short KR, Asmann YW, Klaus KA, Morse DM, Ford GC, Nair KS. In vivo measurement of synthesis rate of individual skeletal muscle mitochondrial proteins. Am J Physiol Endocrinol Metab. 2008;295:E1255. doi: 10.1152/ajpendo.90586.2008. [DOI] [PMC free article] [PubMed] [Google Scholar]