Abstract
Various innovative chemical sensors have been developed in recent years to sense dangerous substances in air and trace biomarkers in breath. However, in order to solve real world problems, the sensors must be equipped with efficient sample conditioning that can, e.g., control the humidity, which is much less discussed in literatures. To meet the demand, a miniaturized mouthpiece was developed for personal breath analyzers. A key function of the mouthpiece is to condition the humidity in real breath samples without changing the analyte concentrations and introducing substantial backpressure, which is achieved with optimized packing of desiccant particles. Numerical simulations were carried out to determine the performance of the mouthpiece in terms of various controllable parameters, such as the size, density and geometry of the packing. Mouthpieces with different configurations were built and tested, and the experimental data validated the simulation findings. A mouthpiece with optimized performance reducing relative humidity from 95% (27,000 ppmV) to 29% (8000 ppmV) whereas retaining 92% nitric oxide (50ppbV to 46ppbV) was built and integrated into a handheld exhaled nitric oxide sensor, and the performance of exhaled nitric oxide measurement was in good agreement with the gold standard chemiluminescence technique. Acetone, carbon dioxide, nitric oxide, oxygen and ammonia samples were also measured after passing through the desiccant mouthpiece using commercial sensors to examine wide applicability of this breath conditioning approach.
INTRODUCTION
While most works on chemical sensors published to date are devoted to detection, sample collection and conditioning that often determine whether a sensor can solve a real world problem or not, are much less emphasized. This is especially the case for breath analyzers. Human breath contains a variety of chemical signatures that are attractive for early detection and noninvasive management of diseases [1, 2]. Some of these chemicals, such as nitric oxide, hydrogen and 13C urea, have already been used in clinical settings [3-7], and many others have been studied and identified as potential biomarkers for different diseases and health conditions [8, 9]. A difficult challenge in developing breath analyzers is to accurately measure trace amount of analytes in the presence of not only hundreds of interfering gases, but also highly concentrated water vapor. Human breath is nearly saturated with water vapor (>95% RH) [10, 11] which coming out at body temperature condenses in the sensor and often leads to the failure of the breath analyzer, which requires proper sample conditioning before detection [12, 13].
A common solution to condition high humidity sample is to introduce nafion tubing in the sampling line to reduce humidity. However, the reported efficiency of humidity reduction by nafion tubing is highly variable, ranging from 58% to 98% depending on ambient humidity [14, 15]. For this reason many applications must flow additional drying gas into the nafion tubing in order to maintain the efficiency [16], which adds complexity into the device, and also makes it unsuitable for personal use that requires portability. A more serious issue with the nafion approach is that it removes not only unwanted humidity, but also partially or completely (75% to >90%) remove many wanted analytes, such as low-molecular-weight, polar, oxygenated compounds, including some ketones, alcohols, aldehydes, and water-soluble ethers [14]. These analytes are of high clinical significance for different diseases. Real time breath sample measurement without removal of humidity has been done using mass spectrometric platforms including selected ion flow tube (SIFT) [17, 18] and proton transfer reaction (PTR) [19-21] mass spectrometry. These techniques employ special handling of breath sample to avoid humidity condensation and require long heated tubes and capillaries heated up to 100 °C [22-24]. In addition to conditioning the humidity of a breath sample, another critical requirement for breath analyzer is to provide an appropriate volumetric flow rate and back pressure. The flow rate and back pressure requirements differ depending on specific guidelines for the analyte being measured. For example, in the case of breath nitric oxide, a biomarker for inflammation, the American Thoracic Society, recommends that the back pressure should be at least 5 cm H2O [25].
As an effort to overcome the difficulties discussed above, we introduce here a breath sample conditioning approach based on desiccant particles packed in tubing, which can be integrated into the inlet of existing breath monitoring devices. We further establish the relationships of the output humidity, flow rate and pressure in terms of controllable parameters, such as particle size and tubing geometry. The relationships are established based on numerical simulation and validated experimentally. Using this approach, we have designed mouthpieces for nitric oxide detection using a hand held device [26].
EXPERIMENTAL AND SIMULATION METHODS
A. Simulation methods
Numerical simulation of the desiccation process in the mouthpiece was performed using finite element method software COMSOL multiphysics 3.5. The simulation included models for flow and mass transport in the porous medium of calcium chloride, which was used as a desiccant material to adsorb water and control humidity. Temperature change during the desiccation process was not taken into account for simplifying the model. It was experimentally observed that the temperature increased by about 20°C at the mouthpiece inlet for 1 L of breath sample whereas the outlet temperatures increased by 1-2°C. This rise in temperate did not have considerable effect on the working efficiency of the overall desiccant tube (Table 2) since enough material in the tube was far away from saturation. A 2-dimensional rectangular geometry with rotational symmetry, as shown in Figure 1, was used to simulate the cylindrical tubing. The tubing, defined as a subdomain, was packed with the desiccant particles of different diameters (d) into a porous structure, with porosity, εp, varying from 0.25 to 0.65. The permeability (κ) of the system for a given porosity and particle size was estimated by Kozeny’s relation [27],
| (1) |
The constant in the equation was determined experimentally to be 984 by measuring the sample flow rate (v) and pressure difference across a known length (Δx) of the mouthpiece using Darcy’s law [28],
| (2) |
where η is the dynamic viscosity (1.74×10⁻⁵ Pa.s) of humid air at physiological temperature [29].
Table 2.
Comparison of simulated and measured desiccation efficiencies with different parameters of mouthpiece construction.
| Length (mm) |
Diameter (mm) |
Particle size (mm) |
Porosity | Simulated efficiency | Measured efficiency | Difference in Efficiency |
|---|---|---|---|---|---|---|
| 12 | 22 | 1.15 | 0.425 | 44.1 % | 43.6 % | 0.5 % |
| 25 | 22 | 1.15 | 0.425 | 68.8 % | 66.49 % | 2.31 % |
| 49 | 22 | 1.15 | 0.425 | 89.3 % | 81.54 % | 7.76% |
| 12 | 22 | 0.65 | 0.365 | 58.5 % | 61 % | 2.5% |
| 15 | 22 | 0.65 | 0.365 | 69.6 % | 68.4 % | 1.2 % |
Figure 1.

Representation of the modeling domain representing the cylindrical desiccation tube in two dimensions assuming a rotational symmetry of packing.
Brinkman equations given by
| (3) |
| (4) |
were used to model the flow of breath through this medium, where, ρ denotes the density of humid air (1.15 Kg.m-3) and, u represents the velocity, and p refers to the pressure. Equation 4 above implies that the fluid flow is incompressible in the subdomain. Since Mach number for the flow at 6.67 L.min-1 through a typical mouthpiece geometry is less than 0.3, the only appreciable fluid density change resulted from change in temperature of the breath due to rise in desiccant temperature. The increase in breath temperature was measured to be less than 3°C resulting in ~1% increase in density for which the assumption of incompressible flow is valid. Boundary conditions for the flow were set as follows,
Boundary 1: u · n = u0 (inlet), where u0 is the linear flow velocity at the inlet;
Boundary 2 and Boundary 3: u = 0 (wall);
Boundary 4: p = 0 (outlet).
With these subdomain and boundary settings, the velocity field was determined and the solution obtained was further used to solve the mass transport process using COMSOL 3.5.
Mass transport of water within the desiccant tube was described by the diffusion-convection equations,
| (5) |
where Ci denotes the concentration of the species, D is the diffusion coefficient, u represents the velocity and R refers to the rate of consumption of species i. These equations were applied to the two components of the desiccation process viz. humidity in the breath (i=1) and the surface binding sites available on desiccant calcium chloride for capture of humidity (i=2). For breath, the diffusion coefficient of water vapor was set to be 4.6×10⁻⁷ m2.s-1 [30]. The boundary conditions were set as follows,
Boundary 1: (inlet, allows humidity to rise from 0 to within 1% of the maximum breath humidity in 10s compensating for time lag due to sampling of non-alveolar dead space air),
Boundary 2 and Boundary 3: n · (D∇C1 + C1u) = 0 (wall), and
Boundary 4: n · (D∇C1) = 0 (outlet, no convective flux).
For binding sites on the solid calcium chloride, diffusion was neglected and all the boundaries were set as wall for mass transfer [i.e. n · (D∇C2 + C2u) = 0] assuming no inflow or outflow of the desiccant material through any boundary. The rate of water vapor consumption was given by the linear driving force approximation [31-33],
| (7) |
where, k0 is the mass transfer coefficient, obtained from parameter fitting to be 5.5×10⁻³ s-1, Cs represents the surface concentration of water on the calcium chloride surface at any given time and C* is its equilibrium value. Equilibrium water concentration was modeled through Dubinin-Astakhov equation approximated as [34-36],
| (8) |
where, represented the initial concentration of binding sites on calcium chloride available for humidity capture. k1 and k2 were equilibrium parameters obtained from fitting, which were 0.33 m3.mole-1 and 0.01 m3.mole-1, respectively. The surface humidity concentration at any time was represented as,
| (9) |
Finally the rate of consumption was obtained as
| (10) |
These mass balance equations with the appropriate boundary conditions described above were solved using COMSOL 3.5 coupled with the velocity field obtained earlier with the flow simulation to generate concentration profile of breath humidity introduced into the desiccation tube.
B. Experimental validation of mouthpiece performance
In order to experimentally validate the simulation results, several mouthpieces were prepared by packing desiccant particles into cylindrical tubes. Different particle sizes of the desiccant were obtained by refining anhydrous calcium chloride pellets (Fisher Scientific, 4-20mesh). These refined particles were size selected by sieving through wire meshes of predefined sizes. Average particle sizes of 1.15 mm and 0.65 mm were chosen for use. Cylindrical plastic mouthpiece (VacuMed, Part# 1018-22) with internal diameter of 22mm was used for packing these particles at porosity values of 0.425 and 0.365 respectively. Mouthpieces with three different lengths (12 mm, 24 mm, and 46 mm) were tested.
Humidity levels of the breath sample before and after passing through the mouthpiece were measured using a selected ion flow tube mass spectrometer (SIFT-MS) (Instrument science Ltd.) operating in multiple ion monitoring mode with H3O+ as the precursor ion [17]. The backpressure generated by the mouthpiece was measured using a pressure sensor (Freescale, Part# MP3V5004G) at a fixed sample flow rate. Sample flow rate from pressurized gas container (Praxair, Breathing grade air) was controlled with pressure regulators and monitored with a mass flow meter (Sensirion, EM1).
C. Integration of the mouthpiece with breath analyzers
The mouthpiece and a non-rebreathing T-valves (VacuMed, Part# 1464) were integrated into a portable breath nitric oxide sensor developed in our lab. The breath sensor was based on selective colorimetric change due to redox chemistry of phenylenediamine derivatives with the analyte [26]. Subjects blew directly into the mouthpiece for online measurement. The readings from the portable nitric oxide sensor were compared and correlated with chemiluminescence detection (Sievers NOA), which is the gold standard for nitric oxide measurement. Selective capture of humidity over some other gases by the desiccant material was tested with samples collected offline in metal laminated tedlar bags at a flow rate of 6.7 L.min-1 using commercial sensors. Acetone and ammonia were measured with SIFT-MS, carbon dioxide was measured using absorption infrared based hand held monitor (Telaire® 7000 Series) and oxygen was measured using a portable electrochemical sensor (Vascular technologies).
RESUTLS AND DISCUSSIONS
A. Simulation
Flow and mass transfer simulations were carried for several mouthpiece configurations. Figure 2 (A) shows the flow profile obtained from a 30mm long desiccant tube, 15mm in diameter, packed with calcium chloride particles of 1.15 mm average diameter with a porosity of 0.425. For this porosity and particle size at a flow rate of 6.67 L.min-1, the velocity field is homogenous due to porous properties of the structure, which is in contrast to parabolic velocity fields generally obtained under similar conditions in a non-porous free channel. Figure 2 (B) shows the simulated pressure profile along the tube. The pressure drop increases with the increasing length of the packing material at a given packing density. Values for back pressure resulting from different particle sizes and porosities of packing for a given amount (5 g) of calcium chloride were also calculated as shown in Table 1.
Figure 2.

(A) Simulated velocity field along the tube shows uniform flow field established at a given flow rate of 6.67 L.min-1, particle size of 1.15mm and porosity of 0.425. (B) Simulated pressure profile along the tube showing increasing back pressure with tube length assuming uniform packing density.
Table 1.
Simulated values of back pressure in cm H2O generated in the desiccant mouthpiece for varying porosities and particle sizes. Simulation is for 5 grams of calcium chloride.
| Particle size | Porosity
|
||||
|---|---|---|---|---|---|
| 0.25 | 0.35 | 0.45 | 0.55 | 0.65 | |
| 0.35 mm | 243.50 | 66.68 | 22.46 | 8.23 | 3.01 |
| 0.70 mm | 60.91 | 16.67 | 5.61 | 2.05 | 0.75 |
| 1.05 mm | 27.07 | 7.41 | 2.49 | 0.91 | 0.33 |
| 1.40 mm | 15.22 | 4.17 | 1.40 | 0.52 | 0.18 |
The data from table 1 provides guideline on packing of the desiccant material to achieve the desired back pressure range by changing either or both the particle size and the porosity of the mouthpiece. It is evident that back pressure at a given flow rate can be reduced by either increasing the particle size or the porosity of packing for a given mass of desiccant and mouthpiece geometry. Simulations were also carried out to obtain the effect of mouthpiece geometry (diameter and length) for a fixed particle size and porosity of packing assuming uniform packing density. Figure 3 plots pressure drop as a function of tube geometry with particles 1.15mm in diameter packed with a porosity of 0.425. It is evident from the plot that the pressure drop decreases with increasing diameter and decreasing length of the mouthpiece for a given volumetric sample flow rate.
Figure 3.
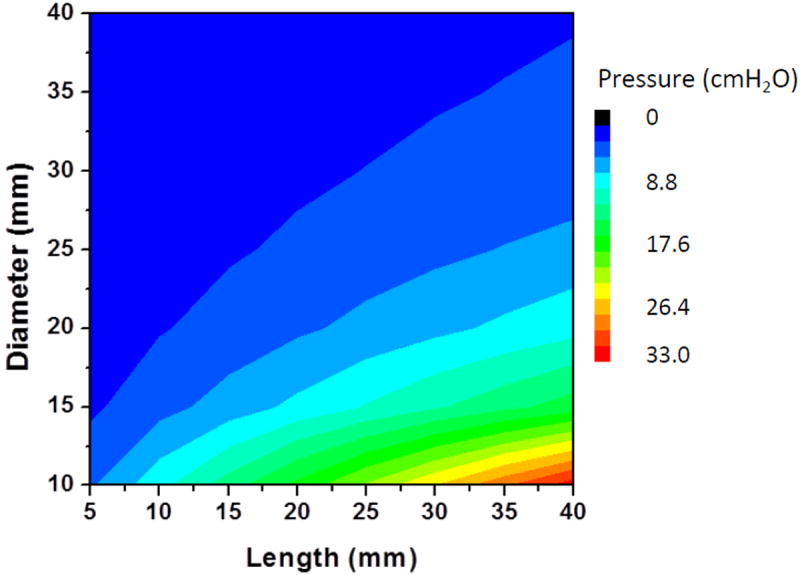
Pressure drop as a function of tube geometry for a given volumetric flow rate (6.67 L/min).
While providing an appropriate backpressure with the mouthpiece is an important requirement for many breath analyzers, other important parameters include the desiccation efficiency, which should be considered together with the backpressure. For this reason the desiccation process was simulated. The desiccation of the breath along the tube (15 mm diameter, 30 mm length, 5 g calcium chloride, 1.15 mm particle diameter, porosity 0.425) is shown in Figure 4. Humidity of the sample decreases along the tube resulting in dryer output of the sample. Humidity levels at boundary 1 (inlet) and boundary 4 (outlet) were integrated for 30s in order to calculate of the efficiency (output/input %) of the desiccation process.
Figure 4.
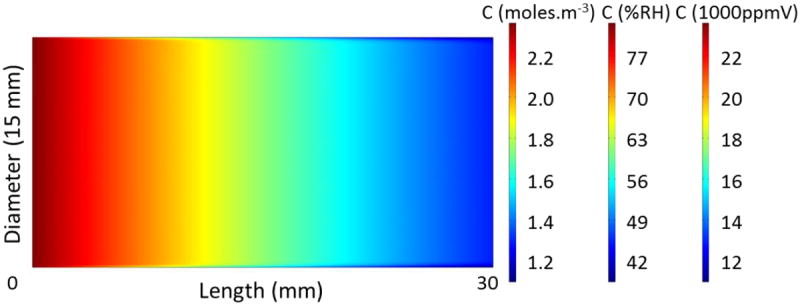
Simulation result of breath humidity concentration along the desiccation tube. Result is for a volumetric flow rate of 6.67 L/min and sampling time of 30 s through a desiccant tube (15 mm diameter, 30 mm length, 5 g calcium chloride, 1.15 mm particle diameter, porosity 0.425).
Desiccation efficiencies with different particle sizes of the desiccant particles were simulated for a given flow and amount of desiccant. Figure 5 shows the desiccation efficiency decreasing with increasing particle size for 5 g of calcium chloride. The efficiency was found to be independent of the packing porosity under these conditions. Desiccation efficiencies were also simulated for a fixed particle size and packing porosity with changing mouthpiece geometry (length and diameter). Figure 6 shows a plot of desiccation efficiency as a function of mouthpiece geometry with 1.15mm wide particles packed with a porosity of 0.425. It can be seen from the plot that the efficiency of desiccation improves with increasing length and diameter (i.e., volume) of the mouthpiece.
Figure 5.
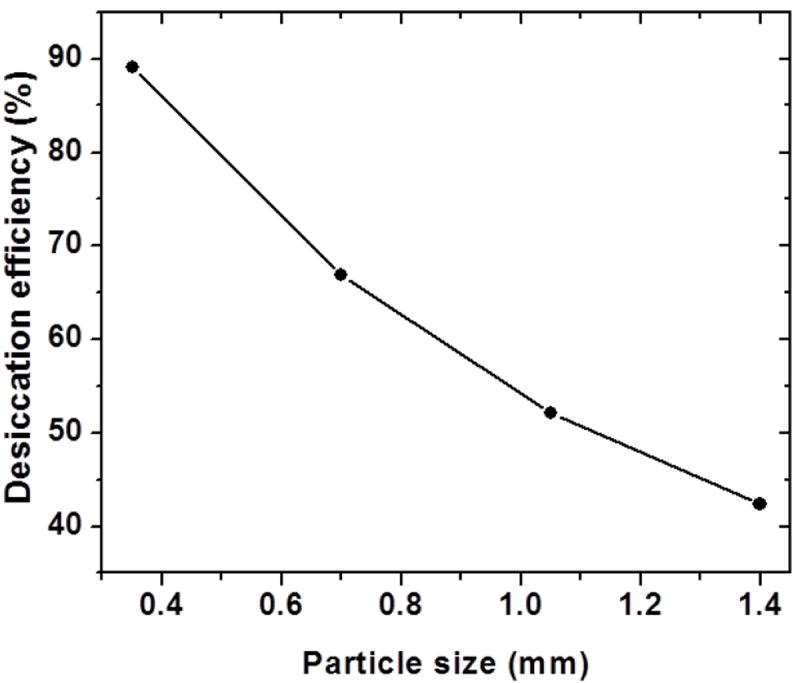
Desiccation efficiency for different particle sizes at a fixed geometry of the mouthpiece (15 mm long, 22 mm diameter) using 5 g of calcium chloride.
Figure 6.
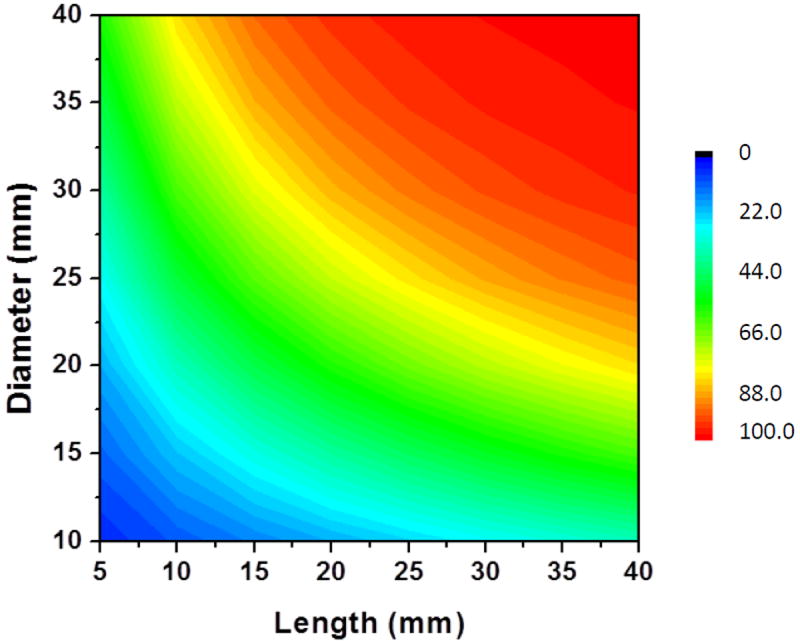
Desiccation efficiency simulated as a function of tube geometry for a given volumetric flow rate (6.7 L/min).
These simulation results are useful in choosing the best parameters for preparing a customized mouthpiece for any breath analyzers. These parameters include mouthpiece geometry (length and diameter), particle size and packing porosity. It is also clear that if any of these parameters are constrained based on particular needs of certain device then other parameters can be varied to achieve the desired performance.
B. Experimental validation of mouthpiece performance
In order to validate the flow simulation, mouthpieces with three different lengths and 22 mm diameter were prepared. This geometry was chosen for easy integration with our device. Figure 7 shows the comparison of simulated to measured pressure difference across the tube for the three chosen lengths. Both results correlate well showing that the pressure drop increases with increasing length of the mouthpiece.
Figure 7.
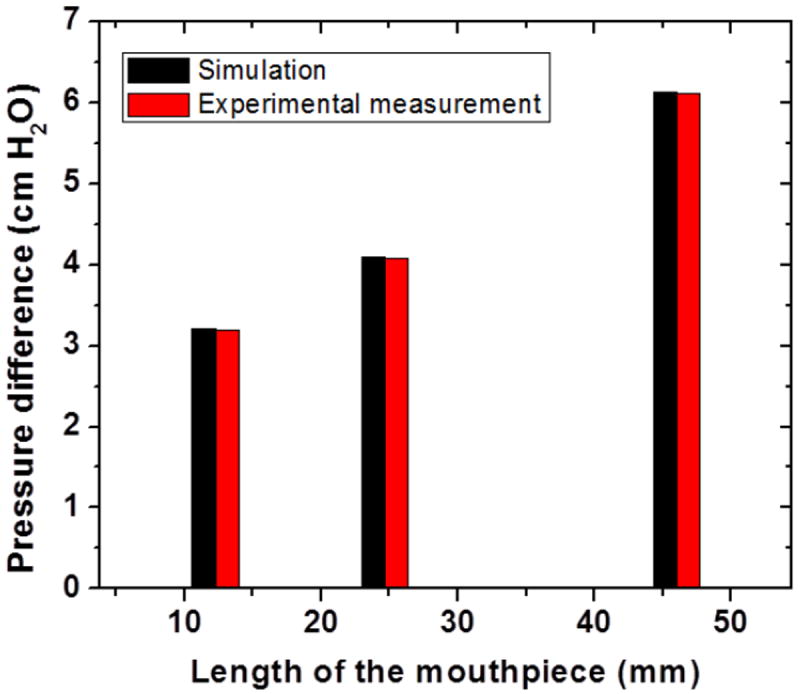
Comparison of simulated and experimentally measured pressure difference across the mouthpiece packed with 1.15mm particles with a porosity of 0.425.
Table 2 shows a comparison of simulated and measured desiccation efficiencies for different mouthpiece geometries, packing and particle sizes. Deviations in the results increase at high desiccation efficiencies. With increasing desiccation, the experimental efficiency is lower than the predicted efficiency from the model. This could be attributed to the exothermic nature of the desiccation process which starts to affect the efficiency for high humidity capture. Due to higher surface temperature the actual efficiency of capture is lower as observed in the experimental results.
Figure 8 shows humidity output of the mouthpiece over ten successive breathings measured by SIFT-MS. Each exhalation was followed by purging with dry air sample. It can be observed that the output was much drier initially and the efficiency of the mouthpiece decreased with successive breathing cycles due to exhaustion and heating although the average humidity remained within the desired non condensing levels.
Figure 8.
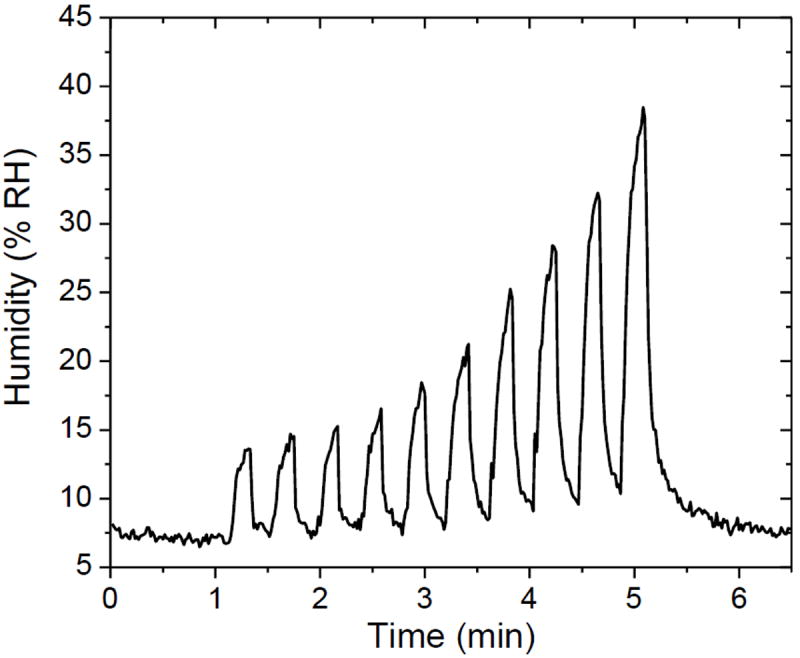
Humidity output of the mouthpiece (15 mm diameter, 30 mm length, 5 g calcium chloride, 1.15 mm particle diameter, porosity 0.425) for ten successive breathings. The baseline was obtained with dry air purging.
C. Integration with portable breath sensors
Desiccant mouthpiece with an efficiency of 70% (30s sampling at 6.67ml.min-1) was used to sample breath in colorimetric optical sensor developed in our lab. Figure 9 (A) shows the response of the sensor to breath sampling without the mouthpiece. A jump in the intensity of signal can be observed in the sensing photodiode due to humidity condensation on the substrate affecting the transmittance [37]. Also, the reference photodiode shows random fluctuations in the signal. Response of the same sensor after integration of the mouthpiece is shown in Figure 9 (B). A linear decrease in intensity due to color development is observed without any spike due to humidity on the sensing photodiode. The reference photodiode also shows a stable signal and fluctuations due to humidity are not observed. After integration of the mouthpiece, real breath samples could be analyzed for nitric oxide using the portable device as shown in Figure 10.
Figure 9.
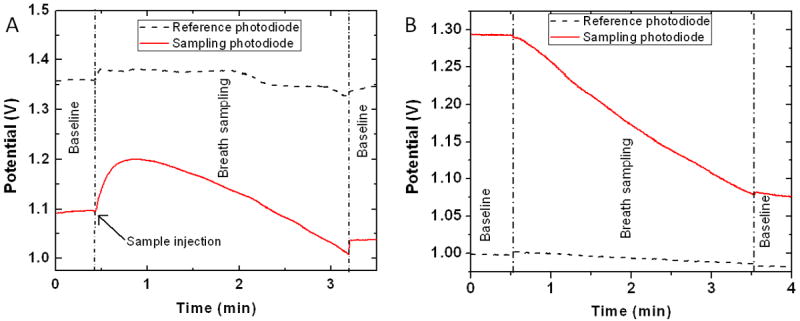
Optical response from photodiodes used for detection of color change (sampling) and correction (reference) in intensity during breath test (A) without the use of desiccant mouthpiece and (B) after integration of the desiccant mouthpiece.
Figure 10.
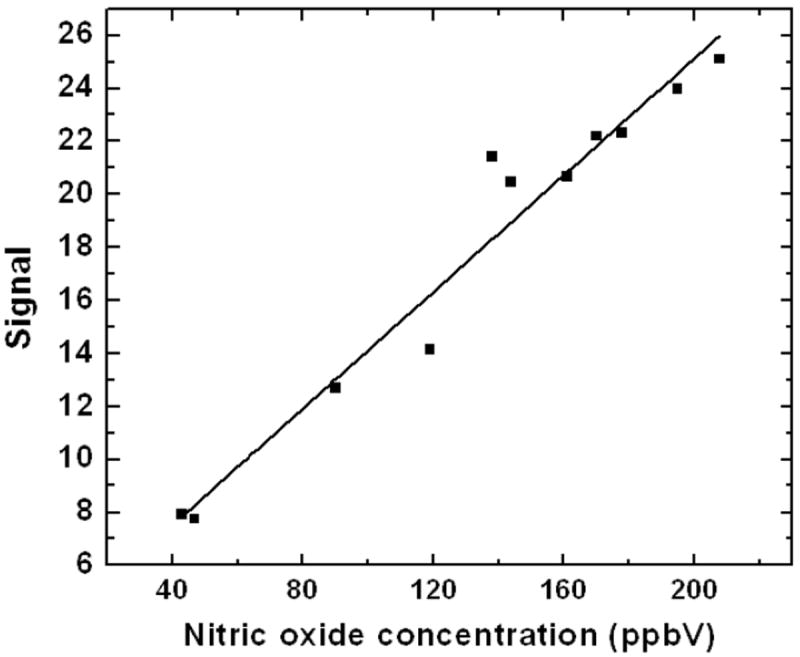
Analysis of nitric oxide levels in breath sample using colorimetric optical sensor integrated with the desiccation mouthpiece for online sample conditioning. A linear response is obtained towards nitric oxide.
D. Selectivity of the desiccation material
The desiccation mouthpiece made of calcium chloride was tested for capture of some other gases including acetone, carbon dioxide, nitric oxide and oxygen for which the mouthpiece showed a capture efficiency of less than 5% for a 70% removal of humidity (Figure 11). These results show that the desiccant material can be used for analysis of these gases in conditioned breath by suitable sensors. However, there are some gases which can be captured by calcium chloride along with humidity. Ammonia is known to form complex with calcium chloride [38]. 10ppmV input ammonia reduced to 0.8ppmV output resulting in 92% ammonia removal efficiency of the calcium chloride mouthpiece under similar configuration.
Figure 11.
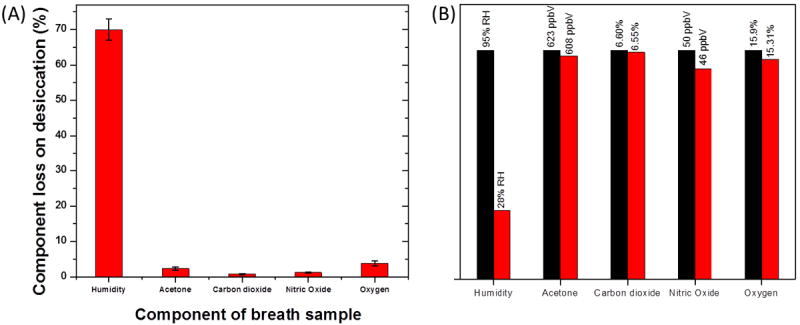
(A) Selective removal of humidity by the desiccant mouthpiece over other components of interest. (B) Absolute value of concentrations for different compounds tested before and after passing through the mouthpiece.
E. Reusability of the mouthpiece
Reusability of the mouthpiece was tested for conditioning of real samples. Figure 12 (A) shows the efficiency of desiccation with variation of 5.6% at a mean efficiency level of 67.3% using a single mouthpiece (23cm length, 22mm diameter, particle size 1.15mm, porosity 0.425) for collection of ten samples with gap of 10mins between successive tests. Each sample was collected at a flow rate of 6.7 L/min to fill a 4-L tedlar bag. A gap of 10min was given between each collection which was necessary to avoid efficiency loss due to overheating of the tube. The desiccation tube was also used for routine testing over a week. A single mouthpiece was used for sample collection, two times a day separated by 6 to 8 hours for six consecutive days. Figure 12 (B) shows the desiccation efficiency of each test. The mean efficiency for the six day test was 67.17% with a variation of 3.4%. The mouthpiece was stored in a regular zip-lock bag after each test. The storage was necessary because calcium chloride being hygroscopic adsorbs water continuously from the atmosphere. The zip-lock bag insulated the mouthpiece from the environment and avoided excessive humidity capture, which slowed the exhaustion of the mouthpiece.
Figure 12.
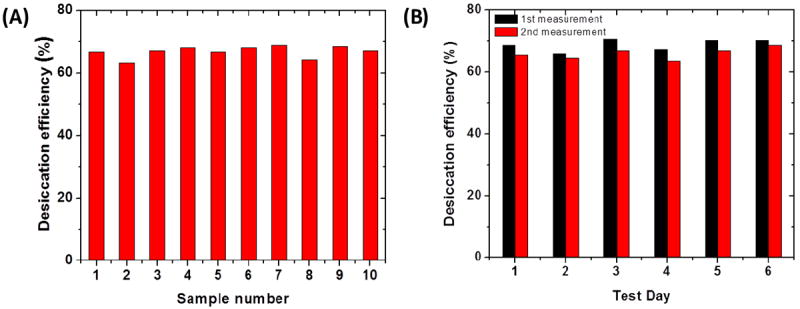
(A) Efficiency and reusability of one mouthpiece with 10mins gap between successive tests. Mean desiccation efficiency (%) = 67.3 % and variation from the mean is 5.6 % (B) Reusability of one mouthpiece over a week measured two time each day and stored in ambient lab conditions in a zip-lock bag. Mean desiccation efficiency (%) = 67.17 % and variation from the mean is 3.4 %.
CONCLUSIONS
A miniaturized mouthpiece was developed to efficiently remove humidity and condition real breath samples in real time without affecting target analyte concentrations. The mouthpiece consists of packed desiccant particles in a tube. Numerical simulation of the desiccation process was carried out by taking into account various processes, including diffusion, mass transport and water absorption, described by differential equations with appropriate boundary conditions. The performance the mouthpiece in terms of humidity control and backpressure minimization depends on the size and packing density of the particles, geometry of the tube and flow rate. Based on the simulation, mouthpieces with different configurations were built and tested, and the experimental results validated the simulation findings. The findings provide guidance for those who wish to design efficient sample conditioning systems for practical chemical sensors, particularly breath analyzers. The mouthpiece was integrated into a handheld sensor for exhaled nitric oxide detection, and the results are in excellent agreement with gold standard methods. The miniaturized mouthpiece has great applicability for the new generation of portable breath analyzers, which require easy, efficient and reproducible removal of high humidity for seamless device functioning.
Acknowledgments
This work has been supported by NIBIB/NIH (#1R21EB014219-01) through the Technologies for Health Independent Living Program (Director: Dr. Brenda Korte). We are thankful to collaborators Rui Wang, Xiaonan Shan, and Di Zhao form Center for Bioelectronics and Biosensors, Biodesign Institute, who have contributed to this work with suggestions and ideas about different modeling approaches and applications of use.
References
- 1.Pauling L, et al. Quantitative analysis of urine vapor and breath by gas-liquid partition chromatography. Proceedings of the National Academy of Sciences. 1971;68(10):2374. doi: 10.1073/pnas.68.10.2374. [DOI] [PMC free article] [PubMed] [Google Scholar]
- 2.Sanchez JM, Sacks RD. GC analysis of human breath with a series-coupled column ensemble and a multibed sorption trap. Analytical chemistry. 2003;75(10):2231–2236. doi: 10.1021/ac020725g. [DOI] [PubMed] [Google Scholar]
- 3.Španel P, Smith D. Volatile compounds in health and disease. Current Opinion in Clinical Nutrition & Metabolic Care. 2011;14(5):455. doi: 10.1097/MCO.0b013e3283490280. [DOI] [PubMed] [Google Scholar]
- 4.Smith AD, et al. Use of exhaled nitric oxide measurements to guide treatment in chronic asthma. New England Journal of Medicine. 2005;352(21):2163–2173. doi: 10.1056/NEJMoa043596. [DOI] [PubMed] [Google Scholar]
- 5.Levitt MD, Donaldson R. Use of respiratory hydrogen (H2) excretion to detect carbohydrate malabsorption. The Journal of laboratory and clinical medicine. 1970;75(6):937. [PubMed] [Google Scholar]
- 6.Rowland M, et al. Carbon 13-labeled urea breath test for the diagnosis of Helicobacter pylori infection in children. The Journal of pediatrics. 1997;131(6):815–820. doi: 10.1016/s0022-3476(97)70026-x. [DOI] [PubMed] [Google Scholar]
- 7.Gisbert J, Pajares J. Review article: 13C - urea breath test in the diagnosis of Helicobacter pylori infection - a critical review. Alimentary pharmacology & therapeutics. 2004;20(10):1001–1017. doi: 10.1111/j.1365-2036.2004.02203.x. [DOI] [PubMed] [Google Scholar]
- 8.Cao W, Duan Y. Breath analysis: potential for clinical diagnosis and exposure assessment. Clinical chemistry. 2006;52(5):800. doi: 10.1373/clinchem.2005.063545. [DOI] [PubMed] [Google Scholar]
- 9.Beauchamp J. Inhaled today, not gone tomorrow: pharmacokinetics and environmental exposure of volatiles in exhaled breath. Journal of Breath Research. 2011;5:037103. doi: 10.1088/1752-7155/5/3/037103. [DOI] [PubMed] [Google Scholar]
- 10.Ochiai N, et al. Analysis of volatile sulphur compounds in breath by gas chromatography-mass spectrometry using a three-stage cryogenic trapping preconcentration system. Journal of Chromatography B: Biomedical Sciences and Applications. 2001;762(1):67–75. doi: 10.1016/s0378-4347(01)00343-7. [DOI] [PubMed] [Google Scholar]
- 11.Grote C, Pawliszyn J. Solid-phase microextraction for the analysis of human breath. Analytical chemistry. 1997;69(4):587–596. doi: 10.1021/ac960749l. [DOI] [PubMed] [Google Scholar]
- 12.Robinson JK, Bollinger MJ, Birks JW. Luminol/H2O2 chemiluminescence detector for the analysis of nitric oxide in exhaled breath. Analytical chemistry. 1999;71(22):5131–5136. doi: 10.1021/ac990646d. [DOI] [PubMed] [Google Scholar]
- 13.Konvolina G, Haick H. The Effect of Humidity on Nanoparticle-Based Chemiresistors: A Comparison between Synthetic and Real-World Samples. ACS Applied Materials & Interfaces. 2011 doi: 10.1021/am2013695. [DOI] [PubMed] [Google Scholar]
- 14.Burns WF, et al. Problems with a Nafion® membrane dryer for drying chromatographic samples. Journal of Chromatography A. 1983;269(0):1–9. [Google Scholar]
- 15.Foulger BE, Simmonds PG. Drier for field use in the determination of trace atmospheric gases. Analytical chemistry. 1979;51(7):1089–1090. [Google Scholar]
- 16.Leckrone KJ, Hayes JM. Efficiency and Temperature Dependence of Water Removal by Membrane Dryers. Analytical chemistry. 1997;69(5):911–918. doi: 10.1021/ac9610220. [DOI] [PubMed] [Google Scholar]
- 17.Španěl P, Smith D. On - line measurement of the absolute humidity of air, breath and liquid headspace samples by selected ion flow tube mass spectrometry. Rapid Communications in Mass Spectrometry. 2001;15(8):563–569. doi: 10.1002/rcm.265. [DOI] [PubMed] [Google Scholar]
- 18.Boshier PR, et al. On-line, real time monitoring of exhaled trace gases by SIFT-MS in the perioperative setting: a feasibility study. Analyst. 2011;136(16):3233–3237. doi: 10.1039/c1an15356k. [DOI] [PubMed] [Google Scholar]
- 19.King J, et al. A mathematical model for breath gas analysis of volatile organic compounds with special emphasis on acetone. Journal of mathematical biology. 2011;63(5):959–999. doi: 10.1007/s00285-010-0398-9. [DOI] [PubMed] [Google Scholar]
- 20.King J, et al. Physiological modeling of isoprene dynamics in exhaled breath. Journal of theoretical biology. 2010;267(4):626–637. doi: 10.1016/j.jtbi.2010.09.028. [DOI] [PubMed] [Google Scholar]
- 21.King J, et al. A modeling-based evaluation of isothermal rebreathing for breath gas analyses of highly soluble volatile organic compounds. Journal of Breath Research. 2012;6:016005. doi: 10.1088/1752-7155/6/1/016005. [DOI] [PubMed] [Google Scholar]
- 22.Diskin AM, Španěl P, Smith D. Time variation of ammonia, acetone, isoprene and ethanol in breath: a quantitative SIFT-MS study over 30 days. Physiological measurement. 2003;24:107. doi: 10.1088/0967-3334/24/1/308. [DOI] [PubMed] [Google Scholar]
- 23.King J, et al. Dynamic profiles of volatile organic compounds in exhaled breath as determined by a coupled PTR-MS/GC-MS study. Physiological measurement. 2010;31:1169. doi: 10.1088/0967-3334/31/9/008. [DOI] [PubMed] [Google Scholar]
- 24.King J, et al. Measurement of endogenous acetone and isoprene in exhaled breath during sleep. Physiological measurement. 2012;33:413. doi: 10.1088/0967-3334/33/3/413. [DOI] [PubMed] [Google Scholar]
- 25.American Thoracic Society, E.R.S. ATS/ERS recommendations for standardized procedures for the online and offline measurement of exhaled lower respiratory nitric oxide and nasal nitric oxide, 2005. Am J Respir Crit Care Med. 2005;171:912–930. doi: 10.1164/rccm.200406-710ST. [DOI] [PubMed] [Google Scholar]
- 26.Prabhakar A, et al. Ultrasensitive Detection of Nitrogen Oxides over a Nanoporous Membrane. Analytical chemistry. 2010 doi: 10.1021/ac101908g. [DOI] [PMC free article] [PubMed] [Google Scholar]
- 27.Childs E, Collis-George N. The permeability of porous materials. Proceedings of the Royal Society of London Series A Mathematical and Physical Sciences. 1950;201(1066):392–405. [Google Scholar]
- 28.Bear J. Dynamics of fluids in porous media. Dover publications; 1988. [Google Scholar]
- 29.Tsilingiris P. Thermophysical and transport properties of humid air at temperature range between 0 and 100 C. Energy Conversion and Management. 2008;49(5):1098–1110. [Google Scholar]
- 30.Zhang X, Qiu L. Moisture transport and adsorption on silica gel-calcium chloride composite adsorbents. Energy Conversion and Management. 2007;48(1):320–326. [Google Scholar]
- 31.Glueckauf E, Coates J. 241. Theory of chromatography. Part IV. The influence of incomplete equilibrium on the front boundary of chromatograms and on the effectiveness of separation. J Chem Soc. 1947:1315–1321. doi: 10.1039/jr9470001315. [DOI] [PubMed] [Google Scholar]
- 32.Sircar S, Hufton J. Why does the linear driving force model for adsorption kinetics work? Adsorption. 2000;6(2):137–147. [Google Scholar]
- 33.Joly A, Volpert V, Perrard A. Dynamic Adsorption with FEMLAB, Modeling breakthrough curves of gaseous pollutants through activated carbon beds. 2005 [Google Scholar]
- 34.Park I, Knaebel KS. ADSORPTION BREAKTHROUGH BEHAVIOR - UNUSUAL EFFECTS AND POSSIBLE CAUSES. Aiche Journal. 1992;38(5):660–670. [Google Scholar]
- 35.Kamiuto K, Ermalina, Ihara K. CO2 adsorption equilibria of the honeycomb zeolite beds. Applied Energy. 2001;69(4):285–292. [Google Scholar]
- 36.Mămăligă I, Baciu C, Petrescu S. STUDY OF ADSORPTION EQUILIBRIUM OF SOME WET AIR-COMPOSITE MATERIAL SYSTEMS. Environmental Engineering & Management Journal (EEMJ) 2009;8(2):253–257. [Google Scholar]
- 37.Ellerbee AK, et al. Quantifying colorimetric assays in paper-based microfluidic devices by measuring the transmission of light through paper. Analytical chemistry. 2009;81(20):8447–8452. doi: 10.1021/ac901307q. [DOI] [PubMed] [Google Scholar]
- 38.Popov AI, Wendlandt WW. The Methylamine Complexes of the Rare Earth (III) Chlorides1. Journal of the American Chemical Society. 1955;77(4):857–859. [Google Scholar]


