

Abstract
Whether humans adjust their behavior in response to unaware errors remains a controversial issue relevant to insight in neuropsychiatric conditions. Initial error awareness studies found that the error-related negativity (ERN), an event-related potential (ERP) originating in the medial prefrontal cortex after errors, activated equally for aware and unaware errors, suggesting a candidate preconscious mechanism. However, recent studies demonstrate that the ERN decreases after unaware errors. We hypothesized that the ERN is dependent upon awareness, and predicted that previous discrepancies might be due to unaware errors not being differentiated from perceptually uncertain, low-confidence responses that might increase the ERN amplitude. Here we addressed this hypothesis by distinguishing between aware errors, unaware errors, and uncertain responses, and using stimuli (faces) associated with well established sensory ERPs to evaluate the degree of stimulus processing for each trial type. We found that while aware and unaware errors were related to failures at the time of response, uncertain responses were due to failures at the time of stimulus processing indexed by lower amplitude sensory ERPs. Moreover, uncertain responses showed similar ERN activity as aware errors, in comparison with decreased activity for unaware errors. Finally, compared with aware errors, uncertain responses and unaware errors showed reduced neural compensations, such as alpha suppression. Together these findings suggest that the ERN is activated by aware motor errors as well as sensory failures, and that both awareness and certainty are necessary for neural adaptations after errors.
Introduction
The human brain has developed the ability to detect errors and to make corresponding neural and behavioral adjustments (Debener et al., 2005; Marco-Pallarés et al., 2008; King et al., 2010; Danielmeier and Ullsperger, 2011; Cohen and van Gaal, 2013). Whether error-monitoring processes, such as the error-related negativity (ERN), and their accompanying behavioral and neural correlates are independent of awareness remains an important question. In particular, error awareness is hypothesized to be a marker for failures of insight in a number of conditions including traumatic brain injury (O'Keeffe et al., 2004) and substance use disorders (Hester et al., 2009b).
One influential study of error awareness (Nieuwenhuis et al., 2001) found that the ERN was similar for aware and unaware errors. Later studies supported this finding by showing either similar ERN amplitudes (Endrass et al., 2007, 2012; O'Connell et al., 2007; Shalgi et al., 2009;) or medial prefrontal cortex (mPFC) activity as assessed by functional magnetic resonance imaging (fMRI; Hester et al., 2005, 2009a; Klein et al., 2007) for both error types. However, other studies have found a contrasting pattern of higher ERN amplitude for aware errors (Steinhauser and Yeung, 2010; Wessel et al., 2011; Shalgi and Deouell, 2012). A recent review (Wessel, 2012) suggested that this controversy may be partially explained by differences in task design across studies, such as the inclusion or absence of a neutral (“don't know”) option for ratings of response accuracy. Additionally, previous studies have not tested whether the ERN activity differs for motor failures compared with failures at the sensory processing level. We considered the possibility that sensory processing failures could lead to high-conflict uncertain responses (“don't know”) that produce similar ERN activity as that evoked by motor errors. As a result, the ERN amplitude for unaware errors in studies that did not account for perceptually uncertain responses might have been increased because uncertain responses were misinterpreted as unaware errors. For this reason, in the current study we distinguished between aware errors, unaware errors, and uncertain responses and studied the differences in the P1 and N170 components (related to stimulus processing) to dissociate the source of the error (stimulus vs response related). We hypothesized that higher ERN amplitudes would be seen for aware errors and uncertain responses than for unaware errors.
Additionally, by taking into account these perceptually uncertain trials, we predicted that neural adjustments would occur only after aware errors. For example, an increased alpha power observed during intertrial intervals (ITIs) is interpreted as a metric of transient task disengagement. Previous studies have detected an alpha suppression after errors, indicating higher alertness (Carp and Compton, 2009). Moreover, recent fMRI studies have shown higher post-error interactions between mPFC and perceptual regions (King et al., 2010; Danielmeier et al., 2011). These post-error compensations (alpha suppression and increased mPFC–occipital connectivity) have not yet been tested in relation to error awareness. We hypothesized that post-error alpha suppression would be greater, and mPFC–occipital connectivity would be stronger, following aware compared with unaware errors.
Materials and Methods
Participants.
Thirty-four University of California Berkeley students participated in the experiment in exchange for monetary compensation. All subjects gave written informed consent in accordance with the Committee for the Protection of Human Subjects at the University of California, San Francisco and University of California, Berkeley. All subjects were right-handed and had normal or corrected-to-normal vision. Ages ranged from 18 to 40 years old; 24 were female. Sixteen subjects underwent one electroencephalogram (EEG) and one fMRI session. From those 16, 8 executed the EEG session first. An additional group of 18 subjects underwent only the EEG session. fMRI sessions are not further addressed in this report.
Paradigm and stimuli.
A total of 100 pictures of male and female individuals unknown to our subjects were used in the experiment. They were converted to black and white and resized to 113 × 151 pixels using Adobe Photoshop CS4 (Adobe Systems). Targets subtended 2.55 degrees of visual angle. Pictures were obtained from one of the authors (A.N.-C.) and from the Face Database of the Max-Planck Institute for Biological Cybernetics in Tübingen, Germany (http://faces.kyb.tuebingen.mpg.de; Troje and Bülthoff, 1996). The task was presented using Presentation software (Neurobehavioral Systems). Participants completed an average of 483.5 trials (SD = 42.5, range = 308–564). In each trial (Fig. 1), they were presented with one target and four flanker human faces, and they were asked to respond as quickly and accurately as possible whether the target face was upright or upside down. The trial started with a fixation cross for 200 ms. Flanker faces (congruent or incongruent with the target) were then shown alone for 80 ms and together with the target for an additional 30 ms. After the flanker and target faces disappeared, a group of five asterisks was presented in the middle of the screen for 500 ms. Subjects made a button press to indicate whether the target was upright or upside down before the group of asterisks disappeared. There was a third button that they could press if they were uncertain; subjects were instructed not to guess. To permit us to differentiate between aware and unaware errors, participants rated their accuracy in their previous response with a button press after a variable time interval (500 ms, 2000 ms, or 3500 ms) whose duration reduced time pressure on error reporting and permitted the same paradigm to be used in fMRI studies. Subjects pressed the same button again if they thought that their response was correct, the opposite button if they thought that their response was incorrect, or a third button if they were not sure. In 10% of the trials the stimuli were profile instead of frontal faces (not further analyzed here).
Figure 1.

After a fixation cross, flanker faces (congruent or incongruent with the target) were shown alone for 80 ms and then together with the target for 30 ms more. Participants were instructed to indicate with a button press whether the target was upright or upside down. They could press a different button if they were uncertain. After a jittered time interval, participants rated their previous response (accuracy rating) by pressing the same button again (correct), the opposite button (incorrect), or the uncertain button.
Two participants with excessive artifacts in the EEG recordings were excluded from the analyses. From the remaining 32 subjects, only those who had a least 10 trials for each condition were included in the analyses. Thirty subjects had enough trials in the aware errors and correct responses conditions. The average number of aware errors was 51 and the average number of correct responses was 357. Thirteen participants had enough trials in the unaware errors condition and 11 in the uncertain responses condition. In these subjects, the average number of unaware errors was 28 and the average number of uncertain responses was 21. Only six subjects had enough trials in all the conditions, including the unaware errors and uncertain responses conditions. For that reason, two groups of analysis were performed separately: we compared the unaware errors with the aware errors and correct responses (N = 13), and the uncertain responses with the aware errors and correct responses (N = 11).
Behavioral analysis.
We analyzed the reaction times for each of the different types of responses. Previous research has shown increased response times associated with attentional lapses (Weissman et al., 2006; van Driel et al., 2012). Based on these previous studies, in the current study we hypothesized that uncertain responses might be related to transient inattention and might show significantly slower reaction times (RTs).
For the statistical analysis, three ANOVAs were carried out. In the first ANOVA (n = 13; group of subjects with enough unaware errors) we compared the reaction times for aware errors, unaware errors, and correct responses. In the second ANOVA (n = 11; group of subjects with enough uncertain responses) we compared aware errors, uncertain responses, and correct responses. A third ANOVA included a subsample of six subjects who had both enough unaware errors and uncertain responses (at least 10 trials) and compared all the conditions (aware errors, unaware errors, uncertain responses, and correct responses). Post hoc comparisons were made using the least significant difference test (Fisher, LSD).
Because our task was designed to reduce time pressure on error reporting and to translate easily to the MRI scanner, our post-response intervals of 500–3500 ms and ITIs of 1500–5500 ms were much longer than in other error awareness paradigms. Previous research has shown that the magnitude of post-error slowing, a common behavioral finding in error awareness paradigms, depends on the size of the ITI (Jentzsch and Dudschig, 2009; Danielmeier and Ullsperger, 2011). In particular, as the size of the post-response interval increases to 1500 ms or greater, these authors found no detectable slowing in post-error trials relative to post-correct trials. Because our intervals are well outside the durations within which this post-error slowing has previously been detected, we did not expect to find differences in RT after errors compared with correct responses. Nonetheless, to potentially increase our sensitivity to detect post-error slowing following these longer intervals, we used a method proposed by Dutilh et al. (2012) to reduce the influence of global fluctuations of motivation and response caution. Specifically, when comparing post-error mean RT with post-correct mean RT, we used only those post-correct trials that were also pre-error trials. As for the more traditional measure of post-error slowing (Rabbitt, 1966), no significant slowing was identified following aware errors versus correct trials.
EEG procedure.
EEG data were collected from 64 channels at a sampling rate of 512 Hz (Biosemi; http://www.biosemi.com). Vertical and horizontal eye movements were recorded using electrooculography electrodes. EEG data analysis was performed using MATLAB scripts based on functions from the EEGLAB toolbox (Delorme and Makeig, 2004). The data were filtered off-line to remove frequencies >50 Hz and <0.3 Hz. Portions of continuous data with excessive artifact were rejected after visual inspection. In addition, independent components were estimated for individual subjects using the filtered but unsegmented EEG data to identify and remove eye-movement and muscular artifacts.
Event-related potential analysis.
Data were segmented and time locked to the onsets of the response (for analysis of the ERN and the Pe components) and the onsets of the target (for the analysis of the P1 and N170 components). These epochs were then separated based upon whether they encompassed aware errors, unaware errors, correct responses, or uncertain responses. Epochs were created starting 200 ms before the onset of the event and finishing 800 ms after it. The time window from −200 to 0 was used as a baseline.
For the ERN component, three frontocentral electrode sites were selected for analysis (Fz, FCz, and Cz; see Fig. 3). The average maximum amplitude between −20 and 50 ms around the onset of the response was calculated to measure the activity of the ERN component. Event-related potential (ERP) evidence for errors was also obtained by identifying a posterior positive component, the Pe. In previous studies (Ridderinkhof et al., 2009), Pe topography showed a maximum activity in frontocentral sites. Nine electrodes were selected for analysis (FC1, FCz, FC2, C1, Cz, C2, CP1, CPz, and CP2). The average maximum amplitude between 200 and 500 ms after the onset of the response was calculated to measure this activity. For the P1 and N170 extrastriate ERP components, four channels were selected for analysis (PO7, O1, O2, and PO8; see Fig. 3). The average of a 20 ms time window surrounding the first positive peak following the onset of the target face was calculated across that group of electrodes and used as a measure of the P1 component. For the N170 component, the average maximum amplitude between 120 and 160 ms following the onset of the target face was calculated. Statistical analyses were performed in SPSS (Statistical Package for Social Sciences 15.0 for Windows). Two repeated measures ANOVAs were carried out. For the first ANOVA (n = 13), factors were ERP “component” (ERN, Pe, P1, and N170) and “response” (Aware error, Unaware error, and Correct response). For the second ANOVA (n = 11), factors were component and response (Aware error, Uncertain response, and Correct response). Post hoc comparisons were made with the Fisher, LSD.
Figure 3.
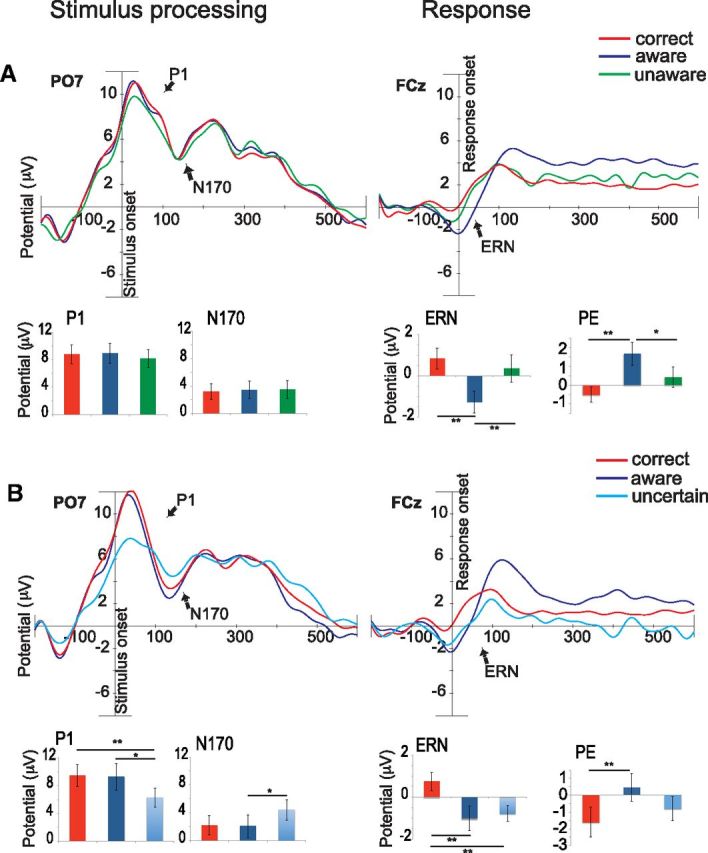
Stimulus-locked grand averages in channel P07 (left) and response-locked grand averages in channel FCz (right). The bar graphs show ERP amplitudes for the average of the P1 and N170 effect (PO7, O1, O2, and PO8), the ERN effect (Fz, FCz, and Cz), and the Pe effect (FC1, FCz, FC2, C1, Cz, C2, CP1, CPz, and CP2). Aware errors are depicted in dark blue, unaware errors in green, uncertain responses in light blue, and correct responses in red. A, ERP grand average and amplitudes in the group of subjects who had enough unaware errors (n = 13). B, ERP grand average and amplitude in the group of subjects who had enough uncertain responses (n = 11). The bar graphs reveal smaller P1 and N170 amplitudes for perceptually uncertain responses (lower left graphs) compared with the other conditions, and higher ERN amplitudes for aware (upper and lower right graph) and uncertain responses (lower right graph) compared with the other conditions. Significant differences are indicated by asterisks (*p < 0.05, **p < 0.01).
Time-frequency analysis.
Time-frequency calculations were computed using MATLAB scripts based on functions from the EEGLAB toolbox. Specifically, we used the “newtimef” function available for EEGLAB to calculate the event-related changes in spectral power relative to baseline (event-related spectral perturbation; ERSP). The use of the Morlet wavelet decomposition in this function allows power changes to be observed in both the time and frequency domains, in contrast with fast Fourier transform methods that only have resolution in the frequency domain. Data were filtered to remove frequencies >250 Hz and <0.3 Hz and then segmented and time locked to the onset of the target face. As for ERP analyses, these epochs were then separated into groups based upon the identification of aware errors, unaware errors, correct responses, or uncertain responses. The epochs were created starting 1500 ms before the onset of the response and finishing 2000 ms after it. The time window from −1000 ms to −700 ms was used as a baseline since the stimulus presentation generally occurred in the time window from −500 to 0 and to avoid edge and border artifacts. These epochs were then converted to current source density (CSD) using the methods of Kayser and Tenke (2006) to diminish volume conduction effects. We were interested in power in the theta band as a measure of error monitoring (Luu et al., 2004; Debener et al., 2005; Trujillo and Allen, 2007), and power in the alpha band as a measure of post-error modulations in cortical arousal (Carp and Compton, 2009; Compton et al., 2011). The electrode sites and time windows for the analysis were chosen based on previous research that assessed post-error theta power (Cavanagh et al., 2009) and alpha suppression (Carp and Compton, 2009). Two time windows were chosen to quantify ERSP changes in theta (from 0 to 500 ms, 4–8 Hz) and alpha (from 0 to 1000 ms, 8–13 Hz). The electrode site FCz is in the most representative location for post-error monitoring activity and has been used in previous research (Cavanagh et al., 2009) to measure post-error theta power. Also based on previous research (Carp and Compton, 2009), one posterior midline channel location (Pz) was chosen as one of the most representative electrodes to measure alpha suppression. For the statistical analysis, two ANOVAs were carried out. For the first ANOVA (n = 13), factors were “frequency” (theta and alpha) and “response” (Aware error, Unaware error, and Correct response). For the second ANOVA (n = 11), factors were frequency and response (Aware error, Uncertain response, and Correct response). Post hoc comparisons were made with the least significant difference test (Fisher, LSD).
Phase-coherence analysis.
To calculate the phase coherence across channels we used the newcrossf function in EEGLAB. This function determines the degree of synchrony between the time-frequency activations of two channels. Phase-coherence values vary between 0 and 1, where a value of one represents two perfectly synchronized signals. To study the phase coherence following the different types of responses (correct, aware, unaware, and uncertain), we again analyzed the epochs converted to CSD for the time frequency analyses. Additionally, we studied the phase coherence following stimulus presentation by creating epochs starting at 1500 ms before the onset of the stimulus and finishing 2000 ms after it, and separating these epochs into groups for aware errors, unaware errors, correct responses, or uncertain responses. We subtracted a pretrial baseline phase coherence level calculated for the time window from −1000 to −700 ms, as in the time frequency analysis. This subtraction aimed to remove the background coherence and target event-related coherence. Based on previous research (Cavanagh et al., 2009), we used the channel FCz for mPFC, and, consistent with our ERP analysis, we used channels PO7, O1, O2, and PO8 to represent presumptive visual areas. The time window from 0 to 200 ms and the frequency range from 4 to 8 Hz (theta) were chosen for the analysis. Two one-way ANOVAs were carried out. For the first ANOVA (n = 13), factors were “event” (stimulus onset and response onset), “hemisphere” (right and left), and “response” (Aware error, Unaware error, and Correct response). For the second ANOVA (n = 11), factors were also event, hemisphere, and response (Aware error, Uncertain response. and Correct response). Post hoc comparisons were made with the least significant difference test (Fisher, LSD).
Results
Behavioral results
Analyzed participants made an average of 11.3% aware errors, 4.1% unaware errors, and 2.6% uncertain responses. In the group of subjects with enough unaware errors (n = 13; see Materials and Methods), we identified differences in mean RT between the different responses (correct, aware, and unaware: F(2,11) = 16.79, p < 0.001; Fig. 2A). Post hoc comparisons demonstrated significantly faster RTs for aware errors compared with correct responses (p < 0.001) and compared with unaware errors (p = 0.001), as well as significantly slower RTs for unaware errors compared with correct responses (p = 0.006). Similarly, in the group of subjects with enough uncertain responses (n = 11), RT differences were seen between the responses (correct, aware, and uncertain; F(2,9) = 25.9, p < 0.001). As shown in Figure 2B, average RTs were significantly faster for aware errors compared with correct responses (p = 0.009) and compared with uncertain responses (p = 0.001). Notably, average RTs were significantly slower for uncertain responses compared with correct responses (p < 0.001).
Figure 2.

Slower RTs are found when subjects report uncertain responses, while faster RTs are associated with aware errors. A, RTs (in milliseconds) for correct responses, aware, and unaware errors, in the group of subjects who had enough unaware errors (n = 13). B, RTs for correct responses, aware errors, and uncertain responses, in the group of subjects who had enough uncertain responses (n = 11). C, RTs for correct responses (corr), uncertain responses (uncert), aware errors (aw), and unaware errors (unaw), in the group of subjects who had both enough unaware errors and enough uncertain responses (n = 6). Significant differences are indicated by asterisks (*p < 0.05, **p < 0.01).
A third ANOVA identified significant differences in RT (F(3,3) = 15.33, p < 0.001; Fig. 2C) for the six subjects who had both enough unaware errors and uncertain responses (at least 10 trials; see Materials and Methods). Post hoc comparisons demonstrated significantly faster reaction times for aware errors compared with correct responses (p = 0.039) and compared with uncertain responses (p = 0.006), as well as significantly slower RTs for uncertain responses compared with correct responses (p = 0.009) and compared with unaware errors (p = 0.016). Altogether, these results indicate that aware errors are associated with faster RTs, while subjects take longer to respond whenever they are uncertain, in agreement with previous studies that show slower response times related to uncertainty (Pailing and Segalowitz, 2004; Wessel et al., 2011) and inattention (Weissman et al., 2006; van Driel et al., 2012).
Throughout the above trials, the same combination of stimuli (target with flankers) was never repeated. However, because each target face itself was repeated an average of 4.8 times per subject, we compared initial and subsequent presentations of each target face to ensure that repetition of the target stimulus could not explain our results. We found no significant differences in accuracy between those trials in which the target was presented for the first time and those trials in which the target was repeated (t(17) = 1.59, p = 0.13). We also did not find differences in RTs between trials with new and repeated faces (t(17) = 1.31, p = 0.21).
Last, to reduce time pressure on error reporting and to permit direct translation to fMRI paradigms (see Materials and Methods), our post-response and ITIs were significantly longer than those typically used to study post-error slowing, and previous work suggests that post-error slowing would be difficult to detect in our paradigm (Jentzsch and Dudschig, 2009; Danielmeier and Ullsperger, 2011; see Materials and Methods). Nonetheless, we evaluated our data for post-error slowing, defined as the post-error mean RT minus the pre-error mean RT for post-correct trials that were also pre-error trials (Dutilh et al., 2012; see Materials and Methods). As predicted, for aware errors, unaware errors, and uncertain responses, we observed no significant differences in the response times after the different types of responses studied (correct, aware, unaware, and uncertain; F(2,4) = 1.86, p = 0.21).
ERP results
To analyze ERP differences between correct responses, aware errors, and unaware errors, we used a repeated-measures ANOVA with two factors (Fig. 3A). One factor, component, had four levels (ERN, Pe, P1, and N170), and the second factor, response type, had three levels (correct, aware, and unaware). The ERN and Pe components were used to measure error monitoring-related processes, while the stimulus-locked P1 and N170 were used to measure possible failures at the time of stimulus processing. There were significant differences between the components (ERN, Pe, P1, and N170; F(3,10) = 43.87, p < 0.0001). More notably, the interaction of Component by Response type (F(3,10) = 8.68, p < 0.0001) showed significant differences that were explored further with pairwise comparisons using the least significant difference test (Fisher, LSD). Consistent with the previous literature, the ERN showed significantly greater amplitudes for aware errors as compared with correct responses (p = 0.001). However, as predicted, and in distinction with some previous literature (Nieuwenhuis et al., 2001; Endrass et al., 2007; O'Connell et al., 2007; Shalgi et al., 2009), the ERN also showed significantly higher amplitudes for aware errors than unaware errors (p = 0.008); and no differences were found between correct responses and unaware errors (p = 0.121). Moreover, no differences were found for either the P1 or the N170 between any of the three conditions (correct, aware, and unaware), a result suggesting that the differences in the ERN amplitude for unaware errors are not due to failures at the sensory processing stage. In support of these findings, a second waveform sensitive to errors–the Pe, or error positivity (Overbeek et al., 2005)–also differentiated these trial types. As in previous research (Nieuwenhuis et al., 2001; Endrass et al., 2005), the Pe showed higher amplitudes in aware errors than in unaware errors (p = 0.046) and in aware errors compared with correct responses (p = 0.001). Additionally, there were no differences in the Pe amplitude between correct responses and unaware errors.
To analyze the ERP differences between correct responses, aware errors, and uncertain responses, we performed a second ANOVA in the group of 11 subjects who had enough uncertain responses (Fig. 3B). There were significant differences between the ERP components (F(3,8) = 33.01, p < 0.0001) and for the interaction of component by response type (F(3,8) = 9.82, p < 0.0001). For the ERN component, pairwise comparisons (Fisher, LSD) again showed higher amplitudes in aware errors than in correct responses (p = 0.003) and in uncertain compared with correct responses (p = 0.003). In contrast, no differences were seen between aware errors and uncertain responses (p = 0.631), suggesting the aware errors and uncertainty both generate an ERN. However, uncertain responses were distinguished from aware errors by smaller stimulus-sensitive ERPs including the P1 (p = 0.037) and the N170 (p = 0.045). Additionally, the P1 was smaller for uncertain responses compared with correct responses (p = 0.004). These results indicate that uncertain responses may be due to stimulus processing failures, suggested by smaller P1 and N170 amplitudes, which contribute to conflict at the response stage, reflected in similar ERN responses as those for aware errors. Last, results for the Pe component agreed with those for the ERN: significant differences were seen between aware errors and correct responses (p = 0.001), but not between aware errors and uncertain responses.
Time-frequency results
In addition to distinctive patterns in the ERP amplitudes, these trials could be differentiated by their time-frequency spectra. A diminished alpha power after errors, compared with correct responses, has been suggested as indicative of higher alertness (Carp and Compton, 2009) and reflective of the neural adjustments necessary to compensate for errors. Time-frequency analyses were performed to test whether a possible post-error alpha suppression was specific for aware errors or was also found after unaware errors. Additionally, we analyzed theta activity after errors since this frequency band has been studied in relation to error monitoring and learning, and the ERN component has been suggested to emerge from phase locking of theta band EEG activity (Luu and Tucker, 2001; Luu et al., 2004). Figure 4A shows the results for alpha and theta power when comparing aware errors, unaware errors, and correct responses. Significant differences were found between the theta and alpha bands across all trial types (F(1,12) = 14.85, p = 0.002). Moreover, no differences in the factor response type (between aware errors, unaware errors and correct responses; F(2,11) = 1.9, p = 0.17) were seen across frequencies. However, significant differences were found in the interaction of frequency (alpha and theta) by response type (F(2,11) = 14.34, p < 0.0001). In agreement with the previous literature (Carp and Compton, 2009; Compton et al., 2011), pairwise comparisons (Fisher, LSD) demonstrated reduced alpha activity (post-error alpha suppression) after aware errors compared with correct responses (p = 0.006). These post-error neural compensations were specific for aware errors, as suggested by a higher post-error suppression in aware errors compared with unaware errors (p = 0.021). No differences in the alpha band were found between correct responses and unaware errors (p = 0.17). Similarly, higher theta activity was seen for aware errors compared with correct responses (p < 0.0001), consistent with the results for the ERN response. There was also a higher theta power in aware errors compared with unaware errors (p = 0.013). No differences were found between unaware errors and correct responses (p = 0.11).
Figure 4.
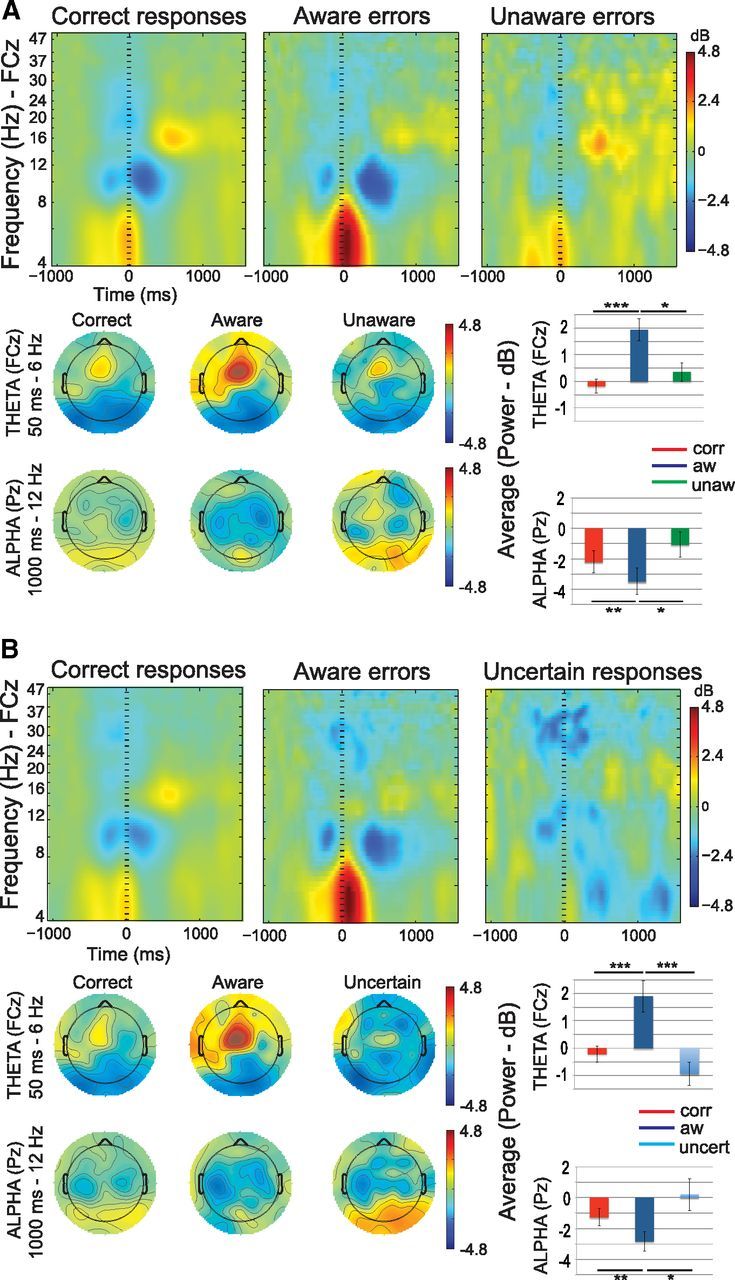
Event-related changes in the power spectrum (top figures), topographies for theta and alpha frequencies (lower left figures), and average in the FCz channel for theta and alpha changes (bottom right figures), in the group of subjects who had enough unaware errors (A), and the group of subjects who had enough uncertain responses (B). The bar graphs show an increase in theta power and a decrease in alpha power after aware errors compared with the other conditions. Notice that the bar graphs show the averages for the frequencies (theta, 4 to 8 Hz and alpha, 8 to 13 Hz) and time windows (theta, 0 to 500 ms and alpha, 0 to 1000 ms) included in the analysis. Significant differences are indicated by asterisks (*p < 0.05, **p < 0.01, ***p < 0.001).
Figure 4B shows the results for alpha and theta power when comparing uncertain responses, aware errors, and correct responses. In this ANOVA, there were differences between alpha and theta (F(1,10) = 6.08, p = 0.033), but not for the factor response type (F(2,9) = 0.7, p = 0.29). The interaction of frequency (alpha and theta) by response type (correct, uncertain, and aware) was significant (F(2,9) = 27.98, p < 0.0001). Posterior pairwise comparisons (Fisher, LSD) again showed a post-error alpha suppression effect in this group of subjects, suggested by lower alpha power in aware errors compared with correct responses (p = 0.002). However, this effect was not present after perceptually uncertain trials, as we found a higher alpha suppression in aware errors compared with uncertain responses (p = 0.016). Last, no differences were found between correct and uncertain responses in the alpha band (p = 0.13). These last results indicate that not only awareness, but also certainty, are necessary for this neural compensation (i.e., post-error alpha suppression) to occur after errors. Additionally, the data showed higher theta power for aware errors compared with correct responses (p < 0.0001), and for aware errors compared with uncertain responses (p < 0.0001), a finding that differs from the ERN results found in this group of subjects (Fig. 3B). No differences were found between correct and uncertain responses in this frequency band (p = 0.06).
Phase-coherence results
Other post-error neural compensations have been proposed to be related to the degree of post-error interaction between error monitoring areas and task-relevant sensory regions (King et al., 2010; Danielmeier et al., 2011). To address this possibility, we analyzed the phase-coherence between mPFC and occipital channels in a 200 ms window following the onset of the event (either stimulus or response) for each of the different response types. First, in Figure 5A, we compared correct responses, aware errors, and unaware errors. For this comparison we used a repeated-measures ANOVA with three factors: one factor, “event,” with two levels (stimulus and response); another factor, “hemisphere,” with two levels (right and left); and a third factor, “response type,” with three levels (correct, aware, and unaware). There were significant differences between the type of event (stimulus vs response; F(1,12) = 21.27, p < 0.001). No differences were found for the response, hemisphere, or the interaction of the conditions. Following the response, a pairwise comparison demonstrated higher phase coherence after the onset of aware errors compared with correct responses in the right hemisphere (p = 0.025), but not in the left hemisphere. A trend toward phase-coherence differences was found between aware errors and correct responses after the onset of stimulus presentation (p = 0.09). No differences were found either between correct responses and unaware errors, or between aware and unaware errors after the onset of the stimulus or the response.
Figure 5.
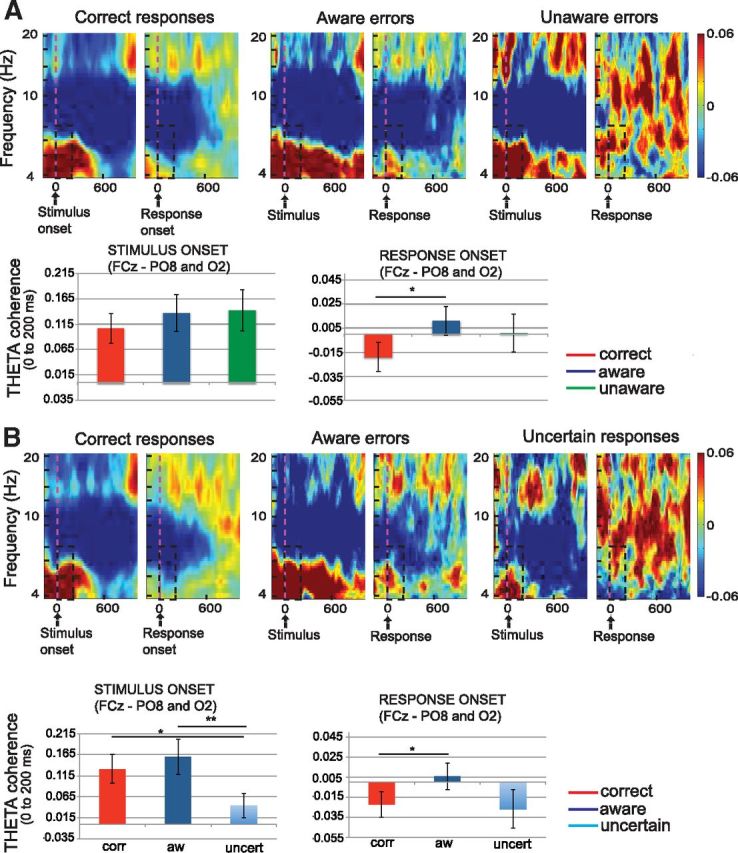
Phase coherence (theta) following stimulus presentation and the onset of the response between mPFC (channel FCz) and sensory processing areas (channels PO7, PO8, O1, and O2), in the group of subjects who had enough unaware errors (A) and the group of subjects who had enough uncertain responses (B). Notably, perceptually uncertain trials are distinguished by significantly reduced mPFC–occipital phase coherence at the time of stimulus presentation compared with the other conditions (correct responses, aware, and unaware errors). Following the response, trials for the aware errors condition demonstrate increased phase coherence relative to correct trials. Significant differences are indicated by asterisks (*p < 0.05, **p < 0.01).
Figure 5B shows phase-coherence results between mPFC and occipital channels for the correct responses, aware errors, and uncertain responses. Significant differences were seen between the type of event (stimulus and response; F(1,10) = 18.28, p < 0.002) and the type of response (correct, aware, uncertain; F(2,9) = 4.52, p < 0.024) but not between hemispheres (F(1,10) = 2.37). In addition, a significant interaction of response type (correct, aware, and uncertain) with event was noted (F(2,9) = 5.21, p < 0.015). Pairwise comparisons showed less phase coherence in the right hemisphere following stimulus onset when subjects reported they were uncertain compared with the correct condition (p = 0.017) and the aware errors condition (p = 0.004). These results corroborate the ERP findings, in that uncertain responses may be related to reduced connectivity between prefrontal and occipital areas. Last, unlike the previous analysis in the group of 13 subjects, this group showed only a trend toward higher phase coherences after the onset of aware errors compared with correct responses (p = 0.071). No differences were found either between correct and uncertain responses, or between aware errors and uncertain responses after the onset of the response.
Together, these results suggest that although neural compensations following the response (mPFC–occipital phase coherence) may take place after aware errors compared with correct responses, neural activity also changes following stimulus presentation for perceptually uncertain trials, which are accompanied by reduced connectivity. In addition, our results show an enhancement of right-lateralized phase coherence between mPFC and sensory (face) processing areas after aware errors, potentially in agreement with a more prominent activity of the fusiform face area in the right hemisphere (Rossion et al., 2000).
Discussion
In the current study we differentiated perceptual and motor errors with and without awareness and studied both the processes and the adjustments they evoked. First, we found that early activity in the mPFC (ERN) distinguished aware errors and uncertain responses from unaware errors. Because the ERN was equally activated after perceptual failures and motor errors, our data suggest that it may be related to response conflict rather than the specific detection of incorrect motor commands (van Veen and Carter, 2002a,b). Second, ERPs evoked by stimulus processing (P1 and N170) allowed us to verify that uncertain responses could be distinguished from aware and unaware errors by their reduced stimulus-related activity in extrastriate cortices. Third, we analyzed neural adjustments elicited by errors (alpha suppression and post-error mPFC–occipital phase coherence) and demonstrated that these neural compensations were higher after aware than unaware errors.
Different types of errors
Errors can originate from failures in response selection or failures in response execution (Postma, 2000). Errors can also be related to failures at the time of sensory processing, due, for example, to data-limited processing (Rabbitt, 1966; Scheffers and Coles, 2000) or because of fluctuations in attention. Importantly, our data allowed us to distinguish the possible causes for these different failures. As a result, we observed a diminished activity for uncertain responses in ERPs (P1 and N170) sensitive to stimulus processing. In addition, uncertain responses were accompanied by significantly increased response times. Consistent with these findings, it has previously been argued that slower response times are indicative of uncertainty (Pailing and Segalowitz, 2004; Wessel et al., 2011) and attentional lapses (Weissman et al., 2006; van Driel et al., 2012), supporting the hypothesis that these failures in the current study may be related to transient inattention.
With respect to response-related measures, such as the ERN, the current data also support recent EEG (Steinhauser and Yeung, 2010; Wessel et al., 2011) and fMRI (Hester et al., 2012; Orr and Hester, 2012; Klein et al., 2013) studies that cite the ERN component as associated with the level of error awareness. Specifically, the current data demonstrate that ERN amplitudes are greater for aware errors and uncertain responses (but not unaware errors) relative to correct responses. Other studies have reached similar conclusions. In a recent experiment by Shalgi and Deouell (2012) for example, participants, after responding (correct or error), bet money on their judgment to evaluate the level of confidence of their responses. We found a higher ERN for high confident aware errors compared with high confident unaware errors. In the current study, due to the low rate of uncertain responses, it would have been difficult to separate the uncertain trials into different levels of certainty; however, based on previous research (Pailing and Segalowitz, 2004), it is possible that the ERN amplitude may correlate positively with the level of error certainty.
Additionally, an enhanced theta power is observed after aware errors (Luu et al., 2004; Debener et al., 2005; Trujillo and Allen, 2007; Cavanagh et al., 2009), with some studies suggesting that the ERN activity may emerge from phase resetting of ongoing theta band activity (Luu and Tucker, 2001; Luu et al., 2004). Despite the fact that both aware errors and uncertain responses showed a similar ERN amplitude, aware errors showed greater theta power than uncertain responses. This discrepancy might result if aware errors demonstrated more theta activity that was not phase locked to the response (Trujillo and Allen, 2007), and thus was not visible in the ERN. Further data would be necessary to explore this possibility.
Neural adjustments
Post-error slowing (Rabbitt, 1966), defined as longer RTs in trials following erroneous trials, is often used to measure behavioral adjustments after errors. These behavioral compensations have also been studied along with neural compensations, such as neuronal changes dedicated to inhibiting distractors and enhancing task-relevant activity (King et al., 2010; Danielmeier et al., 2011). One of these neural compensations can be seen in post-error alpha power. During task performance, an increased alpha power is commonly observed in the ITI as a sign of task disengagement/decreased attention. Previous research has observed a suppression of the alpha activity following errors (Carp and Compton, 2009) and conflict (Compton et al., 2011), suggesting higher alertness following these type of trials. Although our task was not designed to capture behavioral measures of post-error slowing, our electrophysiological data demonstrated alpha suppression in the ITI following aware errors, but not after unaware errors or uncertain responses, arguing that error-monitoring mechanisms only led to these compensations when subjects were aware and certain of error commission. These data differ from previous research that has found a greater alpha suppression after inattention-related errors (van Driel et al., 2012). More research would be needed to determine whether our uncertain errors are truly due to attentional lapses and, if so, whether these types of failures are followed by an alpha suppression.
Enhanced top-down control following errors
Other post-error compensations imply changes in connectivity between error-monitoring areas and regions dedicated to inhibiting distractors or enhancing task-relevant activity. One possibility is that the mPFC interacts with lateral prefrontal areas and/or sensory regions to increase cognitive control after errors (Garavan et al., 2002; Kerns et al., 2004; Cavanagh et al., 2009). Recent research has found, for example, a correlation between neural activity in mPFC and motor and visual areas after errors (Cohen et al., 2009; King et al., 2010; Danielmeier et al., 2011). Our results show higher phase coherence between mPFC and occipital areas after aware errors, suggesting an increased top-down control over sensory processing areas. This connectivity may be oriented to change behavior and reduce the frequency of future errors, since a direct relationship between the functional correlation of these areas and behavioral adjustments after errors has been found (Danielmeier et al., 2011).
Methodological Issues
Finally, several previous studies have dissociated different types of errors to study the similarities and differences in the neural processes they evoke (Christ et al., 2000; Steinhauser and Kiesel, 2011; van Driel et al., 2012). In this context, the classical method for signaling errors in error awareness studies has been noted to have limitations (Wessel, 2012). These limitations stem in part from the aforementioned fact that errors can result for multiple reasons. Another methodological problem across studies concerns the rating of accuracy (for review, see Wessel, 2012). Some studies asked their participants to simply report when they made an error (Nieuwenhuis et al., 2001; O'Connell et al., 2007; Maier et al., 2008; Shalgi et al., 2009; Steinhauser and Yeung, 2010; Dhar et al., 2011; Hughes and Yeung, 2011), while others used a forced-choice rating in which participants had to rate both errors and correct responses (Endrass et al., 2007; Wessel et al., 2011). Still others included a third option for neutral or uncertain responses (Endrass et al., 2007; Hewig et al., 2011) or used a parametric evaluation to quantify the uncertainty of the error (Scheffers and Coles, 2000). In addition, other factors may complicate the reporting of errors: for example, short ITIs may prevent the detection of errors because the participants do not have time to signal them (Ullsperger et al., 2010; Wessel et al., 2011). This latter issue may partly explain why, in contrast with some of the previous studies of error awareness, our neural results differentiate aware from unaware errors (see below), as our experiment provides the participants with long ITIs that allow them to signal errors with reduced time pressure. Moreover, by providing an uncertain response option, we addressed a specific hypothesis about the neural correlates of unaware errors by separating errors in which stimulus-related factors (uncertain trials) are implicated from both known errors of motor commission or motor mapping (aware errors) and unrecognized errors (unaware errors).
Conclusions
In summary, our results show that although post-error neural adjustments are only seen for aware errors, earlier processes in the mPFC also show distinct neural activity for uncertain responses (i.e., in the ERN). These data indicate that early error monitoring processes may play a role in the emergence of awareness. Future work might profitably explore whether efforts to enhance the emergence of this activity might correlate with improvements in insight in vulnerable populations.
Footnotes
This research was supported by the Alcoholic Beverage Medical Research Foundation/The Foundation for Alcohol Research (A.S.K.), by funds from the State of California (A.S.K.), and by National Institute of Neurological Disorders and Stroke Grant NS 21135 (R.T.K.). We thank our subjects for their participation in this study.
References
- Carp J, Compton RJ. Alpha power is influenced by performance errors. Psychophysiology. 2009;46:336–343. doi: 10.1111/j.1469-8986.2008.00773.x. [DOI] [PubMed] [Google Scholar]
- Cavanagh JF, Cohen MX, Allen JJ. Prelude to and resolution of an error: EEG phase synchrony reveals cognitive control dynamics during action monitoring. J Neurosci. 2009;29:98–105. doi: 10.1523/JNEUROSCI.4137-08.2009. [DOI] [PMC free article] [PubMed] [Google Scholar]
- Christ S, Falkenstein M, Heuer H, Hohnsbein J. Different error types and error processing in spatial stimulus-response-compatibility tasks: behavioural and electrophysiological data. Biol Psychol. 2000;51:129–150. doi: 10.1016/S0301-0511(99)00034-4. [DOI] [PubMed] [Google Scholar]
- Cohen MX, van Gaal S. Dynamic interactions between large-scale brain networks predict behavioral adaptation after perceptual errors. Cereb Cortex. 2013;23:1061–1072. doi: 10.1093/cercor/bhs069. [DOI] [PMC free article] [PubMed] [Google Scholar]
- Cohen MX, van Gaal S, Ridderinkhof KR, Lamme VA. Unconscious errors enhance prefrontal-occipital oscillatory synchrony. Front Hum Neurosci. 2009;3:54. doi: 10.3389/neuro.09.054.2009. [DOI] [PMC free article] [PubMed] [Google Scholar]
- Compton RJ, Arnstein D, Freedman G, Dainer-Best J, Liss A. Cognitive control in the intertrial interval: evidence from EEG alpha power. Psychophysiology. 2011;48:583–590. doi: 10.1111/j.1469-8986.2010.01124.x. [DOI] [PubMed] [Google Scholar]
- Danielmeier C, Ullsperger M. Post-error adjustments. Front Psychol. 2011;2:233. doi: 10.3389/fpsyg.2011.00233. [DOI] [PMC free article] [PubMed] [Google Scholar]
- Danielmeier C, Eichele T, Forstmann BU, Tittgemeyer M, Ullsperger M. Posterior medial frontal cortex activity predicts post-error adaptations in task-related visual and motor areas. J Neurosci. 2011;31:1780–1789. doi: 10.1523/JNEUROSCI.4299-10.2011. [DOI] [PMC free article] [PubMed] [Google Scholar]
- Debener S, Ullsperger M, Siegel M, Fiehler K, von Cramon DY, Engel AK. Trial-by-trial coupling of concurrent electroencephalogram and functional magnetic resonance imaging identifies the dynamics of performance monitoring. J Neurosci. 2005;25:11730–11737. doi: 10.1523/JNEUROSCI.3286-05.2005. [DOI] [PMC free article] [PubMed] [Google Scholar]
- Delorme A, Makeig S. EEGLAB: an open source toolbox for analysis of single-trial EEG dynamics including independent component analysis. J Neurosci Methods. 2004;134:9–21. doi: 10.1016/j.jneumeth.2003.10.009. [DOI] [PubMed] [Google Scholar]
- Dhar M, Wiersema JR, Pourtois G. Cascade of neural events leading from error commission to subsequent awareness revealed using EEG source imaging. PLoS One. 2011;6:e19578. doi: 10.1371/journal.pone.0019578. [DOI] [PMC free article] [PubMed] [Google Scholar]
- Dutilh G, van Ravenzwaaij D, Nieuwenhuis S, van der Maas HLJ, Forstmann BU, Wagenmakers E-J. How to measure post-error slowing: a confound and a simple solution. J Math Psychol. 2012;56:208–216. doi: 10.1016/j.jmp.2012.04.001. [DOI] [Google Scholar]
- Endrass T, Franke C, Kathmann N. Error awareness in a saccade countermanding task. J Psychophysiol. 2005;19:275–280. doi: 10.1027/0269-8803.19.4.275. [DOI] [Google Scholar]
- Endrass T, Reuter B, Kathmann N. ERP correlates of conscious error recognition: aware and unaware errors in an antisaccade task. Eur J Neurosci. 2007;26:1714–1720. doi: 10.1111/j.1460-9568.2007.05785.x. [DOI] [PubMed] [Google Scholar]
- Endrass T, Klawohn J, Preuss J, Kathmann N. Temporospatial dissociation of Pe subcomponents for perceived and unperceived errors. Front Hum Neurosci. 2012;6:178. doi: 10.3389/fnhum.2012.00178. [DOI] [PMC free article] [PubMed] [Google Scholar]
- Garavan H, Ross TJ, Murphy K, Roche RA, Stein EA. Dissociable executive functions in the dynamic control of behavior: inhibition, error detection, and correction. Neuroimage. 2002;17:1820–1829. doi: 10.1006/nimg.2002.1326. [DOI] [PubMed] [Google Scholar]
- Hester R, Foxe JJ, Molholm S, Shpaner M, Garavan H. Neural mechanisms involved in error processing: a comparison of errors made with and without awareness. Neuroimage. 2005;27:602–608. doi: 10.1016/j.neuroimage.2005.04.035. [DOI] [PubMed] [Google Scholar]
- Hester R, Madeley J, Murphy K, Mattingley JB. Learning from errors: error-related neural activity predicts improvements in future inhibitory control performance. J Neurosci. 2009a;29:7158–7165. doi: 10.1523/JNEUROSCI.4337-08.2009. [DOI] [PMC free article] [PubMed] [Google Scholar]
- Hester R, Nestor L, Garavan H. Impaired error awareness and anterior cingulate cortex hypoactivity in chronic cannabis users. Neuropsychopharmacology. 2009b;34:2450–2458. doi: 10.1038/npp.2009.67. [DOI] [PMC free article] [PubMed] [Google Scholar]
- Hester R, Nandam LS, O'Connell RG, Wagner J, Strudwick M, Nathan PJ, Mattingley JB, Bellgrove MA. Neurochemical enhancement of conscious error awareness. J Neurosci. 2012;32:2619–2627. doi: 10.1523/JNEUROSCI.4052-11.2012. [DOI] [PMC free article] [PubMed] [Google Scholar]
- Hewig J, Coles MG, Trippe RH, Hecht H, Miltner WH. Dissociation of Pe and ERN/Ne in the conscious recognition of an error. Psychophysiology. 2011;48:1390–1396. doi: 10.1111/j.1469-8986.2011.01209.x. [DOI] [PubMed] [Google Scholar]
- Hughes G, Yeung N. Dissociable correlates of response conflict and error awareness in error-related brain activity. Neuropsychologia. 2011;49:405–415. doi: 10.1016/j.neuropsychologia.2010.11.036. [DOI] [PMC free article] [PubMed] [Google Scholar]
- Jentzsch I, Dudschig C. Why do we slow down after an error? Mechanisms underlying the effects of posterior slowing. Q J Exp Psychol. 2009;62:209–218. doi: 10.1080/17470210802240655. [DOI] [PubMed] [Google Scholar]
- Kayser J, Tenke CE. Principal components analysis of Laplacian waveforms as a generic method for identifying ERP generator patterns: II. Adequacy of low-density estimates. Clin Neurophysiol. 2006;117:369–380. doi: 10.1016/j.clinph.2005.08.033. [DOI] [PubMed] [Google Scholar]
- Kerns JG, Cohen JD, MacDonald AW, 3rd, Cho RY, Stenger VA, Carter CS. Anterior cingulate conflict monitoring and adjustments in control. Science. 2004;303:1023–1026. doi: 10.1126/science.1089910. [DOI] [PubMed] [Google Scholar]
- King JA, Korb FM, von Cramon DY, Ullsperger M. Post-error behavioral adjustments are facilitated by activation and suppression of task-relevant and task-irrelevant information processing. J Neurosci. 2010;30:12759–12769. doi: 10.1523/JNEUROSCI.3274-10.2010. [DOI] [PMC free article] [PubMed] [Google Scholar]
- Klein TA, Endrass T, Kathmann N, Neumann J, von Cramon DY, Ullsperger M. Neural correlates of error awareness. Neuroimage. 2007;34:1774–1781. doi: 10.1016/j.neuroimage.2006.11.014. [DOI] [PubMed] [Google Scholar]
- Klein TA, Ullsperger M, Danielmeier C. Error awareness and the insula: links to neurological and psychiatric diseases. Front Hum Neurosci. 2013;7:14. doi: 10.3389/fnhum.2013.00014. [DOI] [PMC free article] [PubMed] [Google Scholar]
- Luu P, Tucker DM. Regulating action: alternating activation of midline frontal and motor cortical networks. Clin Neurophysiol. 2001;112:1295–1306. doi: 10.1016/S1388-2457(01)00559-4. [DOI] [PubMed] [Google Scholar]
- Luu P, Tucker DM, Makeig S. Frontal midline theta and the error-related negativity: neurophysiological mechanisms of action regulation. Clin Neurophysiol. 2004;115:1821–1835. doi: 10.1016/j.clinph.2004.03.031. [DOI] [PubMed] [Google Scholar]
- Maier M, Steinhauser M, Hübner R. Is the error-related negativity amplitude related to error detectability? Evidence from effects of different error types. J Cogn Neurosci. 2008;20:2263–2273. doi: 10.1162/jocn.2008.20159. [DOI] [PubMed] [Google Scholar]
- Marco-Pallarés J, Camara E, Münte TF, Rodríguez-Fornells A. Neural mechanisms underlying adaptive actions after slips. J Cogn Neurosci. 2008;20:1595–1610. doi: 10.1162/jocn.2008.20117. [DOI] [PubMed] [Google Scholar]
- Nieuwenhuis S, Ridderinkhof KR, Blom J, Band GP, Kok A. Error-related brain potentials are differentially related to awareness of response errors: evidence from an antisaccade task. Psychophysiology. 2001;38:752–760. doi: 10.1111/1469-8986.3850752. [DOI] [PubMed] [Google Scholar]
- O'Connell RG, Dockree PM, Bellgrove MA, Kelly SP, Hester R, Garavan H, Robertson IH, Foxe JJ. The role of cingulate cortex in the detection of errors with and without awareness: a high-density electrical mapping study. Eur J Neurosci. 2007;25:2571–2579. doi: 10.1111/j.1460-9568.2007.05477.x. [DOI] [PubMed] [Google Scholar]
- O'Keeffe FM, Dockree PM, Robertson IH. Poor insight in traumatic brain injury mediated by impaired error processing?: evidence from electrodermal activity. Brain Res Cogn Brain Res. 2004;22:101–112. doi: 10.1016/j.cogbrainres.2004.07.012. [DOI] [PubMed] [Google Scholar]
- Orr C, Hester R. Error-related anterior cingulate cortex activity and the prediction of conscious error awareness. Front Hum Neurosci. 2012;6:177. doi: 10.3389/fnhum.2012.00177. [DOI] [PMC free article] [PubMed] [Google Scholar]
- Overbeek TJM, Nieuwenhuis S, Ridderinkhof KR. Dissociable components of error processing–on the functional significance of the Pe vis-à-vis the ERN/Ne. J Psychophysiol. 2005;19:319–329. doi: 10.1027/0269-8803.19.4.319. [DOI] [Google Scholar]
- Pailing PE, Segalowitz SJ. The effects of uncertainty in error monitoring on associated ERPs. Brain Cogn. 2004;56:215–233. doi: 10.1016/j.bandc.2004.06.005. [DOI] [PubMed] [Google Scholar]
- Postma A. Detection of errors during speech production: a review of speech monitoring models. Cognition. 2000;77:97–132. doi: 10.1016/S0010-0277(00)00090-1. [DOI] [PubMed] [Google Scholar]
- Rabbitt PM. Errors and error correction in choice-response tasks. J Exp Psychol. 1966;71:264–272. doi: 10.1037/h0022853. [DOI] [PubMed] [Google Scholar]
- Ridderinkhof KR, Ramautar JR, Wijnen JG. To P(E) or not to P(E): a P3-like ERP component reflecting the processing of response errors. Psychophysiology. 2009;46:531–538. doi: 10.1111/j.1469-8986.2009.00790.x. [DOI] [PubMed] [Google Scholar]
- Rossion B, Dricot L, Devolder A, Bodart JM, Crommelinck M, De Gelder B, Zoontjes R. Hemispheric asymmetries for whole-based and part-based face processing in the human fusiform gyrus. J Cogn Neurosci. 2000;12:793–802. doi: 10.1162/089892900562606. [DOI] [PubMed] [Google Scholar]
- Scheffers MK, Coles MG. Performance monitoring in a confusing world: error-related brain activity, judgments of response accuracy, and types of errors. J Exp Psychol Hum Percept Perform. 2000;26:141–151. doi: 10.1037/0096-1523.26.1.141. [DOI] [PubMed] [Google Scholar]
- Shalgi S, Deouell LY. Is any awareness necessary for an Ne? Front Hum Neurosci. 2012;6:124. doi: 10.3389/fnhum.2012.00124. [DOI] [PMC free article] [PubMed] [Google Scholar]
- Shalgi S, Barkan I, Deouell LY. On the positive side of error processing: error-awareness positivity revisited. Eur J Neurosci. 2009;29:1522–1532. doi: 10.1111/j.1460-9568.2009.06690.x. [DOI] [PubMed] [Google Scholar]
- Steinhauser M, Kiesel A. Performance monitoring and the causal attribution of errors. Cogn Affect Behav Neurosci. 2011;11:309–320. doi: 10.3758/s13415-011-0033-2. [DOI] [PubMed] [Google Scholar]
- Steinhauser M, Yeung N. Decision processes in human performance monitoring. J Neurosci. 2010;30:15643–15653. doi: 10.1523/JNEUROSCI.1899-10.2010. [DOI] [PMC free article] [PubMed] [Google Scholar]
- Troje NF, Bülthoff HH. Face recognition under varying poses: the role of texture and shape. Vision Res. 1996;36:1761–1771. doi: 10.1016/0042-6989(95)00230-8. [DOI] [PubMed] [Google Scholar]
- Trujillo LT, Allen JJ. Theta EEG dynamics of the error-related negativity. Clin Neurophysiol. 2007;118:645–668. doi: 10.1016/j.clinph.2006.11.009. [DOI] [PubMed] [Google Scholar]
- Ullsperger M, Harsay HA, Wessel JR, Ridderinkhof KR. Conscious perception of errors and its relation to the anterior insula. Brain Struct Funct. 2010;214:629–643. doi: 10.1007/s00429-010-0261-1. [DOI] [PMC free article] [PubMed] [Google Scholar]
- van Driel J, Ridderinkhof KR, Cohen MX. Not all errors are alike: theta and alpha EEG dynamics relate to differences in error-processing dynamics. J Neurosci. 2012;32:16795–16806. doi: 10.1523/JNEUROSCI.0802-12.2012. [DOI] [PMC free article] [PubMed] [Google Scholar]
- van Veen V, Carter CS. The timing of action-monitoring processes in the anterior cingulate cortex. J Cogn Neurosci. 2002a;14:593–602. doi: 10.1162/08989290260045837. [DOI] [PubMed] [Google Scholar]
- van Veen V, Carter CS. The anterior cingulate as a conflict monitor: fMRI and ERP studies. Physiol Behav. 2002b;77:477–482. doi: 10.1016/S0031-9384(02)00930-7. [DOI] [PubMed] [Google Scholar]
- Weissman DH, Roberts KC, Visscher KM, Woldorff MG. The neural bases of momentary lapses in attention. Nat Neurosci. 2006;9:971–978. doi: 10.1038/nn1727. [DOI] [PubMed] [Google Scholar]
- Wessel JR. Error awareness and the error-related negativity: evaluating the first decade of evidence. Front Hum Neurosci. 2012;6:88. doi: 10.3389/fnhum.2012.00088. [DOI] [PMC free article] [PubMed] [Google Scholar]
- Wessel JR, Danielmeier C, Ullsperger M. Error awareness revisited: accumulation of multimodal evidence from central and autonomic nervous systems. J Cogn Neurosci. 2011;23:3021–3036. doi: 10.1162/jocn.2011.21635. [DOI] [PubMed] [Google Scholar]