

Abstract
Spinal cord injury (SCI) frequently causes severe, persistent central neuropathic pain that responds poorly to conventional pain treatments. Brain-derived neurotrophic factor (BDNF) signaling appears to contribute to central sensitization and nocifensive behaviors in certain animal models of chronic pain through effects mediated in part by the alternatively spliced truncated isoform of the BDNF receptor tropomyosin-related kinase B.T1 (trkB.T1). Mechanisms linking trkB.T1 to SCI-induced chronic central pain are unknown. Here, we examined the role of trkB.T1 in central neuropathic pain after spinal cord contusion. Genetic deletion of trkB.T1 in mice significantly reduced post-SCI mechanical hyperesthesia, locomotor dysfunction, lesion volumes, and white matter loss. Whole genome analysis, confirmed at the protein level, revealed that cell cycle genes were upregulated in trkB.T1+/+ but not trkB.T1−/− spinal cord after SCI. TGFβ-induced reactive astrocytes from WT mice showed increased cell cycle protein expression that was significantly reduced in astrocytes from trkB.T1−/− mice that express neither full-length trkB nor trkB.T1. Administration of CR8, which selectively inhibits cyclin-dependent kinases, reduced hyperesthesia, locomotor deficits, and dorsal horn (SDH) glial changes after SCI, similar to trkB.T1 deletion, without altering trkB.T1 protein expression. In trkB.T1−/− mice, CR8 had no effect. These data indicate that trkB.T1 contributes to the pathobiology of SCI and SCI pain through modulation of cell cycle pathways and suggest new therapeutic targets.
Introduction
Spinal cord injury (SCI) causes debilitating motor and sensory deficits. As many as 80% of patients suffer from chronic, often severe pain (SCI pain) that responds poorly to conventional treatment (Modirian et al., 2010). SCI pain has neuropathic features that suggest neuroplasticity changes and central sensitization (Ji et al., 2003). Identifying better interventions to manage SCI pain requires improved understanding of physiological mechanisms underlying such maladaptive sensory plasticity after injury.
Noxious stimulation increases expression and release of brain-derived neurotrophic factor (BDNF) in the spinal dorsal horn (SDH; Michael et al., 1997; Ha et al., 2001; Pezet et al., 2002; Coull et al., 2005), which modulates pain processing (Thompson et al., 1999; Merighi et al., 2008). BDNF binds to the tropomyosin-related kinase B (trkB) receptor to activate downstream signaling pathways (Pezet et al., 2002) that lead to the development of windup, central sensitization (Guo et al., 2002; Kovács et al., 2004), and a shift from high to low threshold of activation in SDH neurons (Latremoliere and Woolf, 2009). Although BDNF-trkB signaling is required for the induction and maintenance of neuropathic pain induced by peripheral nerve injury (Yajima et al., 2002; Ramer et al., 2007; Wang et al., 2009), no studies have specifically examined its role in the development or maintenance of chronic pain after SCI.
TrkB is expressed as a full-length, catalytically active isoform (trkB.FL), as well as several alternatively spliced truncated isoforms, including trkB.T1 (Middlemas et al., 1991), which is the predominant isoform expressed in the adult mammalian nervous system (Klein et al., 1993). The extracellular domains of trkB.FL and trkB.T1 are identical and bind BDNF with equally high affinity (Middlemas et al., 1991; Pezet et al., 2002). However, the intracellular domain of trkB.T1 is only 11 aa and lacks the kinase activation domain necessary to activate classical signal transduction pathways. Several studies have suggested that trkB.T1, a receptor lacking intrinsic kinase activity, may have signaling distinct from trkB.FL (Dorsey et al., 2002; Rose et al., 2003; Dorsey et al., 2006; Carim-Todd et al., 2009), but few downstream targets have been identified and little is known about its potential signaling capabilities in vivo. After SCI, trkB.T1 is upregulated throughout the white matter (WM; King et al., 2000) and in astrocytes and ependymal cells (Liebl et al., 2001), but little is known about the effects of excess trkB.T1 on post-SCI pain and locomotor recovery.
Because trkB.T1 protein is upregulated in the SDH after noxious stimulation and genetic deletion of trkB.T1 attenuates hindpaw-inflammation-induced thermal hyperalgesia and systemic antiretroviral-mediated mechanical hyperesthesia (Renn et al., 2009), we investigated whether trkB.T1 upregulation contributes to SCI pain by evaluating the effects of in vivo deletion of the trkB.T1 gene on the development of hyperpathia after contusion SCI in mice. We demonstrate that mechanical hyperesthesia and posttraumatic upregulation of cell cycle pathways are reduced in trkB.T1−/− mice after SCI, with cell cycle activation regulated by trkB.T1 both in vivo and in vitro, and that treatment with a selective cyclin-dependent kinase inhibitor simulates the effects of trkB.T1 knock-out (KO).
Materials and Methods
Mice.
All experiments were conducted using adult male C57BL/6J mice (20–30 g; The Jackson Laboratory) or adult male trkB.T1 homozygous-null (trkB.T1−/−) and WT (trkB.T1+/+) mice (20–30 g; breeding pairs were homozygous-null or WT for the trkB.T1 gene back-crossed on the C57BL/6J background to generation N20; mice used in this study were N20F2). The trkB.T1 mice were genotyped by PCR using tail DNA obtained at the time of weaning (postnatal day 21 [P21]). All mice were housed on a 12:12 h light/dark cycle with food and water available ad libitum. The International Association for the Study of Pain guidelines for investigations of pain in animals were followed. The institutional animal care and use committee of the University of Maryland School of Medicine approved these experiments. Throughout the duration of the study, the mice were visually examined daily for evidence of debilitation due to the SCI, which is indicated by changes in their appearance (disheveled hair, weight loss, and dehydration), behavior (decreased grooming, eating and drinking) and activity (decreased exploring and nesting). On each experimental day, the mice were weighed to detect changes in food and water consumption. Any mouse that demonstrated signs of debilitation or weight loss was killed. No mice were prematurely killed in this study. All mice were killed at the completion of experiments.
Drugs.
A potent, selective cyclin-dependent kinase (CDK) inhibitor CR8 (a second-generation roscovitine analog) was used for the inhibition of cell cycle pathway. (R)-CR8 (#3605; Tocris Bioscience) was reconstituted in 0.9% saline to a concentration of 1 mm and administered by intrathecal injection (5 μl). The vehicle control was 0.9% saline administered by intrathecal injection (5 μl). The dose of CR8 was based upon prior investigations of other CDK inhibitors in SCI models from our laboratory (Byrnes et al., 2007; Wu et al., 2012a, 2012c), including direct in vitro comparisons. Both anti-apoptotic concentrations of CR8 in cultured cortical neurons and on microglial proliferation and activation in response to LPS in cultured primary microglia were similar to those of flavopiridol, for which we have systemic administration data.
SCI contusion and locomotion testing.
Mice were anesthetized with isoflurane and a laminectomy was performed at T9 to remove the part of the vertebra overlying the spinal cord, exposing a circle of dura. The spinal column was stabilized via the lateral processes using clamps at T8 and T10. A moderate contusion injury was produced using the Infinite Horizon (Precision Systems and Instrumentation) spinal cord impactor with a force of 60 kdyn (Nishi et al., 2007; Whittaker et al., 2012). For sham control animals, laminectomy was performed without trauma. After SCI, mice were kept on highly absorbent bedding and their bladders manually expressed twice daily until a reflex bladder was established (7–14 d after SCI). Mice were tested for hindlimb function in open-field locomotion on day 1 after injury and weekly thereafter for up to 8 weeks using the Basso mouse scale (BMS) for locomotion (Basso et al., 2006).
Western blot analysis.
Mouse spinal cord tissue centered on the injury site or SDH at lumbar enlargement (L4–L5) by microdissection was obtained at 1 d, 3 d, or 8 weeks after injury, with n = 4–8 mice per time point plus n = 4 laminectomy controls. Five-millimeter segments of spinal cord tissue representing the injury epicenter were frozen and then processed for Western analysis (Jakovcevski et al., 2007). Primary antibodies included: polyclonal rabbit anti-trkB.T1 and full-length (Santa Cruz Biotechnology); CDK1 (cdc2; Neomarkers); cyclin E and mouse anti-E2F1 (BD PharMingen); CDK4, proliferating cell nuclear antigen (PCNA), and E2F5 (Santa Cruz Biotechnology); and GFAP, neuron-glial antigen 2 (NG2), close homolog of L1 (CHL1), and monoclonal mouse anti-GAPDH (Millipore).
Nocifensive testing.
For all behavioral tests, the observer was blinded to the strain, genotype, and treatment condition of the mice. The nocifensive behavior of paw withdrawal from a mechanical stimulus was used to assess the development of mechanical hyperesthesia. The mice were placed in individual Plexiglas cubicles (8.5 cm L × 4 cm H × 4 cm W) on a wire mesh platform and allowed to acclimate for ∼1 h, during which time exploratory and grooming activity ended. A series of von Frey filaments (Touch Test Sensory Evaluator Kit; www.myNeurolab.com) with bending forces that ranged from 0.04 to 2.00 g was used to deliver the mechanical stimuli. The von Frey filaments are calibrated semiannually using an analytical balance with resolution to 0.0001 g (AB54; Mettler Toledo). Each filament was applied perpendicular to the plantar surface of the right hindpaw until the filament just bent and was held in place for 5 s or until a paw withdrawal occurred. This was repeated for 5 trials for each filament and the number of withdrawals of 5 was recorded. A positive stimulus response was defined as a brisk withdrawal with or without shaking or licking of the hindpaw during or immediately upon removal of the filament application. The stimuli were applied, starting with the 0.4 g filament. If the 0.4 g filament elicited 3 positive responses of 5 trials, then the mouse was tested moving downward through the series to the 0.04 g filament and the number of withdrawals was recorded for each filament. If the 0.4 g filament did not elicit 3 positive responses, then the mouse was tested moving upward through the series to the 2.0 g filament and the number of withdrawals was recorded for each filament (Ren, 1999). One trial was completed on all of the mice before the subsequent trial was started. The average interstimulus interval was 2–3 min. Threshold was defined as the filament with the lowest bending force that elicited at least 3 positive responses of 5 trials (Ren, 1999).
Tissue processing and histopathology.
Mice were perfused with 4% buffered paraformaldehyde at 1 d (n = 8) or 8 weeks (n = 8) after injury. The dissected spinal cords were postfixed for 2 h and cryoprotected through a sucrose gradient. After the spinal cords were embedded in OCT and frozen, 20-μm-thick coronal sections were cut and placed serially on set of 10 slides. A representative slide from each set was stained with eriochrome cyanine (ECRC) to determine the location of the injury epicenter with the least amount of spared WM (Wu et al., 2012b). Residual WM area was calculated at the injury epicenter as well as at points rostral and caudal to the epicenter by quantifying the total area stained by ECRC. Images were taken at 2.5× magnification and analyzed using NIH ImageJ software. The threshold level of each 8-bit image was set to display only ECRC-positive pixels, and total ECRC-positive area was calculated for each section. Lesion volume was assessed using Stereologer 2000 software (Systems Planning and Analysis). Sections spaced 1 mm apart from 5 mm caudal to 5 mm rostral to the injury epicenter were stained with GFAP and DAB as the chromogen for lesion volume assessment based on the Cavalieri method of unbiased stereology with a grid spacing of 200 μm (Wu et al., 2012a).
Intrathecal injection.
Using a method adapted from Hylden and Wilcox (1980), direct percutaneous intrathecal injections were made by lumbar puncture in isoflurane-anesthetized (AErrane; Baxter) mice. The mice were first placed in an anesthesia induction chamber with 3% isoflurane carried in medical air and then transferred to a nose cone with anesthesia maintained at 1.5–2% during the procedure. The pelvis was stabilized and the space between the L5 and L6 spinous processes was identified. A 1/2 inch 30 g needle attached to a 25 μl Hamilton syringe was percutaneously inserted, bevel up, into the groove between the spinous and transverse processes of the L5 and L6 vertebrae at a 20° angle in the rostral direction. Entry into the intrathecal space was determined by visualizing a quick tail flick during needle penetration, at which point the needle angle was decreased to 10°. After the injection, the mice recovered from anesthesia under a warming lamp and were observed for signs of spinal trauma (hindlimb weakness, unsteady gait, dragging a hindpaw) beyond what is present due to the experimental SCI. Any mice with signs of spinal trauma were killed immediately. No mice were prematurely killed during the course of this study.
Microarray processing and analysis.
Our prior extensive studies of gene expression profiling after rodent SCI, including effects at multiple segments and projection sites, demonstrated that expression changes for both inflammatory factors and cell cycle adjacent to the injury site best reflect outcomes (Di Giovanni et al., 2003; De Biase et al., 2005). Five millimeter segments of spinal cord tissue centered on the injury site from n = 4 or 5 mice per condition per time point were isolated, frozen, and the RNA extracted using standard TRIzol methods. The quality and quantity of RNA was assessed via spectrophotometer (Nanodrop 1000; Thermo Scientific) and also via RNA Integrity Number using the Agilent Technologies Bioanalyzer. Double-stranded cDNA was prepared from total RNA (1 μg) and used as the template for in vitro transcription to prepare biotinylated cRNA. The biotinylated target was fragmented and hybridized to the probes contained on the expression arrays for 16 h. Affymetrix Gene Chip Mouse 430 Plus 2.0 arrays were used, enabling the examination of 45,000+ probe sets across the transcriptome. After hybridization, the arrays were washed and stained in the Affymetrix fluidics station and scanned in a 3000 7G scanner. The data (as “.cel” files) were normalized using GC Robust Multiarray Average background adjustment and statistically analyzed using a linear model for microarray provided in the Limma R software package (Bioconductor Software). To correct for error inflation due to multiple statistical testing, the p-value was adjusted using the false discovery rate (FDR) correction. The FDR p-value used for significance was 0.10. Pathway analysis was conducted using Ingenuity Pathway Analysis (Ingenuity Systems). Microarray data have been deposited in National Center for Biotechnology Information Gene Expression Omnibus database under accession number GSE47681.
Astrocyte culture.
Primary astrocytes were cultured from the cerebral cortices of 0- to 2-d-old mice as described previously (Wu et al., 2010). In brief, cerebra were dissected, chopped, triturated, and plated on tissue culture flasks that had been coated with PDL (50 ng/ml). The cells were grown in DMEM/F12 (Invitrogen) supplemented with 10% FBS (Invitrogen) and 1% Pen/Strep at 37°C with 5% CO2. When the cells had grown to confluence, the flasks were shaken at 200 rpm for several days to remove microglia and oligodendroglia. Next, the adherent astrocytes were subcultured in multi-well plates or dishes. When cells had reached subconfluence, the culture medium was replaced with serum-free DMEM/F12 overnight before treatments.
Immunohistochemistry and quantitative image analysis.
Immunohistochemistry was performed on lumbar segment-1 spinal cord sections. Standard fluorescent immunocytochemistry on serial, 20-μm-thick sections was performed as described previously (Wu et al., 2012b). The following primary antibodies were used: rat anti-ED1 (1:200; AbD Serotec), rabbit anti-Iba-1 (1:1000; Wako Chemicals), mouse anti-GFAP (1:1000; Sigma), rabbit anti-CDK4 (1:100), and PCNA (1:100; Santa Cruz Biotechnology). Fluorescent-conjugated secondary antibodies (Alexa Fluor 488-conjugated goat anti-rabbit, 1:400; Invitrogen) were incubated with tissue sections for 1 h at room temperature. Cell nuclei were labeled with bis-benzimide solution (Hoechst 33258 dye, 5 μg/ml in PBS; Sigma). Finally, slides were washed and mounted with an anti-fading medium (Invitrogen). All immunohistological staining experiments were performed with the appropriate positive control tissue and primary/secondary-only negative controls. Images were captured at 60× using a Leica TCS SP5 II Tunable Spectral Confocal microscope and processed using Adobe Photoshop version 7.0 software by a blinded observer. The number of positively labeled cells was determined for each animal by an average of 4 fields of view per region (2 sections on both the left and right sides) at a predefined area of superficial lumbar SDH (Hains and Waxman, 2006; Wu et al., 2011b; Whittaker et al., 2012), with n = 6–7 mice per SCI group and n = 4 for the sham group as the sample size for statistical analysis.
Statistical analysis.
The mechanical threshold data were analyzed using the Mann–Whitney U test to identify differences between two groups (Ren, 1999). The stimulus-response data for the paw withdrawals are presented as the mean ± SEM and were analyzed by t tests (for two groups) or by ANOVA with the least significant difference post hoc test (for four groups). All of the other data are presented as the mean ± SEM and were analyzed for significant differences between groups by t tests. In all cases, p < 0.05 was considered significant.
Results
TrkB.T1 expression is upregulated after SCI
A moderate, incomplete SCI was produced using a well characterized mouse contusion model and the effect of SCI on the expression of trkB.T1 was examined. Five millimeters of spinal cord tissue centered on the epicenter (Fig. 1A) or equivalent tissue from the laminectomy control was processed for Western blot analysis (Fig. 1B,C). A significant increase of trkB.T1 expression was found in trkB.T1+/+ mice (n = 4) at 24 h after SCI compared with the naive controls (n = 4; Fig. 1B,D; p < 0.05). TrkB.FL expression remained unchanged at 24 h compared with controls in both the trkB.T1+/+ and trkB.T1−/− mice (Fig. 1E; n = 4 each), indicating that the truncated isoform of trkB is selectively altered in the spinal cord at this early time point. The expression of trkB.T1 remained elevated at 3 d after injury (179 ± 6.8% of control, n = 4) and was 1.7-fold higher than the baseline level at 8 weeks after injury (n = 8; Fig. 1C,D; p < 0.05). Further, expression of trkB.T1 was examined in the samples from SDH at lumbar enlargement (L4–L5) by microdissection. We found that trkB.T1 expression in trkB.T1+/+ mice was significantly upregulated at 24 h after thoracic injury and remained elevated at 3 d (Fig. 1F,G), similar to the results observed in the injury area.
Figure 1.

The trkB.T1 protein is significantly upregulated at the thoracic injured area and lumbar spinal cord horn after SCI. A, Schematic drawing of the area of injury and region of tissue harvested. A moderate contusion injury was produced using a spinal cord impactor with a force of 60 kdyn. Five millimeters of spinal cord tissue centered on the epicenter or equivalent tissue from a laminectomy control was processed for Western blot and microarray analysis. B–C, Representative Western blot showing trkB.FL and trkB.T1 in the intact spinal cord (control), at 1 d and 8 weeks after SCI (D1 and WK8 SCI) in trkB.T1+/+ and trkB.T1−/− mice. D–E, In the trkB.T1+/+ mice, trkB.T1 protein expression was significantly upregulated 1 d after SCI (n = 4) compared with control (n = 4). The upregulation was sustained at week 8 (n = 8 per group, p < 0.05 SCI vs control, two-tailed Student's t test). There was no difference in the expression of the trkB.FL protein at 1 d after SCI or at week 8 after SCI compared with control (n = 4 per group). F, Representative Western blot showing trkB.T1 expression at the lumbar SDH in the intact spinal cord (control) at 1 and 3 d after SCI (D1 and D3 SCI) in trkB.T1+/+ and trkB.T1−/− mice. G, TrkB.T1 expression in TrkB.T1+/+ mice was significantly upregulated at 24 h after thoracic injury (p < 0.05, D1 SCI vs control) and remained elevated at 3 d (n = 4 mice per group). Data are expressed as mean ± SEM.
Elimination of trkB.T1 relieves hyperesthesia and improves function after SCI
We addressed whether changes in trkB.T1 regulation are associated with nocifensive responses or locomotor recovery after SCI. Mice were assessed weekly for locomotor function and mechanical hyperesthesia. Locomotor function was assessed using the BMS, which ranges from 0 (total paralysis) to 9 (normal function). One day after SCI, all mice had a BMS score of 0 or 1, indicating nearly complete loss of motor function. By day 14, the trkB.T1−/− mice showed significantly higher BMS scores than the trkB.T1+/+ mice (Fig. 2A; p < 0.05), which persisted through 42 d. Therefore, mice lacking trkB.T1 have better functional recovery after SCI than the trkB.T1+/+ mice.
Figure 2.
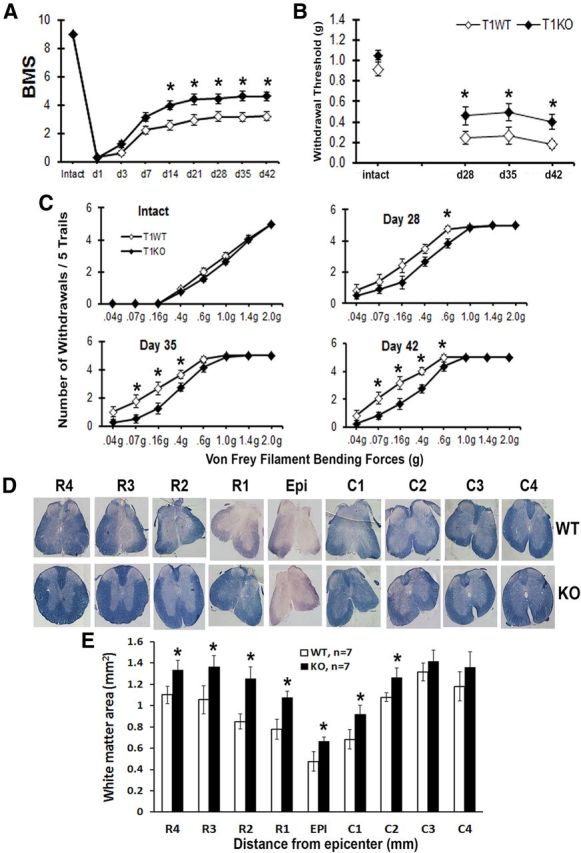
Gene deletion of trkB.T1 results in improved locomotor functional recovery and decreased mechanical hyperesthesia after SCI. A, BMS scores in trkB.T1−/− mice (♦; n = 15) were significantly higher than in trkB.T1+/+ mice (◊; n = 15) starting at day 14 after SCI (p < 0.05, two-way ANOVA with repeated measures). B, TrkB.T1−/− mice (♦; n = 12) had significantly less post-SCI mechanical hyperesthesia than trkB.T1+/+ mice (◊; n = 12, p < 0.05, Mann–Whitney U test). C, Hindpaw mechanical withdrawal stimulus-response curves in intact naive mice and after SCI demonstrate that, after injury, the trkB.T1+/+ mice (◊; n = 12) withdrew their paws from the mechanical stimuli more frequently than the trkB.T1−/− mice (♦; n = 12, p < 0.05, one-tailed Student's t test). D, A series of representative ECRC-stained tissue sections from trkB.T1+/+ and trkB.T1−/− mice at the epicenter (Epi) and rostral (R1–R4) and caudal (C1–C4) to the injury. ECRC stains myelinated areas of spared WM. E, Quantification of the total WM area (mm2) in stained tissue sections showed a significant increase in the WM area of trkB.T1−/− mice (n = 7) compared with trkB.T1+/+ (n = 7, p < 0.05, one-tailed Student's t test vs trkB.T1+/+ mice). Data are expressed as mean ± SEM.
By 4 weeks of SCI, mice regained adequate locomotor function to be able to withdraw a hindpaw from a stimulus and undergo nocifensive behavioral testing. The nocifensive testing for the development of mechanical hyperesthesia was done by applying a series of von Frey filaments (0.04–2.0 g bending forces) to the plantar surface of the right hindpaw. Threshold was defined as the gram force of the smallest filament to elicit at least three paw withdrawals of five trials. There was no difference in mechanical threshold between the genotypes before the SCI. On day 28 after SCI, the trkB.T1−/− mice had a significantly higher mechanical threshold than the trkB.T1+/+ mice, indicating less mechanical hyperesthesia, and these differences persisted to day 42 (Fig. 2B; p < 0.05). There was also a left shift in the stimulus response curves of both genotypes on days 28, 35, and 42, which indicated an increase in the number of withdrawals from each filament. The number of withdrawals by the trkB.T1+/+ mice was significantly higher than for the trkB.T1−/− mice (Fig. 2C; p < 0.05).
We then addressed whether the observed behavioral improvements related to the amount of spared WM. Spinal cord sections from injured mice perfused at 8 weeks after SCI were stained with ECRC and the WM area was quantified at 1 mm intervals rostral (R) and caudal (C) to the injury epicenter (EPI). We did not see any difference in the WM area between intact KO and WT mice. For WT mice: WM area (mm2), n = 3: 1.88 ± 0.25 (R4), 1.81 ± 0.16 (R3), 1.82 ± 0.25 (R2), 1.74 ± 0.19 (R1), 1.79 ± 0.08 (EPI), 1.85 ± 0.21 (C1), 1.92 ± 0.09 (C2), 2.00 ± 0.19 (C3), 1.98 ± 0.03 (C4). For KO mice: WM area (mm2), n = 3: 1.84 ± 0.30 (R4), 1.89 ± 0.08 (R3), 1.84 ± 0.10 (R2), 1.89 ± 0.20 (R1), 1.73 ± 0.17 (EPI), 1.93 ± 0.01 (C1), 2.02 ± 0.08 (C2), 2.12 ± 0.07 (C3), 2.06 ± 0.04 (C4). The trkB.T1+/+ mice at the lesion epicenter lost ∼73% of the WM area compared with intact trkB.T1+/+ mice (8 weeks injured trkB.T1+/+ mice: 0.48 ± 0.09 mm2; intact trkB.T1+/+ mice: 1.79 ± 0.08 mm2). Animals with trkB.T1 gene deletion showed significant WM sparing at the epicenter, as well as 1–2 mm rostral and caudal to the epicenter (Fig. 2E; p < 0.05). Representative ECRC-stained sections illustrate the differences in myelinated WM area between the trkB.T1+/+ mice and the trkB.T1−/− mice (Fig. 2D). These data indicate that genetic deletion of trkB.T1 improves the recovery of locomotor function and reduces the degree of hyperesthesia after SCI, which is associated with loss of WM.
TrkB.T1 deletion reduces secondary injury after SCI
We further evaluated the role of trkB.T1 upregulation in SCI by studying secondary tissue changes that include lesion volume, chronic inflammation, and glial scar formation. SCI-induced lesion volume/cavity formation was measured with GFAP/DAB staining at 8 weeks after SCI and analyzed by stereological techniques. Histological assessment showed that tissue collected from the trkB.T1+/+ mice contained a larger lesion cavity (0.62 ± 0.093 mm3, n = 8) than that from the trkB.T1−/− mice (0.41 ± 0.060 mm3, n = 8, Fig. 3B; p < 0.05). This lesion volume reduction in the trkB.T1−/− mice occurred in both WM and gray matter, with an overall decrease in cavity formation and tissue loss (Fig. 3A).
Figure 3.

TrkB.T1 KO reduces secondary injury after SCI. A, Representative histologically stained tissue sections 1 mm rostral to the epicenter from a sham trkB.T1+/+ mouse and from injured trkB.T1+/+ and trkB.T1−/− mice. The SCI lesion is the region with less GFAP/DAB staining than surrounding tissue. B, The lesion volumes of trkB.T1−/− mice (n = 8) were significantly smaller than in trkB.T1+/+ mice (n = 8) at 8 weeks after SCI (*p < 0.05, one-tailed Student's t test). C–D, Western blot analysis showed that gene deletion of trkB.T1 (n = 8) significantly reduced the SCI-induced upregulation of Iba-1 protein at 8 weeks after injury compared with trkB.T1+/+ mice (n = 8). Five-millimeter segments of spinal cord tissue representing the injury epicenter were collected for Western blot analysis. Representative immunoblots are shown in C. E–F, Western blot analysis showed that deleting trkB.T1 (n = 8) significantly reduced SCI-induced upregulation of GFAP, CHL1, and NG2 at 8 weeks after injury compared with trkB.T1+/+ mice (n = 8). Five-millimeter segments of spinal cord tissue representing the injury epicenter were collected for Western blot analysis. Representative immunoblots are shown in E. The data in D, F were analyzed by one-way ANOVA with post hoc analysis using Student–Newman–Keuls test. *p < 0.05, WT SCI versus WT control; #p < 0.05, KO SCI versus WT SCI. Data are expressed as mean ± SEM.
Western blotting was performed for the activated microglia marker Iba-1 after SCI. Very low levels of Iba-1 expression were found in uninjured controls from both the trkB.T1+/+ mice and the the trkB.T1−/− mice (Fig. 3C), but 8 weeks after SCI, Iba-1 protein expression showed a 5- to 6-fold increase in injured spinal cord extracts from the trkB.T1+/+ mice compared with sham tissue (Fig. 3D). Spinal cords from trkB.T1−/− mice had significantly less upregulation of Iba-1 protein expression compared with WT mice (Fig. 3D; p < 0.05). GFAP is an indicator of astrocyte reactivity and increased GFAP expression is associated with glial scar formation and secondary damage after SCI (Bush et al., 1999; Faulkner et al., 2004). Western blot analysis showed a significant reduction of GFAP protein expression at 8 weeks after injury in the trkB.T1−/− mice compared with WT mice (Fig. 3E,F; p < 0.05). The NG2 proteoglycan and the Ig superfamily adhesion molecule CHL1 are highly expressed by hypertrophic astrocytes in the glial scar, restricting posttraumatic axonal growth (Jakovcevski et al., 2007; Wu et al., 2011b). We found that NG2 glycoprotein and CHL1 levels in spinal cord tissue were robustly increased at 8 weeks after SCI in WT mice (Fig. 3E). Deletion of trkB.T1 significantly attenuated the expression of both NG2 glycoprotein and CHL1 (p < 0.05, vs the trkB.T1+/+ mice, Fig. 3E,F). These results indicate that there is less microglial activation and glial scar formation after SCI in mice with a trkB.T1 gene deletion.
Activated microglia and reactive astrocytes also contribute to the development and maintenance phases of chronic below-level pain after SCI (Hains and Waxman, 2006; Detloff et al., 2008). To determine whether the observed attenuation of below-level mechanical hyperesthesia in trkB.T1−/− mice may be related to the reduced activation of spinal microglia and astrocytes, the samples from SDH at lumbar enlargement (L4–L5) by microdissection were harvested for Western blot analysis to examine gliopathy. There was no difference in the expression levels for GFAP and Iba-1 between genotypes in the uninjured control state. However, GFAP and Iba-1 protein expression were elevated at 1 d after injury in the trkB.T1+/+ mice and were significantly higher at day 3 in the trkB.T1+/+ mice thanin the trkB.T1−/− mice (Fig. 4A–C). Moreover, spinal cord lumbar sections from injured mice perfused at 7 d or 8 weeks after SCI were stained with GFAP and ED1/Iba-1. Activated microglia and astrocytes within the superficial SDH were then quantified. Few ED1-positive reactive microglia were seen in uninjured controls from both the trkB.T1+/+ or trkB.T1−/− mice (Fig. 4D). Eight weeks after SCI, the number of ED1+/Iba-1+ cells was significantly increased in injured trkB.T1+/+ and trkB.T1−/− mice compared with sham tissue and there were significantly fewer positively stained cells in trkB.T1−/− mice compared with WT (Fig. 4E; p < 0.05). GFAP-positive cells with a swollen hypertrophic appearance were significantly increased at 7 d after injury in both trkB.T1+/+ and trkB.T1−/− mice, consistent with other results (Gwak et al., 2012). Deleting trkB.T1 resulted in a significantly reduced number of reactive astrocytes (Fig. 4F; p < 0.05). Therefore, decreasing reactive astrocytes and microglia (“gliopathy”) in the lumbar SDH in mice with a trkB.T1 gene deletion is associated with the decreased below-level mechanical hyperesthesia in these mice.
Figure 4.
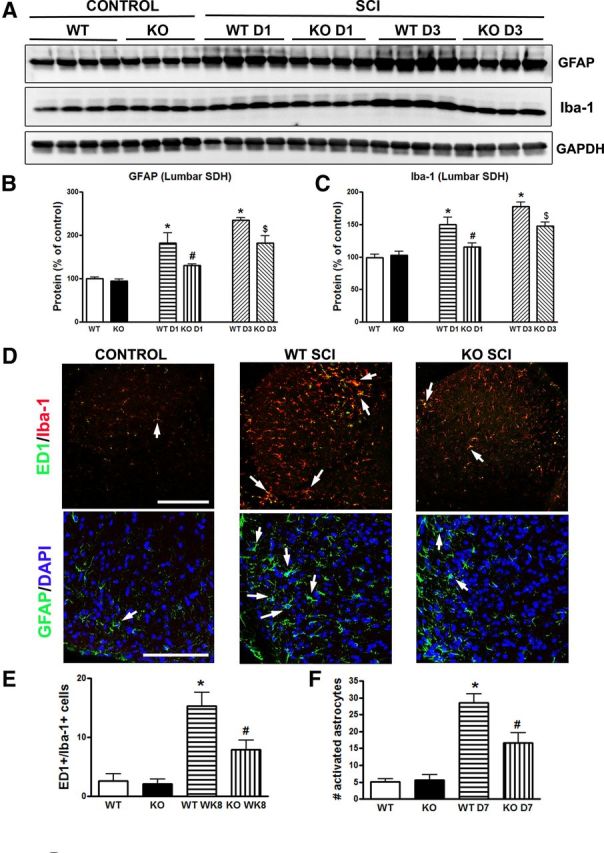
TrkB.T1 KO results in decreased gliopathy at the lumbar SDH after SCI. A–C, Western blot analysis showed that GFAP and Iba-1 protein expression at the lumbar SDH were elevated at 1 d after injury in the trkB.T1+/+ mice and were significantly higher at day 3 in the trkB.T1+/+ mice than that in the trkB.T1−/− mice. There was no difference in the expression levels for GFAP and Iba-1 between genotypes in the uninjured control state. n = 4 mice per group; *p < 0.05, WT D1/D3 SCI versus WT control; #p < 0.05, KO D1 SCI versus WT D1 SCI; and $p < 0.05, KO D3 SCI versus WT D3 SCI. D–F, Quantification of ED1+ (green)/Iba-1+ (red) activated microglial cells showed that after SCI, there were significantly more activated microglia in the lumbar SDH of trkB.T1+/+ mice (n = 7) compared with trkB.T1−/− mice (n = 7). The number of GFAP-positive cells (green) with a swollen hypertrophic appearance was significantly increased at 7 d after injury in both trkB.T1+/+ (n = 7) and trkB.T1−/− mice (n = 7). Deleting trkB.T1 significantly reduced the number of reactive astrocytes in the trkB.T1−/− mice compared with WT. Scale bar, 250 μm for top and 100 μm for bottom in D. The data in B, C and E, F were analyzed by one-way ANOVA with post hoc analysis using a Student–Newman–Keuls test. *p < 0.05, WT SCI versus WT control; #p < 0.05, KO SCI versus WT SCI. Data are expressed as mean ± SEM.
Genetic deletion of trkB.T1 alters cell cycle gene regulation after SCI
Because little is known about downstream effectors from trkB.T1 signaling, we conducted a microarray study to examine differential gene expression in the spinal cord of trkB.T1−/− SCI mice compared with trkB.T1+/+ controls. We reasoned that this might provide mechanistic insight into the decreased lesion volume, increased WM sparing, significantly improved locomotor recovery, and reduced pain in the mice lacking trkB.T1. After normalizing the array data using GC Robust Multiarray Average background adjustment, we used a linear model for microarray (Limma R software package; Bioconductor Software) to analyze differential gene expression across the 2 genotypes at baseline (sham) and then at 1, 3, and 7 d after SCI. Using an FDR-corrected p-value of 0.10, we identified 81 probe sets differentially expressed in the trkB.T1−/− spinal cord compared with WT in the sham group, 202 probe sets at day 1, and only 18 and 19 probe sets respectively at days 3 and 7 (Fig. 5A). A heat map was generated to examine differential expression of the probe sets at day 1 (Fig. 5B). Next, we conducted pathway analysis using Ingenuity Pathway Analysis to examine alterations in transcriptional activity at day 1 and to conduct an unbiased examination of significantly regulated canonical signaling pathways in our dataset of 202 significant probes. In this analysis, we addressed the question of which pathways are most closely associated with the differentially regulated genes in our dataset (Table 1). We discovered that there was a significant downregulation of cell cycle pathways in the trkB.T1−/− mice compared with WT controls in the top 10 significantly enriched canonical signaling pathways (Fig. 5C). We next conducted a shared gene analysis to examine the overlap between significantly regulated pathways to ascertain whether the set of molecules that we identified as significantly different in the trkB.T1 KO spinal cord interacted with more than one pathway and demonstrated significant overlap among 25 pathways (Fig. 5D). Of these 25 pathways, the most significant overlap was with six cell cycle pathways. Upregulation of cell cycle genes in the WT spinal cord after SCI is consistent with our prior, extensive genomic analyses of post-SCI gene regulation (Di Giovanni et al., 2003; De Biase et al., 2005).
Figure 5.
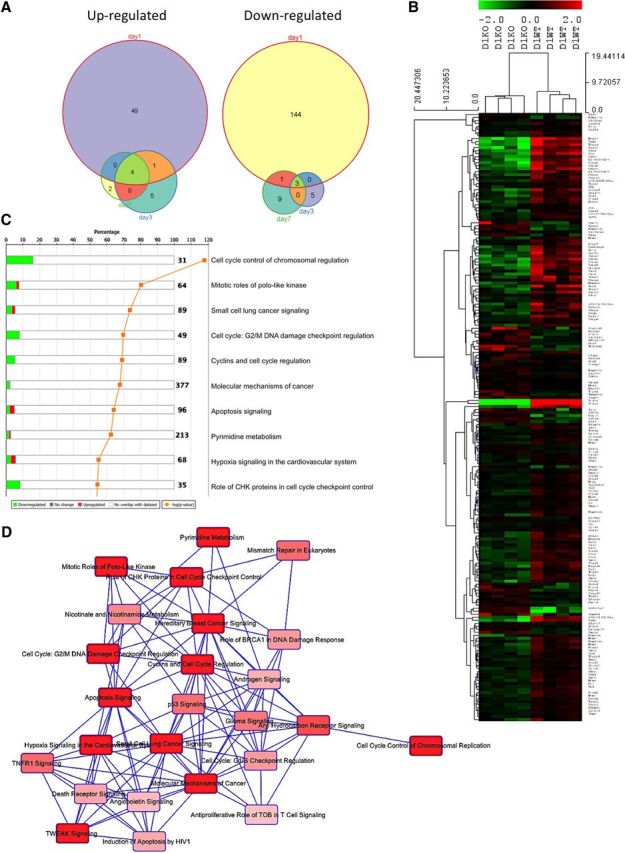
Cell cycle genes are upregulated in the spinal cord of trkB.T1+/+ mice early after SCI but not in trkB.T1-null mice. A, Differential gene expression analysis in the spinal cord over time comparing differentially expressed genes in the trkB.T1−/− mice compared with WT mice demonstrates that the largest number of genes is altered early at day 1 after SCI. The Venn diagrams show each time point (days 1, 3, and 7 after SCI), with the number of differentially expressed genes at each. B, Heat map of genes that cluster by genotype at day 1 in the trkB.T1−/− spinal cord compared with WT. The normalized expression of the summarized probe sets is shown. The histogram key indicates that green genes are downregulated and red genes are upregulated. C, Unbiased pathway analysis demonstrates significant downregulation of cell cycle pathways in trkB.T1−/− spinal cord compared with WT at day 1. The top 10 differentially enriched canonical signaling pathways are shown. Green indicates downregulation and red indicates upregulation. The orange line shows the −log10 p for each pathway. D, Overlapping, shared gene set analysis was performed to determine whether there are shared genes across a number of significantly regulated canonical signaling pathways. Each pathway is displayed as a single node. The darker the red, the more significant the overlapping pathway is in our gene set by the Fisher's exact test p-value. This diagram depicts the top 25 significantly regulated pathways in which our gene set has shared genes across pathways.
Table 1.
Differentially expressed genes in trkB.T1 KO versus WT at 1 d after SCI
| Probe set ID | Gene symbol | Gene name | Entrez ID | Chr | logFC | AveExpr | p-value | FDR |
|---|---|---|---|---|---|---|---|---|
| 1435196_at | Ntrk2 | Neurotrophic tyrosine kinase, receptor, type 2 | 18212 | 13 | −6.310548984 | 6.283996342 | 4.04E-10 | 2.28E-06 |
| 1420838_at | Ntrk2 | Neurotrophic tyrosine kinase, receptor, type 2 | 18212 | 13 | −6.111087346 | 7.430315809 | 6.27E-10 | 3.14E-06 |
| 1426817_at | Mki67 | Antigen identified by monoclonal antibody Ki 67 | 17345 | 7 | −3.524221569 | 7.362224422 | 3.99E-08 | 9.99E-05 |
| 1454694_a_at | Top2a | Topoisomerase (DNA) II alpha | 21973 | 11 | −2.884216275 | 7.007219836 | 6.78E-11 | 1.22E-06 |
| 1448627_s_at | Pbk | PDZ binding kinase | 52033 | 14 | −2.716160403 | 7.021488258 | 2.49E-09 | 1.02E-05 |
| 1448226_at | Rrm2 | Ribonucleotide reductase M2 | 20135 | 12 | −2.597777888 | 7.010958985 | 3.35E-10 | 2.28E-06 |
| 1434437_x_at | Rrm2 | Ribonucleotide reductase M2 | 20135 | 12 | −2.413044131 | 8.510323758 | 3.29E-09 | 1.24E-05 |
| 1424278_a_at | Birc5 | Baculoviral IAP repeat-containing 5 | 11799 | 11 | −2.402215946 | 6.501212468 | 4.95E-09 | 1.72E-05 |
| 1438009_at | −2.354901604 | 10.44514503 | 1.08E-10 | 1.22E-06 | ||||
| 1452242_at | Cep55 | Centrosomal protein 55 | 74107 | 19 | −2.324549301 | 5.951673121 | 1.65E-10 | 1.49E-06 |
| 1417910_at | Ccna2 | Cyclin A2 | 12428 | 3 | −2.299017545 | 6.317339253 | 3.79E-10 | 2.28E-06 |
| 1416802_a_at | Cdca5 | Cell division cycle associated 5 | 67849 | 19 | −2.25450247 | 5.071325741 | 1.04E-10 | 1.22E-06 |
| 1424046_at | Bub1 | Budding uninhibited by benzimidazoles 1 homolog (S. cerevisiae) | 12235 | 2 | −2.227622933 | 4.833076836 | 2.89E-08 | 7.68E-05 |
| 1448314_at | Cdk1 | Cyclin-dependent kinase 1 | 12534 | 10 | −2.19726873 | 6.307649069 | 4.13E-11 | 1.22E-06 |
| 1419153_at | 2810417H13Rik | RIKEN cdna 2810417H13 gene | 68026 | 9 | −2.074215817 | 7.573282138 | 5.82E-08 | 0.000131177 |
| 1436847_s_at | Cdca8 | Cell division cycle associated 8 | 52276 | 4 | −2.009899382 | 6.032914831 | 2.09E-08 | 5.90E-05 |
| 1428481_s_at | Cdca8 | Cell division cycle associated 8 | 52276 | 4 | −1.976062259 | 5.200284503 | 1.02E-08 | 3.30E-05 |
| 1417821_at | D17H6S56E-5 | DNA segment, Chr 17, human D6S56E 5 | 110956 | 17 | −1.950723814 | 5.7321697 | 2.22E-09 | 1.00E-05 |
| 1417911_at | Ccna2 | Cyclin A2 | 12428 | 3 | −1.764308783 | 4.797649583 | 1.05E-07 | 0.000214275 |
| 1424118_a_at | Spc25 | SPC25, NDC80 kinetochore complex component, homolog (S. cerevisiae) | 66442 | 2 | −1.697970249 | 5.60872748 | 4.69E-07 | 0.000729463 |
| 1416299_at | Shcbp1 | Shc SH2-domain binding protein 1 | 20419 | 8 | −1.676308459 | 6.751182549 | 1.32E-07 | 0.00025896 |
| 1452040_a_at | Cdca3 | Cell division cycle associated 3 | 14793 | 6 | −1.648974967 | 5.94876901 | 2.49E-06 | 0.003033223 |
| 1419152_at | 2810417H13Rik | RIKEN cdna 2810417H13 gene | 68026 | 9 | −1.582759678 | 3.998568419 | 6.26E-05 | 0.027960233 |
| 1417019_a_at | Cdc6 | Cell division cycle 6 homolog (S. cerevisiae) | 23834 | 11 | −1.57591995 | 4.26547158 | 9.43E-06 | 0.009050868 |
| 1452954_at | Ube2c | Ubiquitin-conjugating enzyme E2C | 68612 | 2 | −1.565753358 | 5.76772749 | 0.000301765 | 0.077329052 |
| 1416309_at | Nusap1 | Nucleolar and spindle associated protein 1 | 108907 | 2 | −1.536420918 | 5.305367114 | 7.84E-06 | 0.007860968 |
| 1419513_a_at | Ect2 | Ect2 oncogene | 13605 | 3 | −1.480046133 | 5.802155734 | 2.41E-07 | 0.00041802 |
| 1417938_at | Rad51ap1 | RAD51 associated protein 1 | 19362 | 6 | −1.405538953 | 4.623888646 | 3.81E-06 | 0.004290985 |
| 1423775_s_at | Prc1 | Protein regulator of cytokinesis 1 | 233406 | 7 | −1.390411141 | 5.264829948 | 0.000213078 | 0.06673636 |
| 1415810_at | Uhrf1 | Ubiquitin-like, containing PHD and RING finger domains, 1 | 18140 | 17 | −1.338229755 | 5.971743604 | 0.000205735 | 0.066277423 |
| 1439260_a_at | Enpp3 | Ectonucleotide pyrophosphatase/phosphodiesterase 3 | 209558 | 10 | −1.323071458 | 5.161679137 | 0.000111763 | 0.042717156 |
| 1423774_a_at | Prc1 | Protein regulator of cytokinesis 1 | 233406 | 7 | −1.317941862 | 5.185417817 | 4.08E-05 | 0.022467357 |
| 1418264_at | Cenpk | Centromere protein K | 60411 | 13 | −1.263246556 | 5.540393037 | 7.84E-06 | 0.007860968 |
| 1422430_at | Fignl1 | Fidgetin-like 1 | 60530 | 11 | −1.255234814 | 6.344925562 | 0.000333539 | 0.083110081 |
| 1436723_at | Cenpi | Centromere protein I | 102920 | X | −1.189208966 | 3.82424006 | 1.06E-05 | 0.0092458 |
| 1429499_at | Fbxo5 | F-box protein 5 | 67141 | 10 | −1.1853163 | 6.447051807 | 3.92E-05 | 0.02232997 |
| 1422535_at | Ccne2 | Cyclin E2 | 12448 | 4 | −1.171113511 | 6.971543851 | 4.20E-07 | 0.000676388 |
| 1452881_at | Gins2 | GINS complex subunit 2 (Psf2 homolog) | 272551 | 8 | −1.16739969 | 3.938680054 | 0.000263239 | 0.072392332 |
| 1417822_at | D17H6S56E-5 | DNA segment, Chr 17, human D6S56E 5 | 110956 | 17 | −1.162085782 | 5.963118686 | 3.78E-05 | 0.021849726 |
| 1455990_at | Kif23 | Kinesin family member 23 | 71819 | 9 | −1.133418604 | 4.171841101 | 8.20E-05 | 0.03454806 |
| 1417777_at | Ptgr1 | Prostaglandin reductase 1 | 67103 | 4 | −1.105405878 | 6.943139899 | 5.15E-05 | 0.026090601 |
| 1424156_at | Rbl1 | Retinoblastoma-like 1 (p107) | 19650 | 2 | −1.10458618 | 6.155772903 | 3.72E-05 | 0.021809078 |
| 1459401_at | −1.088747387 | 3.045176972 | 2.10E-05 | 0.013958609 | ||||
| 1417541_at | Hells | Helicase, lymphoid specific | 15201 | 19 | −1.067654825 | 6.879010181 | 1.93E-05 | 0.013394345 |
| 1453152_at | Mamdc2 | MAM domain containing 2 | 71738 | 19 | −1.056757423 | 5.224573346 | 5.69E-05 | 0.027027604 |
| 1448441_at | Cks1b | CDC28 protein kinase 1b | 54124 | 3 | −1.036997965 | 6.318610164 | 0.00021997 | 0.067098594 |
| 1439695_a_at | Kif20b | Kinesin family member 20B | 240641 | 19 | −1.006991525 | 4.429442051 | 0.000273481 | 0.074302888 |
| 1436808_x_at | Mcm5 | Minichromosome maintenance deficient 5, cell division cycle 46 (S. cerevisiae) | 17218 | 8 | −1.005425316 | 8.380764994 | 0.000103015 | 0.040400609 |
| 1429658_a_at | Smc2 | Structural maintenance of chromosomes 2 | 14211 | 4 | −1.005286029 | 6.983293269 | 5.87E-06 | 0.006306238 |
| 1422460_at | Mad2l1 | MAD2 mitotic arrest deficient-like 1 (yeast) | 56150 | 6 | −0.999626502 | 7.697761259 | 3.16E-07 | 0.000528013 |
| 1456111_at | Fam55d | Family with sequence similarity 55, member D | 244853 | 9 | −0.988116342 | 8.738952078 | 0.000203043 | 0.065880755 |
| 1435089_at | 2010111I01Rik | RIKEN cdna 2010111I01 gene | 72061 | 13 | −0.958243159 | 4.790548699 | 7.11E-07 | 0.001002225 |
| 1452583_s_at | Galm | Galactose mutarotase | 319625 | 17 | −0.949792205 | 4.160765615 | 0.000248664 | 0.069658474 |
| AFFX-ThrX-M_at | −0.942616139 | 7.729716391 | 0.000122543 | 0.046443984 | ||||
| 1450842_a_at | Cenpa | Centromere protein A | 12615 | 5 | −0.938800118 | 5.988464134 | 0.000222082 | 0.067098594 |
| 1415945_at | Mcm5 | Minichromosome maintenance deficient 5, cell division cycle 46 (S. cerevisiae) | 17218 | 8 | −0.936860277 | 4.054367544 | 0.000259144 | 0.07170327 |
| 1448891_at | Fcrls | Fc receptor-like S, scavenger receptor | 80891 | 3 | −0.925376894 | 9.318029399 | 0.000183309 | 0.06124021 |
| 1416757_at | Zwilch | Zwilch, kinetochore associated, homolog (Drosophila) | 68014 | 9 | −0.902194387 | 6.309892384 | 0.000168534 | 0.058469554 |
| 1418334_at | Dbf4 | DBF4 homolog (S. cerevisiae) | 27214 | 5 | −0.893927151 | 6.841390964 | 0.000191143 | 0.062925136 |
| 1436174_at | Atad2 | Atpase family, AAA domain containing 2 | 70472 | 15 | −0.882577585 | 7.600552606 | 1.86E-05 | 0.013106888 |
| AFFX-r2-Bs-dap-5_at | −0.86945837 | 10.53042728 | 1.82E-05 | 0.013106888 | ||||
| AFFX-DapX-5_at | −0.860133556 | 10.05521236 | 2.10E-05 | 0.013958609 | ||||
| 1416251_at | Mcm6 | Minichromosome maintenance deficient 6 (MIS5 homolog, S. pombe) (S. cerevisiae) | 17219 | 1 | −0.858315987 | 8.325615765 | 0.000233438 | 0.06748906 |
| 1429660_s_at | Smc2 | Structural maintenance of chromosomes 2 | 14211 | 4 | −0.856002583 | 7.216526604 | 1.24E-05 | 0.009654221 |
| 1417458_s_at | Cks2 | CDC28 protein kinase regulatory subunit 2 | 66197 | 13 | −0.839316362 | 7.86782249 | 1.11E-05 | 0.0092458 |
| 1416868_at | Cdkn2c | Cyclin-dependent kinase inhibitor 2C (p18, inhibits CDK4) | 12580 | 4 | −0.836129956 | 6.12344177 | 0.000223428 | 0.067098594 |
| 1417457_at | Cks2 | CDC28 protein kinase regulatory subunit 2 | 66197 | 13 | −0.81379049 | 7.723402569 | 2.50E-05 | 0.015890112 |
| 1438852_x_at | Mcm6 | Minichromosome maintenance deficient 6 (MIS5 homolog, S. pombe) (S. cerevisiae) | 17219 | 1 | −0.749758108 | 7.64596611 | 0.000402883 | 0.092676501 |
| 1443278_at | −0.744465639 | 3.795201185 | 5.01E-05 | 0.025691504 | ||||
| 1416698_a_at | Cks1b | CDC28 protein kinase 1b | 54124 | 3 | −0.722795196 | 9.78476954 | 3.68E-05 | 0.021809078 |
| 1439269_x_at | Mcm7 | Minichromosome maintenance deficient 7 (S. cerevisiae) | 17220 | 5 | −0.722636555 | 7.202355749 | 4.05E-05 | 0.022467357 |
| 1439040_at | Cenpe | Centromere protein E | 229841 | 3 | −0.719923535 | 4.673443364 | 0.000243326 | 0.069457388 |
| 1430447_a_at | Lair1 | Leukocyte-associated Ig-like receptor 1 | 52855 | 7 | −0.714377106 | 6.333351745 | 0.000317802 | 0.079628911 |
| 1424321_at | Rfc4 | Replication factor C (activator 1) 4 | 106344 | 16 | −0.712575965 | 6.803183771 | 1.03E-05 | 0.0092458 |
| 1429364_at | 4930579G24Rik | RIKEN cdna 4930579G24 gene | 75939 | 3 | −0.693804864 | 5.801650455 | 0.000444319 | 0.099204172 |
| 1417305_at | Speg | SPEG complex locus | 11790 | 1 | −0.69237419 | 5.560929585 | 4.88E-05 | 0.025316027 |
| 1424265_at | Npl | N-acetylneuraminate pyruvate lyase | 74091 | 1 | −0.686117769 | 8.236312861 | 6.73E-05 | 0.029399408 |
| 1455033_at | Fam102b | Family with sequence similarity 102, member B | 329739 | 3 | −0.682945448 | 9.023990641 | 5.82E-05 | 0.027040374 |
| 1439436_x_at | −0.682001634 | 8.458610109 | 2.89E-05 | 0.017856664 | ||||
| AFFX-DapX-M_at | −0.669552741 | 12.00937024 | 7.34E-05 | 0.031511664 | ||||
| 1419838_s_at | Plk4 | Polo-like kinase 4 (Drosophila) | 20873 | 3 | −0.661731363 | 7.369464895 | 6.19E-05 | 0.027939309 |
| AFFX-r2-Bs-dap-M_at | −0.656068752 | 12.16297427 | 6.78E-05 | 0.029399408 | ||||
| 1423809_at | Tcf19 | Transcription factor 19 | 106795 | 17 | −0.655651 | 6.697811615 | 0.000357756 | 0.086748212 |
| 1418403_at | −0.646745558 | 3.99343285 | 9.90E-06 | 0.0092458 | ||||
| 1459371_at | −0.639703594 | 3.330641988 | 0.000111201 | 0.042717156 | ||||
| 1427275_at | Smc4 | Structural maintenance of chromosomes 4 | 70099 | 3 | −0.636699981 | 9.889336813 | 0.000226357 | 0.067098594 |
| 1427276_at | Smc4 | Structural maintenance of chromosomes 4 | 70099 | 3 | −0.636392607 | 8.167608285 | 1.17E-05 | 0.0092458 |
| 1419585_at | Rp2h | Retinitis pigmentosa 2 homolog (human) | 19889 | X | −0.625314312 | 6.995631785 | 0.000247986 | 0.069658474 |
| 1448635_at | Smc2 | Structural maintenance of chromosomes 2 | 14211 | 4 | −0.615253418 | 9.046606184 | 0.00026535 | 0.072530616 |
| 1440471_x_at | −0.610865075 | 5.566366706 | 0.000210867 | 0.06673636 | ||||
| 1438320_s_at | Mcm7 | Minichromosome maintenance deficient 7 (S. cerevisiae) | 17220 | 5 | −0.593464087 | 9.166719577 | 0.000134177 | 0.049602424 |
| 1455439_a_at | Lgals1 | Lectin, galactose binding, soluble 1 | 16852 | 15 | −0.587410622 | 12.94937502 | 0.000138487 | 0.050779673 |
| 1415878_at | Rrm1 | Ribonucleotide reductase M1 | 20133 | 7 | −0.584321844 | 8.036876453 | 3.23E-06 | 0.003834443 |
| 1417419_at | Ccnd1 | Cyclin D1 | 12443 | 7 | −0.576144077 | 9.201498108 | 0.000387426 | 0.09148321 |
| 1416118_at | Trim59 | Tripartite motif-containing 59 | 66949 | 3 | −0.556665238 | 10.25174171 | 3.04E-05 | 0.01850647 |
| 1417506_at | Gmnn | Geminin | 57441 | 13 | −0.542861413 | 8.155624224 | 9.34E-05 | 0.038311018 |
| 1439076_at | Dhx29 | DEAH (Asp-Glu-Ala-His) box polypeptide 29 | 218629 | 13 | −0.541516701 | 3.938488955 | 0.000366949 | 0.088501495 |
| 1449251_at | Ndp | Norrie disease (pseudoglioma) (human) | 17986 | X | −0.541343277 | 5.218867522 | 0.000298301 | 0.077329052 |
| 1442178_at | −0.533345869 | 2.585014581 | 0.000431192 | 0.097236031 | ||||
| 1417420_at | Ccnd1 | Cyclin D1 | 12443 | 7 | −0.52516431 | 10.73705667 | 0.000340985 | 0.084036867 |
| 1416544_at | Ezh2 | Enhancer of zeste homolog 2 (Drosophila) | 14056 | 6 | −0.50771044 | 7.078829441 | 0.000223554 | 0.067098594 |
| 1434400_at | Tgif2 | TGFB-induced factor homeobox 2 | 228839 | 2 | −0.500269195 | 4.697314191 | 0.00014771 | 0.052872074 |
| 1434828_at | Fam102b | Family with sequence similarity 102, member B | 329739 | 3 | −0.497665308 | 10.1660915 | 6.78E-07 | 0.00098628 |
| 1449839_at | Casp3 | Caspase 3 | 12367 | 8 | −0.469257971 | 7.646475442 | 2.31E-05 | 0.014852111 |
| 1450105_at | Adam10 | A disintegrin and metallopeptidase domain 10 | 11487 | 9 | −0.452151362 | 7.730866025 | 0.000224757 | 0.067098594 |
| 1445449_at | −0.445871009 | 3.041247901 | 0.000355695 | 0.086714534 | ||||
| 1451577_at | Zbtb20 | Zinc finger and BTB domain containing 20 | 56490 | 16 | −0.440401975 | 8.795279588 | 0.000111605 | 0.042717156 |
| 1434547_at | Cpd | Carboxypeptidase D | 12874 | 11 | −0.440224965 | 9.1896364 | 5.69E-05 | 0.027027604 |
| 1452241_at | Topbp1 | Topoisomerase (DNA) II binding protein 1 | 235559 | 9 | −0.439137196 | 8.888184976 | 4.17E-05 | 0.02265456 |
| 1458847_at | −0.40488218 | 5.413331848 | 0.000385844 | 0.09148321 | ||||
| 1426478_at | Rasa1 | RAS p21 protein activator 1 | 218397 | 13 | −0.403270797 | 7.383508116 | 0.00038507 | 0.09148321 |
| 1458440_at | Cytsb | Cytospin B | 432572 | 11 | −0.402496123 | 8.709958419 | 0.000235806 | 0.067739411 |
| 1429735_at | Qk | Quaking | 19317 | 17 | −0.399851567 | 9.905073814 | 6.87E-08 | 0.000147519 |
| 1441466_at | Tra2b | Transformer 2 beta homolog (Drosophila) | 20462 | 16 | −0.39869007 | 7.189886877 | 0.000315419 | 0.079473168 |
| 1419270_a_at | Dut | Deoxyuridine triphosphatase | 110074 | 2 | −0.389310333 | 8.195464338 | 0.000284278 | 0.076773716 |
| 1433670_at | Emp2 | Epithelial membrane protein 2 | 13731 | 16 | −0.388645004 | 8.865683907 | 8.66E-05 | 0.036146904 |
| 1421955_a_at | Nedd4 | Neural precursor cell expressed, developmentally down-regulated 4 | 17999 | 9 | −0.373977817 | 11.23710511 | 8.87E-07 | 0.00117645 |
| 1449408_at | Jam2 | Junction adhesion molecule 2 | 67374 | 16 | −0.371454368 | 7.976322911 | 0.000197267 | 0.064470562 |
| 1424459_at | Lpcat1 | Lysophosphatidylcholine acyltransferase 1 | 210992 | 13 | −0.370424051 | 7.748290994 | 6.58E-05 | 0.029084529 |
| 1416012_at | Ehd1 | EH-domain containing 1 | 13660 | 19 | −0.365152057 | 2.352790173 | 6.07E-05 | 0.027662448 |
| 1426300_at | Alcam | Activated leukocyte cell adhesion molecule | 11658 | 16 | −0.353828749 | 9.633088206 | 0.000372299 | 0.089314111 |
| 1420475_at | Mtpn | Myotrophin | 14489 | 6 | −0.346958608 | 10.89488202 | 1.85E-05 | 0.013106888 |
| 1448942_at | Gng11 | Guanine nucleotide binding protein (G protein), gamma 11 | 66066 | 6 | −0.340659661 | 11.45532439 | 0.000189529 | 0.062852558 |
| 1421871_at | Sh3bgrl | SH3-binding domain glutamic acid-rich protein like | 56726 | X | −0.339792915 | 9.714114518 | 0.000154802 | 0.054544833 |
| 1416452_at | Oat | Ornithine aminotransferase | 18242 | 7 | −0.334565945 | 10.61591638 | 0.00022056 | 0.067098594 |
| 1457638_x_at | Rfc2 | Replication factor C (activator 1) 2 | 19718 | 5 | −0.332467053 | 3.787763354 | 3.29E-05 | 0.019765971 |
| 1455009_at | Cpd | Carboxypeptidase D | 12874 | 11 | −0.332417447 | 11.02153966 | 4.69E-05 | 0.024861027 |
| 1425148_a_at | −0.330492679 | 9.911770375 | 6.50E-06 | 0.006822235 | ||||
| 1456864_at | −0.329690668 | 7.637260202 | 0.000212898 | 0.06673636 | ||||
| 1452364_at | Suz12 | Suppressor of zeste 12 homolog (Drosophila) | 52615 | 11 | −0.318459702 | 8.755295551 | 1.66E-05 | 0.012294056 |
| 1428229_at | Prkd3 | Protein kinase D3 | 75292 | 17 | −0.315849633 | 9.210570296 | .000175439 | 0.059828297 |
| 1436584_at | Spry2 | Sprouty homolog 2 (Drosophila) | 24064 | 14 | −0.315505191 | 9.405170016 | 0.000441727 | 0.099116095 |
| 1431645_a_at | Gdi2 | Guanosine diphosphate (GDP) dissociation inhibitor 2 | 14569 | 13 | −0.311816557 | 9.222129783 | 0.000158772 | 0.055510036 |
| 1431777_a_at | Hmgn3 | High mobility group nucleosomal binding domain 3 | 94353 | 9 | −0.28490797 | 9.531069895 | 0.000290756 | 0.077073517 |
| 1421867_at | Nr3c1 | Nuclear receptor subfamily 3, group C, member 1 | 14815 | 18 | −0.273389702 | 9.507809306 | 5.67E-06 | 0.006241408 |
| 1421163_a_at | Nfia | Nuclear factor I/A | 18027 | 4 | −0.270353912 | 9.311783627 | 0.000227624 | 0.067098594 |
| 1427418_a_at | Hif1a | Hypoxia inducible factor 1, alpha subunit | 15251 | 12 | −0.269264102 | 12.12968325 | 9.73E-05 | 0.039170935 |
| 1456630_x_at | Son | Son DNA binding protein | 20658 | 16 | −0.259912656 | 5.514125234 | 0.000102045 | 0.040371446 |
| 1455665_at | −0.250923844 | 9.000863357 | 0.000288103 | 0.076961632 | ||||
| 1434875_a_at | Hmgn3 | High mobility group nucleosomal binding domain 3 | 94353 | 9 | −0.216455623 | 11.23865582 | 0.000395541 | 0.092468287 |
| 1417622_at | Slc12a2 | Solute carrier family 12, member 2 | 20496 | 18 | −0.209517839 | 12.84701076 | 0.000288386 | 0.076961632 |
| 1421594_a_at | Sytl2 | Synaptotagmin-like 2 | 83671 | 7 | −0.196868664 | 10.34467457 | 0.000146948 | 0.052872074 |
| 1426477_at | Rasa1 | RAS p21 protein activator 1 | 218397 | 13 | −0.183365681 | 9.77002577 | 0.000397748 | 0.092468287 |
| 1418664_at | Mpdz | Multiple PDZ domain protein | 17475 | 4 | −0.173832728 | 9.811997929 | 0.000340617 | 0.084036867 |
| 1437735_at | Ppp1r12a | Protein phosphatase 1, regulatory (inhibitor) subunit 12A | 17931 | 10 | −0.17099414 | 10.86996247 | 8.74E-05 | 0.036146904 |
| 1417124_at | Dstn | Destrin | 56431 | 2 | −0.165792871 | 12.23140999 | 5.72E-07 | 0.000859868 |
| 1444731_at | Pde4b | Phosphodiesterase 4B, camp specific | 18578 | 4 | −0.161464191 | 2.194657586 | 4.32E-05 | 0.023203628 |
| 1419258_at | Tcea1 | Transcription elongation factor A (SII) 1 | 21399 | 1 | −0.155724152 | 9.279614137 | 0.000403207 | 0.092676501 |
| 1458650_at | 0.111574996 | 2.185422735 | 1.29E-05 | 0.009837963 | ||||
| 1431710_at | Cmtm1 | CKLF-like MARVEL transmembrane domain containing 1 | 353509 | 8 | 0.129419017 | 2.192752448 | 0.000128189 | 0.047780613 |
| 1458999_at | Mrps10 | Mitochondrial ribosomal protein S10 | 64657 | 17 | 0.144462567 | 2.196160229 | 1.08E-05 | 0.0092458 |
| 1447397_at | Fam154b | Family with sequence similarity 154, member B | 330577 | 7 | 0.1765539 | 2.351407136 | 0.000183165 | 0.06124021 |
| 1416341_at | Polr2c | Polymerase (RNA) II (DNA directed) polypeptide C | 20021 | 8 | 0.17770492 | 10.14198093 | 8.09E-05 | 0.034417928 |
| 1418854_at | Birc2 | Baculoviral IAP repeat-containing 2 | 11797 | 9 | 0.181107841 | 9.091052204 | 0.000404809 | 0.092676501 |
| 1421197_a_at | Acin1 | Apoptotic chromatin condensation inducer 1 | 56215 | 14 | 0.203070117 | 8.011609635 | 0.000407345 | 0.092786302 |
| 1456456_x_at | Mela | Melanoma antigen | 17276 | 8 | 0.208254298 | 2.202691498 | 1.13E-05 | 0.0092458 |
| 1415744_at | H2-Ke2 | H2-K region expressed gene 2 | 14976 | 17 | 0.229447346 | 9.962634591 | 5.72E-05 | 0.027027604 |
| 1415825_s_at | 0.250431438 | 9.242002243 | 1.99E-06 | 0.002499325 | ||||
| 1445796_at | 0.253687541 | 2.287014411 | 1.96E-06 | 0.002499325 | ||||
| 1430355_a_at | Steap3 | STEAP family member 3 | 68428 | 1 | 0.259642804 | 2.231116337 | 3.96E-05 | 0.02232997 |
| 1434128_a_at | Zfp574 | Zinc finger protein 574 | 232976 | 7 | 0.272715738 | 8.382992378 | 9.57E-05 | 0.038893825 |
| 1424105_a_at | Pttg1 | Pituitary tumor-transforming gene 1 | 30939 | 11 | 0.310834954 | 9.260582038 | 0.000298703 | 0.077329052 |
| 1421266_s_at | Nfkbib | Nuclear factor of kappa light polypeptide gene enhancer in B-cells inhibitor, beta | 18036 | 7 | 0.330314423 | 6.829432477 | 5.35E-05 | 0.026535058 |
| 1452323_at | Spryd3 | SPRY domain containing 3 | 223918 | 15 | 0.343767284 | 6.359462159 | 0.000314459 | 0.079473168 |
| 1449946_a_at | Zfp593 | Zinc finger protein 593 | 68040 | 4 | 0.366799342 | 2.235778523 | 1.58E-07 | 0.000296868 |
| 1428955_x_at | Slc9a3r2 | Solute carrier family 9 (sodium/hydrogen exchanger), member 3 regulator 2 | 65962 | 17 | 0.380216255 | 5.670220407 | 0.000345934 | 0.084793329 |
| 1445521_at | Elavl1 | ELAV (embryonic lethal, abnormal vision, Drosophila)-like 1 (Hu antigen R) | 15568 | 8 | 0.424761143 | 2.580184206 | 9.97E-05 | 0.039782909 |
| 1447521_x_at | Arhgap39 | Rho gtpase activating protein 39 | 223666 | 15 | 0.455727425 | 7.791080283 | 3.55E-06 | 0.004110779 |
| 1444687_at | C1ql2 | Complement component 1, q subcomponent-like 2 | 226359 | 1 | 0.455890584 | 2.232967485 | 5.21E-05 | 0.026090601 |
| 1425099_a_at | Arntl | Aryl hydrocarbon receptor nuclear translocator-like | 11865 | 7 | 0.471624543 | 6.926906582 | 0.000232857 | 0.06748906 |
| 1455625_at | Taf10 | TAF10 RNA polymerase II, TATA box binding protein (TBP)-associated factor | 24075 | 7 | 0.472883669 | 6.386041289 | 0.000414451 | 0.093930531 |
| 1436080_at | AW011738 | Expressed sequence AW011738 | 100382 | 4 | 0.577699956 | 3.208346666 | 0.000146694 | 0.052872074 |
| 1437895_at | Ano8 | Anoctamin 8 | 382014 | 8 | 0.578429707 | 2.982308738 | 2.68E-05 | 0.016775714 |
| 1429683_at | Ttpal | Tocopherol (alpha) transfer protein-like | 76080 | 2 | 0.634696898 | 2.297481209 | 7.85E-07 | 0.001072929 |
| 1456341_a_at | Klf9 | Kruppel-like factor 9 | 16601 | 19 | 0.647866078 | 13.56198497 | 0.000221584 | 0.067098594 |
| 1459211_at | Gli2 | GLI-Kruppel family member GLI2 | 14633 | 1 | 0.656120515 | 6.28713459 | 0.000296285 | 0.077329052 |
| 1456551_at | 0.663002676 | 6.58802102 | 1.17E-05 | 0.0092458 | ||||
| 1451707_s_at | Slc41a3 | Solute carrier family 41, member 3 | 71699 | 6 | 0.708570154 | 4.221361487 | 0.000397174 | 0.092468287 |
| 1434202_a_at | Fam107a | Family with sequence similarity 107, member A | 268709 | 14 | 0.70935785 | 12.42842253 | 0.000126093 | 0.047391057 |
| 1416822_at | Dgcr14 | Digeorge syndrome critical region gene 14 | 27886 | 16 | 0.711503522 | 3.810428731 | 2.15E-05 | 0.014070373 |
| 1460459_at | Paqr5 | Progestin and adipoq receptor family member V | 74090 | 9 | 0.71385502 | 2.508969498 | 5.75E-05 | 0.027027604 |
| 1427091_at | Znfx1 | Zinc finger, NFX1-type containing 1 | 98999 | 2 | 0.758493811 | 5.854061725 | 0.000247099 | 0.069658474 |
| 1438355_at | Tmem90a | Transmembrane protein 90a | 627191 | 12 | 0.774431363 | 2.613623643 | 1.07E-05 | 0.0092458 |
| 1434203_at | Fam107a | Family with sequence similarity 107, member A | 268709 | 14 | 0.815384732 | 10.5462952 | 0.00017643 | 0.059828297 |
| 1418710_at | Cd59a | CD59a antigen | 12509 | 2 | 0.859536149 | 9.678137754 | 1.25E-08 | 3.76E-05 |
| 1439825_at | Dtx3l | Deltex 3-like (Drosophila) | 209200 | 16 | 0.894876503 | 6.398634387 | 0.000314298 | 0.079473168 |
| 1421911_at | Stat2 | Signal transducer and activator of transcription 2 | 20847 | 10 | 0.904194187 | 3.706003989 | 5.88E-05 | b0.027076306 |
| 1436763_a_at | Klf9 | Kruppel-like factor 9 | 16601 | 19 | 0.940687065 | 8.705507464 | 0.000292223 | 0.077073517 |
| 1421037_at | Npas2 | Neuronal PAS domain protein 2 | 18143 | 1 | 0.942006114 | 5.466528073 | 9.37E-06 | 0.009050868 |
| 1429830_a_at | Cd59a | CD59a antigen | 12509 | 2 | 0.946400942 | 8.930716143 | 4.64E-08 | 0.000110118 |
| 1426915_at | Dapk1 | Death associated protein kinase 1 | 69635 | 13 | 0.946743286 | 6.888382903 | 2.04E-07 | 0.00036876 |
| 1450484_a_at | Cmpk2 | Cytidine monophosphate (UMP-CMP) kinase 2, mitochondrial | 22169 | 12 | 0.963172651 | 8.200096609 | 1.48E-05 | 0.011095655 |
| 1428306_at | Ddit4 | DNA-damage-inducible transcript 4 | 74747 | 10 | 0.976582722 | 9.883199197 | 5.50E-05 | 0.0269511 |
| 1435918_at | Fam107a | Family with sequence similarity 107, member A | 268709 | 14 | 1.066937661 | 5.301492621 | 0.000207205 | 0.066277746 |
| 1417141_at | Igtp | Interferon gamma induced gtpase | 16145 | 11 | 1.140412802 | 7.957198967 | 0.000300716 | 0.077329052 |
| 1419714_at | Cd274 | CD274 antigen | 60533 | 19 | 1.198293107 | 4.692778191 | 0.000153394 | 0.054474272 |
| 1460603_at | Samd9l | Sterile alpha motif domain containing 9-like | 209086 | 6 | 1.300826076 | 7.286107011 | 0.000232948 | 0.06748906 |
| 1419083_at | Tnfsf11 | Tumor necrosis factor (ligand) superfamily, member 11 | 21943 | 14 | 1.333472182 | 2.497808653 | 0.000251966 | 0.070147731 |
| 1419699_at | Scgb3a1 | Secretoglobin, family 3A, member 1 | 68662 | 11 | 1.437983381 | 3.135180092 | 4.74E-05 | 0.024861027 |
| 1458089_at | 1.51422121 | 2.804055563 | 1.14E-05 | 0.0092458 | ||||
| 1431213_a_at | LOC67527 | Murine leukemia retrovirus | 67527 | 18 | 2.086600168 | 7.016864344 | 2.06E-05 | 0.013958609 |
| 1455869_at | 2.531706562 | 7.572095274 | 0.000170292 | 0.058628642 |
In this table, we include the 202 differentially expressed Affymetrix probe sets. Chr, chromosomal number; logFC, log2 fold change value for that probe set in trkB.T1 KO spinal cord compared with WT; AveExpr, average signal intensity for each probe set across the 1 d dataset.
Deleting trkB.T1 attenuates SCI-induced expression of cell-cycle-related molecules
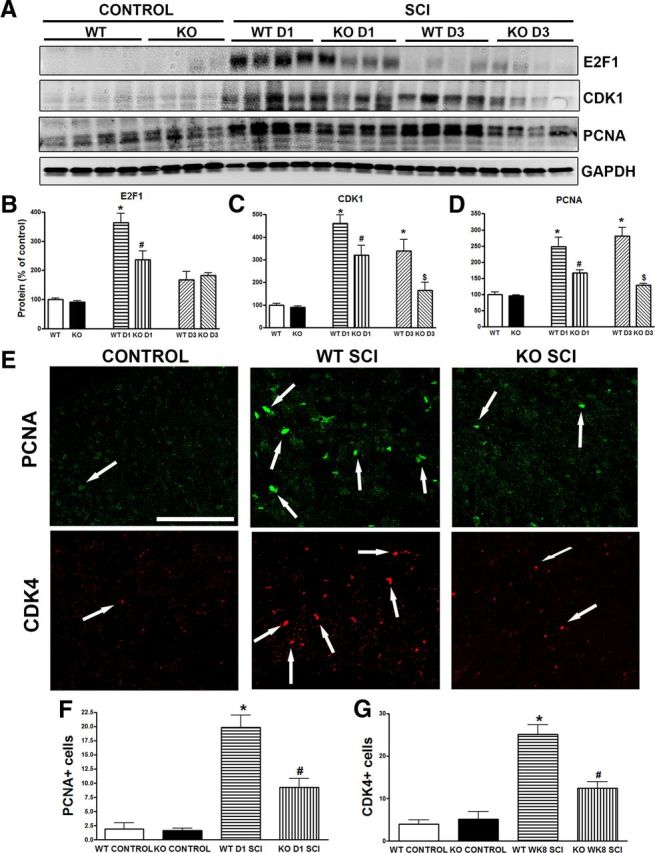
Because the microarray results demonstrated that cell cycle pathway genes are upregulated in the trkB.T1+/+ mice after SCI, but not in the trkB.T1−/− mice, we next examined the expression levels of the mRNA for CDK1 and protein products of selected cell cycle genes in the injured spinal cord epicenter (E2F1, cyclin E, and CDK1) by Western blot analysis in controls and at 1 d after SCI. The microarray results for selected genes were verified via qPCR. For example, as shown in Figure 6A, we identified a nearly 6-fold increase in CDK1 in the trkB.T1 WT spinal cord compared with KO spinal cord samples by microarray. qPCR validated this finding (Fig. 6A). Western blot analysis showed that there was no difference in the expression levels for these three proteins between genotypes in the uninjured control state. However, at 1 d after SCI, E2F1 was significantly upregulated in the trkB.T1+/+ mice compared the trkB.T1−/− mice (Fig. 6B,C; p < 0.05). In contrast, there was no difference in the expression level of E2F1 in the trkB.T1−/− mice between control and day 1. CDK1 (Fig. 6B,C) and cyclin E (Fig. 6B,C) were also significantly upregulated in both genotypes at 1 d after SCI; however, the expression of both proteins was significantly higher in the trkB.T1+/+ mice than in the trkB.T1−/− mice (p < 0.05). Further, we examined expression of cell-cycle-related proteins up to 8 weeks after SCI. Quantitative analysis of Western blots showed that the expression of cyclin D1, CDK4, and PCNA remained elevated chronically after injury (Fig. 6D,E; 1.7- to 3.2-fold elevated compared with the uninjured control) in the trkB.T1+/+ mice, consistent with our prior study in rat SCI (Gwak et al., 2012; Wu et al., 2012a; Wu et al., 2012b) In contrast, the expression levels of these three proteins were significantly attenuated in the injured spinal cord from the trkB.T1−/− mice (Fig. 6D,E; p < 0.05).
Figure 6.

Deleting trkB.T1 attenuates upregulation of cell-cycle-related proteins in the lesioned and lumbar areas of post-SCI spinal cord and reactive astrocytes in vitro. A, Cdk1 is significantly upregulated 24 h after SCI in trkB.T1+/+ spinal cord by microarray (n = 4, 5.9 FC, FDR p = 2.09E-10) and qPCR (n = 4, FC 4.16, p = 0.0022), but not in trkB.T1−/− mice (n = 4). B, Representative immunoblots of E2F1, CDK1, and cyclin E in spinal cord tissue from trkB.T1+/+ and trkB.T1−/− mice 24 h after SCI. C, Quantification showing E2F1, CDK1, and cyclin E protein upregulation in trkB.T1+/+ and trkB.T1−/− mice compared with controls, which was significantly attenuated in trkB.T1−/− compared with trkB.T1+/+ mice (n = 4 mice/group). D, Representative immunoblots of cyclin D1, CDK4, and PCNA in spinal cord tissue from trkB.T1+/+ and trkB.T1−/− mice 8 weeks after SCI. E, Quantification showing upregulation of all three proteins in trkB.T1+/+ and CDK4 and PCNA in trkB.T1−/− mice compared with the controls, which was significantly attenuated in trkB.T1−/− compared with trkB.T1+/+ mice (n = 8 mice/group). *p < 0.05, WT SCI versus WT control; #p < 0.05, KO SCI versus WT SCI. F, Representative immunoblots of PCNA and CDK4 in primary astrocyte cultures from trkB.T1+/+ and trkB.T1−/− mice ± TGFβ1. G, Quantification showed significant attenuation of protein upregulation in reactive astrocytes from trkB.T1−/− compared with trkB.T1+/+ mice. *p < 0.05, WT TGFβ1 versus WT control; #p < 0.05, KO TGFβ1 versus WT-TGFβ1; n = 4 independent cultures/group.
To further evaluate the role of trkB.T1 in the activation of cell cycle pathways, we examined the expression of cell cycle proteins in cultured astrocytes. We found that expression levels of PCNA and CDK4 were markedly elevated in hypertrophic astrocytes stimulated by TGFβ1 (Fig. 6F,G). There was no difference in the basal expression level of PCNA and CDK4 in cultured astrocytes between the trkB.T1+/+ and trkB.T1−/− mice. In contrast, the upregulation of PCNA and CDK4 by TGFβ1 was markedly attenuated in the astrocytes from the trkB.T1−/− mice compared with that from the trkB.T1+/+ mice (Fig. 6G).
Further, the expression of cell-cycle-related proteins was examined in the lumbar SDH by Western blot and immunohistochemistry. There was no difference in the expression levels for E2F1, CDK1, and PCNA between genotypes in the uninjured control state. One day after SCI, expression levels of E2F1, CDK1, and PCNA in the lumbar SDH were markedly increased in the trkB.T1+/+ mice, but were significantly lower in the trkB.T1−/− mice (Fig. 7A–D). Elevation of E2F1 was transit only at 24 h after SCI, but at 3 d after injury, the expression of CDK1 and PCNA remained higher in the trkB.T1+/+ mice than in the trkB.T1−/− mice. In the intact spinal cord, immunoreactivity of PCNA and CDK4 was barely detected (Fig. 7E). At 24 h after SCI, PCNA immunoreactivity was upregulated in the trkB.T1+/+ mice, consistent with our prior study in the rat (Wu et al., 2012b). CDK4-positive cells were also increased at 8 weeks after injury. The upregulation of these cell-cycle-related proteins was clearly attenuated in the lumbar SDH in mice with trkB.T1 gene deletion (Fig. 7F,G). Overall, these data suggest that trkB.T1 plays a role in the activation of cell cycle pathways after SCI.
Figure 7.
Deleting trkB.T1 attenuates upregulation of cell-cycle-related proteins in the lumbar SDH after SCI. A–D, Western blot analysis showing that 1 d after SCI, expression levels of E2F1, CDK1, and PCNA in the lumbar SDH were markedly increased in the trkB.T1+/+ mice, but significantly lower in trkB.T1−/− mice. Elevation of E2F1 was transit only at 24 h after SCI, but at 3 d after injury, the expression of CDK1 and PCNA remained higher in the trkB.T1+/+ mice than that in the trkB.T1−/− mice (n = 4 mice per group). *p < 0.05, WT D1/D3 SCI versus WT control; #p < 0.05, KO D1 SCI versus WT D1 SCI; and $p < 0.05, KO D3 SCI versus WT D3 SCI. E, Representative coronal sections of lumbar spinal cord stained for PCNA and CDK4. F, Few PCNA+ cells were found in the SDH of control mice. PCNA+ cells increased in trkB.T1+/+ (n = 6) and trkB.T1−/− mice (n = 6) 1 d after SCI compared with controls (n = 4), which was significantly attenuated in trkB.T1−/− compared with trkB.T1+/+ mice. G, Few CDK4+ cells were found in the SDH of control mice. CDK4+ cells increased in trkB.T1+/+ (n = 7) and trkB.T1−/− mice (n = 7) 8 weeks after SCI compared with controls (n = 4), which was significantly attenuated in trkB.T1−/− compared with trkB.T1+/+ mice. Scale bar, 100 μm. The data in B–D and F–G were analyzed by one-way ANOVA with post hoc analysis using Student–Newman–Keuls test. *p < 0.05, WT SCI versus WT control; #p < 0.05, KO SCI versus WT SCI. Data are expressed as mean ± SEM.
Inhibition of the cell cycle pathway decreases mechanical hyperesthesia and improves outcome in WT mice, but not in trkB.T1 KO mice
Given that the cell cycle is upregulated after SCI and that deletion of trkB.T1 attenuates the upregulation of cell cycle proteins, the development of mechanical hyperesthesia, and locomotor dysfunction, we examined the effect of inhibiting the cell cycle on these behavioral outcomes. C57BL/6J mice received a moderate contusion SCI or sham SCI. Immediately and once daily for 6 consecutive days after the injury, the mice received an intrathecal injection (5 μl) of the selective CDK inhibitor CR8 (1 mm) or saline. The mice were behaviorally tested for locomotor function and mechanical hyperesthesia as described above. The CR8-treated SCI mice (n = 19) had significantly better BMS scores than the saline-treated SCI mice (n = 19; p < 0.05) by day 14, and this effect persisted through day 42 after SCI (Fig. 8A). At 4 weeks after SCI, the mice regained adequate locomotor function to undergo nocifensive behavioral testing. On day 28 after SCI, the CR8-treated SCI mice (n = 10) had significantly higher mechanical thresholds than the saline-treated SCI mice (n = 10), which persisted through day 42 (Fig. 8B; p < 0.05). There was also a left shift in the stimulus response curves of both SCI groups on days 28, 35, and 42, indicating an increase in the number of withdrawals from each filament (Fig. 8D–F). The number of withdrawals by the saline-treated SCI mice was significantly higher than those by the CR8-treated SCI mice (Fig. 8D–F; p < 0.05). There was no difference in threshold or stimulus-response frequency between the CR8-treated and saline-treated sham SCI groups (n = 6 each; Fig. 8B,C–F). Therefore, inhibiting cell cycle activation improves the recovery of locomotor function and attenuates the development of mechanical hyperesthesia after SCI.
Figure 8.

The CDK inhibitor CR8 decreased mechanical hyperesthesia and improved locomotor function in trkB.T1+/+ but not trkB.T1−/− mice. Intrathecal CR8 (1 mm/5 μl) or saline was given immediately after SCI and for 6 subsequent days. Assessments occurred before and on days 1, 3, 7, 14, 21, 28, 35, and 42 post-SCI for locomotor function and on days 28, 35, and 42 post-SCI for mechanical sensitivity. A, CR8-treated trkB.T1+/+ mice (n = 19) had significantly higher BMS scores on days 14–42 compared with saline-treated mice (n = 19; p < 0.05, two-way ANOVA with repeated measures). B, CR8-treated trkB.T1+/+ mice (n = 10) had significantly higher mechanical thresholds on days 28–42 than saline-treated mice (n = 10; Mann–Whitney U test, p < 0.05). There was no effect of CR8 on sham-SCI mice (n = 6/group). C–F, Stimulus-response curves in intact naive mice and at 28, 35, and 42 d after SCI demonstrate that the saline-treated SCI mice (n = 10) withdrew their paws from the mechanical stimuli significantly more frequently than the CR8-treated SCI mice (n = 10; one-way ANOVA; *p < 0.05). There was no difference between the stimulus-response curves of the CR8-treated sham and saline-treated sham mice.
To further address the relationship between the expression of trkB.T1 and cell cycle activation after SCI, we performed Western blot analysis of tissue harvested from the epicenter of the injured spinal cord from C57BL/6J mice with or without CR8 treatment. CR8 treatment, like deletion of trkB.T1, significantly reduced the SCI-induced increase in expression of CDK4, PCNA, and E2F5 at 8 weeks after injury (Fig. 9A,B). In contrast, there was no difference in expression levels of trkB.T1 between the CR8-treated and saline-treated sham SCI groups (Fig. 9C,D). These data are consistent with the concept that trkB.T1 acts upstream of the cell cycle pathway. Last, we compared the effects of CDK inhibition alone or in combination with trkB.T1 deletion on hyperesthesia and locomotor function. The trkB.T1−/− mice received intrathecal treatment or vehicle as described above. There was no difference in hyperesthesia or locomotor function across the treatment groups (Fig. 9E,F). No differences in the expression of cell-cycle-related proteins were observed between these two groups at 8 weeks after injury (Fig. 9G,H). Therefore, cell cycle inhibition and trkB.T1 deletion have identical effects on behavior and cell cycle activation, with no additive effects produced by the combined intervention.
Figure 9.

Cell cycle inhibition by CR8 has no effects on behavior and cell cycle activation in the trkB.T1−/− mice after SCI. A, CDK4, PCNA, and E2F5 expression were upregulated 8 weeks after injury in trkB.T1+/+ mice. B, CR8 treatment (n = 6) significantly attenuated SCI-induced protein upregulation compared with saline (n = 5; n = 3 control, n = 5 saline, n = 6 CR8). *p < 0.05, vehicle versus control; #p < 0.05, CR8 versus vehicle. C, Representative immunoblot showing increased trkB.T1 expression 8 weeks after SCI, with trkB.FL remaining unchanged. D, There was no difference in trkB.T1 expression between CR8-treated mice (n = 5) and saline-treated trkB.T1+/+ mice (n = 3). E, There was no difference in locomotor function between CR8-treated (n = 13) and saline-treated (n = 15) trkB.T1−/− mice after SCI. F, There was no difference in mechanical hyperesthesia between CR8-treated (n = 11) and saline-treated (n = 11) trkB.T1−/− mice after SCI. There was no CR8 effect on sham-SCI mice (n = 6/group). G–H, CDK4, PCNA, and E2F5 expression did not differ between CR8-treated (n = 6) and saline-treated (n = 5) trkB.T1−/− mice 8 weeks after SCI. Data are expressed as mean ± SEM.
Discussion
In a mouse spinal cord contusion model, we show here that trkB.T1 expression is upregulated after injury and is associated with increased expression of cell cycle genes and proteins, microglial and astroglial activation, and the development of hyperesthesia and locomotor deficits. Related causal relationships between these effects is supported by the observation that trkB.T1−/− mice show reduced posttraumatic cell cycle activation, improved recovery of locomotor function, and reduced mechanical hyperesthesia. In vitro, a reduction in the elevation of cell cycle protein expression was observed in reactive astrocytes from trkB.T1 mutant mice, further suggesting trkB.T1 regulation of cell cycle pathways. In addition, inhibiting cell cycle activation using a potent selective CDK inhibitor decreased mechanical hyperesthesia, locomotor dysfunction, and neuroinflammatory markers to the same degree as trkB.T1 gene deletion, with no additive effect when administered to the trkB.T1−/− mice.
The expression of trkB is conserved across species and throughout evolution and trkB isoform expression is regulated during development when the dominant trkB isoform expressed in the brain switches from trkB.FL to trkB.T1 (Klein et al., 1990). Both full-length and truncated trkB isoforms are widely expressed throughout the adult mammalian CNS (Yan et al., 1997) and are often coexpressed in neurons (Amanini et al., 1995). Glial cells, including astrocytes, oligodendrocytes, and Schwann cells, however, exclusively express truncated trkB.T1 (Tessarollo, 1998). TrkB.T1 is also upregulated under certain pathological conditions, including: (1) postmortem brains of Alzheimer's disease patients and breast cancer tumors (Ferrer et al., 1999), (2) dorsal root ganglion neurons in a rodent model of HIV-associated neuropathic pain (Maratou et al., 2009), and (3) in the SDH after antiretroviral drug treatment and hindpaw inflammation when nocifensive behaviors develop (Renn et al., 2011). We have also shown that upregulation of trkB.T1 is a mechanism underlying premature hippocampal cell death in a mouse model of Down syndrome (Dorsey et al., 2002; Dorsey et al., 2006). Although prior studies have shown trkB.T1 upregulation after SCI (King et al., 2000; Liebl et al., 2001), little is known about the role for trkB.T1 in locomotor dysfunction or the development of mechanical hyperesthesia or why trkB.T1 expression is altered.
Although the physiological function of trkB.T1 remains unclear, the abundance of trkB.T1 expression in the adult CNS suggests that it serves as more than a dominant-negative inhibitor of trkB.FL. In fact, evidence suggests that, in the absence of trkB.FL signaling, trkB.T1 regulates modification of the cytoskeleton in neuronal and glial cells (Haapasalo et al., 1999; Yacoubian and Lo, 2000). There is also evidence suggesting that trkB.T1 induces cell signaling through regulation of kinase activity (Baxter et al., 1997; Cheng et al., 2007) and via trkB.T1 signaling independently (Rose et al., 2003), although the mechanisms of this process remain unclear. Maintaining a proper balance between trkB.FL and trkB.T1 levels is necessary for normal physiological functioning; this was highlighted by a recent study showing that trkB.T1 is involved in excitotoxicity (Vidaurre et al., 2012).
Here, we have shown that deleting trkB.T1 can significantly improve motor function recovery, reduce mechanical hyperesthesia, and temper histopathological changes after moderate spinal cord contusion. This finding is consistent with recent evidence showing that reducing trkB.T1 expression delays the development of motor neuron loss and functional impairment in a mouse model of amyotrophic lateral sclerosis (Yanpallewar et al., 2012). It is thus tempting to hypothesize a common signaling pathway as the mechanism underlying the decrease in nocifensive behavior and locomotor dysfunction in mice with SCI in the absence of trkB.T1. Our results from microarray and Western blot analyses comparing the trkB.T1 KO with the WT after SCI showed that upregulation of cell cycle molecules in SCI does not occur in the trkB.T1-null mouse. These results suggest for the first time that there may be a role for trkB.T1-mediated cell cycle gene regulation changes in SCI pain, providing mechanistic insight into why gene deletion of trkB.T1 produces reduced pain.
TrkB full-length is not expressed in astrocytes from either WT or trkB.T1 homozygous mutants (Haapasalo et al., 1999). Therefore, the astrocyte system is unique and allows us to look specifically at cell cycle genes in a fixed system with and without trkB.T1. TGFβ is rapidly upregulated after CNS injury in vivo and is important both in inducing reactive astrocytes and as a soluble regulator of extracellular matrix formation (Flanders et al., 1998; Smith and Strunz, 2005). Here we report that TGFβ-induced reactive astrocytes from WT mice show increased expression of PCNA and CDK4. Surprisingly, we found significantly attenuated changes in these cell cycle proteins in astrocytes from homozygous trkB.T1 mutant mice in which neither full-length trkB nor trkB.T1 expression was found. This further supports our hypothesis that trkB.T1 signaling regulates cell cycle activation.
We and others have examined the role of cell cycle activation in the pathophysiology of SCI (Wu et al., 2011a). Previously we reported (Di Giovanni et al., 2003; Byrnes et al., 2007; Wu et al., 2012b; Wu et al., 2012c) that acute upregulation of a cluster of cell-cycle-related genes contributes to postmitotic cell death and secondary damage after SCI. More recently, we demonstrated that cell-cycle-related proteins are chronically upregulated after SCI and may contribute to astroglial scar formation, chronic inflammation, and further tissue loss (Wu et al., 2012a; Wu et al., 2012b). Here we show that inhibition of cell cycle activation by a CDK inhibitor in WT mice reduced locomotor deficits, mechanical hyperesthesia, and neuroinflammation after SCI to the same degree as trkB.T1 gene deletion. Further, there were no additive effects when the CDK inhibitor was administered to the trkB.T1-null mice and SCI-induced trkB.T1 upregulation was not altered by application of CDK inhibitor in the WT mice, suggesting that trkB.T1 acts upstream of cell cycle pathways.
Little is known about the role of cell cycle genes in neuropathic pain. Prior studies reported that CDK5 inhibitors reduce heat hyperalgesia in a rat model of CFA-induced inflammation (Yang et al., 2007) or inhibit formalin-induced nociceptive responses in the rat (Wang et al., 2005). However, CDK5 has very complicated bidirectional effects with regard to cell cycle signaling and unrelated actions that complicate interpretation of these results. Recently, the pan-CDK inhibitor flavopiridol administered intrathecally was reported to reduce tactile hyperesthesia after spinal nerve injury through inhibition of astrocyte proliferation (Tsuda et al., 2011). Cell cycle activation contributes to both astroglial and microglial activation after CNS injuries, including SCI (Di Giovanni et al., 2005; Wu et al., 2011a). Activation of astrocytes and microglia has been proposed as a critical mechanism for the induction of SCI pain, with such changes noted in both the SDH (Detloff et al., 2008; Hulsebosch, 2008; Gwak et al., 2012) and thalamus (Zhao et al., 2007). In agreement with these findings, WT mice subjected here to SCI showed increased inflammation in both the injury site and lumbar area of the spinal cord. Inflammation and astrogliosis in the injury site and lumbar area were reduced in the trkB.T1−/− mice and were associated with reduced cell cycle activation.
Our findings strongly implicate upregulation of trkB.T1 in the pathophysiology of post-SCI hyperesthesia through mechanisms that involve cell cycle activation. Therefore, trkB.T1 may represent a new therapeutic target to reduce pain and improve locomotor recovery after SCI. Given the proposed roles for trkB.T1 and cell cycle activation in other hyperpathic pain models, it is plausible that trkB.T1 regulation of cell cycle pathways represents a more generic mechanism relevant to other neuropathic pain states.
Footnotes
This work was supported by the National Institutes of Health (Grant #R01 NR010207 to S.G.D., Grant #R01 NS054221 to A.I.F., and Grant #R01 NR013601 to S.D.G./A.I.F.) and the University of Maryland–Baltimore Organized Research Center on Persistent Pain (to J.W. and C.L.R.). We thank Bassel Shalaby and Katie Shanks (Dorsey laboratory), Yezhou Sun and Anup Mahurkar (Institute for Genome Science, University of Maryland School of Medicine), and Michael Dinizo and Kelsey Guanciale (Faden laboratory) for expert technical support.
The authors declare no competing financial interests.
References
- Armanini MP, McMahon SB, Sutherland J, Shelton DL, Phillips HS. Truncated and catalytic isoforms of trkB are co-expressed in neurons of rat and mouse. Eur J Neurosci. 1995;7:1403–1409. doi: 10.1111/j.1460-9568.1995.tb01132.x. [DOI] [PubMed] [Google Scholar]
- Basso DM, Fisher LC, Anderson AJ, Jakeman LB, McTigue DM, Popovich PG. Basso Mouse Scale for locomotion detects differences in recovery after spinal cord injury in five common mouse strains. J Neurotrauma. 2006;23:635–659. doi: 10.1089/neu.2006.23.635. [DOI] [PubMed] [Google Scholar]
- Baxter GT, Radeke MJ, Kuo RC, Makrides V, Hinkle B, Hoang R, Medina-Selby A, Coit D, Valenzuela P, Feinstein SC. Signal transduction mediated by the truncated trkB receptor isoforms, trkB.T1 and trkB.T2. J Neurosci. 1997;17:2683–2690. doi: 10.1523/JNEUROSCI.17-08-02683.1997. [DOI] [PMC free article] [PubMed] [Google Scholar]
- Bush TG, Puvanachandra N, Horner CH, Polito A, Ostenfeld T, Svendsen CN, Mucke L, Johnson MH, Sofroniew MV. Leukocyte infiltration, neuronal degeneration, and neurite outgrowth after ablation of scar-forming, reactive astrocytes in adult transgenic mice. Neuron. 1999;23:297–308. doi: 10.1016/S0896-6273(00)80781-3. [DOI] [PubMed] [Google Scholar]
- Byrnes KR, Stoica BA, Fricke S, Di Giovanni S, Faden AI. Cell cycle activation contributes to post-mitotic cell death and secondary damage after spinal cord injury. Brain. 2007;130:2977–2992. doi: 10.1093/brain/awm179. [DOI] [PubMed] [Google Scholar]
- Carim-Todd L, Bath KG, Fulgenzi G, Yanpallewar S, Jing D, Barrick CA, Becker J, Buckley H, Dorsey SG, Lee FS, Tessarollo L. Endogenous truncated TrkB.T1 receptor regulates neuronal complexity and TrkB kinase receptor function in vivo. J Neurosci. 2009;29:678–685. doi: 10.1523/JNEUROSCI.5060-08.2009. [DOI] [PMC free article] [PubMed] [Google Scholar]
- Cheng A, Coksaygan T, Tang H, Khatri R, Balice-Gordon RJ, Rao MS, Mattson MP. Truncated tyrosine kinase B brain-derived neurotrophic factor receptor directs cortical neural stem cells to a glial cell fate by a novel signaling mechanism. J Neurochem. 2007;100:1515–1530. doi: 10.1111/j.1471-4159.2006.04337.x. [DOI] [PubMed] [Google Scholar]
- Coull JA, Beggs S, Boudreau D, Boivin D, Tsuda M, Inoue K, Gravel C, Salter MW, De Koninck Y. BDNF from microglia causes the shift in neuronal anion gradient underlying neuropathic pain. Nature. 2005;438:1017–1021. doi: 10.1038/nature04223. [DOI] [PubMed] [Google Scholar]
- De Biase A, Knoblach SM, Di Giovanni S, Fan C, Molon A, Hoffman EP, Faden AI. Gene expression profiling of experimental traumatic spinal cord injury as a function of distance from impact site and injury severity. Physiol Genomics. 2005;22:368–381. doi: 10.1152/physiolgenomics.00081.2005. [DOI] [PubMed] [Google Scholar]
- Detloff MR, Fisher LC, McGaughy V, Longbrake EE, Popovich PG, Basso DM. Remote activation of microglia and pro-inflammatory cytokines predict the onset and severity of below-level neuropathic pain after spinal cord injury in rats. Exp Neurol. 2008;212:337–347. doi: 10.1016/j.expneurol.2008.04.009. [DOI] [PMC free article] [PubMed] [Google Scholar]
- Di Giovanni S, Knoblach SM, Brandoli C, Aden SA, Hoffman EP, Faden AI. Gene profiling in spinal cord injury shows role of cell cycle in neuronal death. Ann Neurol. 2003;53:454–468. doi: 10.1002/ana.10472. [DOI] [PubMed] [Google Scholar]
- Di Giovanni S, Movsesyan V, Ahmed F, Cernak I, Schinelli S, Stoica B, Faden AI. Cell cycle inhibition provides neuroprotection and reduces glial proliferation and scar formation after traumatic brain injury. Proc Natl Acad Sci U S A. 2005;102:8333–8338. doi: 10.1073/pnas.0500989102. [DOI] [PMC free article] [PubMed] [Google Scholar]
- Dorsey SG, Bambrick LL, Balice-Gordon RJ, Krueger BK. Failure of brain-derived neurotrophic factor-dependent neuron survival in mouse trisomy 16. J Neurosci. 2002;22:2571–2578. doi: 10.1523/JNEUROSCI.22-07-02571.2002. [DOI] [PMC free article] [PubMed] [Google Scholar]
- Dorsey SG, Renn CL, Carim-Todd L, Barrick CA, Bambrick L, Krueger BK, Ward CW, Tessarollo L. In vivo restoration of physiological levels of truncated TrkB.T1 receptor rescues neuronal cell death in a trisomic mouse model. Neuron. 2006;51:21–28. doi: 10.1016/j.neuron.2006.06.009. [DOI] [PubMed] [Google Scholar]
- Faulkner JR, Herrmann JE, Woo MJ, Tansey KE, Doan NB, Sofroniew MV. Reactive astrocytes protect tissue and preserve function after spinal cord injury. J Neurosci. 2004;24:2143–2155. doi: 10.1523/JNEUROSCI.3547-03.2004. [DOI] [PMC free article] [PubMed] [Google Scholar]
- Ferrer I, Marín C, Rey MJ, Ribalta T, Goutan E, Blanco R, Tolosa E, Martí E. BDNF and full-length and truncated TrkB expression in Alzheimer disease. Implications in therapeutic strategies. J Neuropathol Exp Neurol. 1999;58:729–739. doi: 10.1097/00005072-199907000-00007. [DOI] [PubMed] [Google Scholar]
- Flanders KC, Ren RF, Lippa CF. Transforming growth factor-betas in neurodegenerative disease. Prog Neurobiol. 1998;54:71–85. doi: 10.1016/S0301-0082(97)00066-X. [DOI] [PubMed] [Google Scholar]
- Guo W, Zou S, Guan Y, Ikeda T, Tal M, Dubner R, Ren K. Tyrosine phosphorylation of the NR2B subunit of the NMDA receptor in the spinal cord during the development and maintenance of inflammatory hyperalgesia. J Neurosci. 2002;22:6208–6217. doi: 10.1523/JNEUROSCI.22-14-06208.2002. [DOI] [PMC free article] [PubMed] [Google Scholar]
- Gwak YS, Kang J, Unabia GC, Hulsebosch CE. Spatial and temporal activation of spinal glial cells: role of gliopathy in central neuropathic pain following spinal cord injury in rats. Exp Neurol. 2012;234:362–372. doi: 10.1016/j.expneurol.2011.10.010. [DOI] [PMC free article] [PubMed] [Google Scholar]
- Haapasalo A, Saarelainen T, Moshnyakov M, Arumäe U, Kiema TR, Saarma M, Wong G, Castrén E. Expression of the naturally occurring truncated trkB neurotrophin receptor induces outgrowth of filopodia and processes in neuroblastoma cells. Oncogene. 1999;18:1285–1296. doi: 10.1038/sj.onc.1202401. [DOI] [PubMed] [Google Scholar]
- Ha SO, Kim JK, Hong HS, Kim DS, Cho HJ. Expression of brain-derived neurotrophic factor in rat dorsal root ganglia, spinal cord and gracile nuclei in experimental models of neuropathic pain. Neuroscience. 2001;107:301–309. doi: 10.1016/S0306-4522(01)00353-0. [DOI] [PubMed] [Google Scholar]
- Hains BC, Waxman SG. Activated microglia contribute to the maintenance of chronic pain after spinal cord injury. J Neurosci. 2006;26:4308–4317. doi: 10.1523/JNEUROSCI.0003-06.2006. [DOI] [PMC free article] [PubMed] [Google Scholar]
- Hulsebosch CE. Gliopathy ensures persistent inflammation and chronic pain after spinal cord injury. Exp Neurol. 2008;214:6–9. doi: 10.1016/j.expneurol.2008.07.016. [DOI] [PMC free article] [PubMed] [Google Scholar]
- Hylden JL, Wilcox GL. Intrathecal morphine in mice: a new technique. Eur J Pharmacol. 1980;67:313–316. doi: 10.1016/0014-2999(80)90515-4. [DOI] [PubMed] [Google Scholar]
- Jakovcevski I, Wu J, Karl N, Leshchyns'ka I, Sytnyk V, Chen J, Irintchev A, Schachner M. Glial scar expression of CHL1, the close homolog of the adhesion molecule L1, limits recovery after spinal cord injury. J Neurosci. 2007;27:7222–7233. doi: 10.1523/JNEUROSCI.0739-07.2007. [DOI] [PMC free article] [PubMed] [Google Scholar]
- Ji RR, Kohno T, Moore KA, Woolf CJ. Central sensitization and LTP: do pain and memory share similar mechanisms? Trends Neurosci. 2003;26:696–705. doi: 10.1016/j.tins.2003.09.017. [DOI] [PubMed] [Google Scholar]
- King VR, Bradbury EJ, McMahon SB, Priestley JV. Changes in truncated trkB and p75 receptor expression in the rat spinal cord following spinal cord hemisection and spinal cord hemisection plus neurotrophin treatment. Exp Neurol. 2000;165:327–341. doi: 10.1006/exnr.2000.7480. [DOI] [PubMed] [Google Scholar]
- Klein R, Conway D, Parada LF, Barbacid M. The trkB tyrosine protein kinase gene codes for a second neurogenic receptor that lacks the catalytic kinase domain. Cell. 1990;61:647–656. doi: 10.1016/0092-8674(90)90476-U. [DOI] [PubMed] [Google Scholar]
- Klein R, Smeyne RJ, Wurst W, Long LK, Auerbach BA, Joyner AL, Barbacid M. Targeted disruption of the trkB neurotrophin receptor gene results in nervous system lesions and neonatal death. Cell. 1993;75:113–122. [PubMed] [Google Scholar]
- Kovács G, Kocsis P, Tarnawa I, Horváth C, Szombathelyi Z, Farkas S. NR2B containing NMDA receptor dependent windup of single spinal neurons. Neuropharmacology. 2004;46:23–30. doi: 10.1016/S0028-3908(03)00339-3. [DOI] [PubMed] [Google Scholar]
- Latremoliere A, Woolf CJ. Central sensitization: a generator of pain hypersensitivity by central neural plasticity. J Pain. 2009;10:895–926. doi: 10.1016/j.jpain.2009.06.012. [DOI] [PMC free article] [PubMed] [Google Scholar]
- Liebl DJ, Huang W, Young W, Parada LF. Regulation of Trk receptors following contusion of the rat spinal cord. Exp Neurol. 2001;167:15–26. doi: 10.1006/exnr.2000.7548. [DOI] [PubMed] [Google Scholar]
- Maratou K, Wallace VC, Hasnie FS, Okuse K, Hosseini R, Jina N, Blackbeard J, Pheby T, Orengo C, Dickenson AH, McMahon SB, Rice AS. Comparison of dorsal root ganglion gene expression in rat models of traumatic and HIV-associated neuropathic pain. Eur J Pain. 2009;13:387–398. doi: 10.1016/j.ejpain.2008.05.011. [DOI] [PMC free article] [PubMed] [Google Scholar]
- Merighi A, Salio C, Ghirri A, Lossi L, Ferrini F, Betelli C, Bardoni R. BDNF as a pain modulator. Prog Neurobiol. 2008;85:297–317. doi: 10.1016/j.pneurobio.2008.04.004. [DOI] [PubMed] [Google Scholar]
- Michael GJ, Averill S, Nitkunan A, Rattray M, Bennett DL, Yan Q, Priestley JV. Nerve growth factor treatment increases brain-derived neurotrophic factor selectively in TrkA-expressing dorsal root ganglion cells and in their central terminations within the spinal cord. J Neurosci. 1997;17:8476–8490. doi: 10.1523/JNEUROSCI.17-21-08476.1997. [DOI] [PMC free article] [PubMed] [Google Scholar]
- Middlemas DS, Lindberg RA, Hunter T. trkB, a neural receptor protein-tyrosine kinase: evidence for a full-length and two truncated receptors. Mol Cell Biol. 1991;11:143–153. doi: 10.1128/MCB.11.1.143. [DOI] [PMC free article] [PubMed] [Google Scholar]
- Modirian E, Pirouzi P, Soroush M, Karbalaei-Esmaeili S, Shojaei H, Zamani H. Chronic pain after spinal cord injury: results of a long-term study. Pain Med. 2010;11:1037–1043. doi: 10.1111/j.1526-4637.2010.00865.x. [DOI] [PubMed] [Google Scholar]
- Nishi RA, Liu H, Chu Y, Hamamura M, Su MY, Nalcioglu O, Anderson AJ. Behavioral, histological, and ex vivo magnetic resonance imaging assessment of graded contusion spinal cord injury in mice. J Neurotrauma. 2007;24:674–689. doi: 10.1089/neu.2006.0204. [DOI] [PubMed] [Google Scholar]
- Pezet S, Malcangio M, Lever IJ, Perkinton MS, Thompson SW, Williams RJ, McMahon SB. Noxious stimulation induces Trk receptor and downstream ERK phosphorylation in spinal dorsal horn. Mol Cell Neurosci. 2002;21:684–695. doi: 10.1006/mcne.2002.1205. [DOI] [PubMed] [Google Scholar]
- Ramer LM, McPhail LT, Borisoff JF, Soril LJ, Kaan TK, Lee JH, Saunders JW, Hwi LP, Ramer MS. Endogenous TrkB ligands suppress functional mechanosensory plasticity in the deafferented spinal cord. J Neurosci. 2007;27:5812–5822. doi: 10.1523/JNEUROSCI.0491-07.2007. [DOI] [PMC free article] [PubMed] [Google Scholar]
- Ren K. An improved method for assessing mechanical allodynia in the rat. Physiol Behav. 1999;67:711–716. doi: 10.1016/S0031-9384(99)00136-5. [DOI] [PubMed] [Google Scholar]
- Renn CL, Leitch CC, Dorsey SG. In vivo evidence that truncated trkB.T1 participates in nociception. Mol Pain. 2009;5:61. doi: 10.1186/1744-8069-5-61. [DOI] [PMC free article] [PubMed] [Google Scholar]
- Renn CL, Carozzi VA, Rhee P, Gallop D, Dorsey SG, Cavaletti G. Multimodal assessment of painful peripheral neuropathy induced by chronic oxaliplatin-based chemotherapy in mice. Mol Pain. 2011;7:29. doi: 10.1186/1744-8069-7-29. [DOI] [PMC free article] [PubMed] [Google Scholar]
- Rose CR, Blum R, Pichler B, Lepier A, Kafitz KW, Konnerth A. Truncated TrkB-T1 mediates neurotrophin-evoked calcium signalling in glia cells. Nature. 2003;426:74–78. doi: 10.1038/nature01983. [DOI] [PubMed] [Google Scholar]
- Smith GM, Strunz C. Growth factor and cytokine regulation of chondroitin sulfate proteoglycans by astrocytes. Glia. 2005;52:209–218. doi: 10.1002/glia.20236. [DOI] [PubMed] [Google Scholar]
- Tessarollo L. Pleiotropic functions of neurotrophins in development. Cytokine Growth Factor Rev. 1998;9:125–137. doi: 10.1016/s1359-6101(98)00003-3. [DOI] [PubMed] [Google Scholar]
- Thompson SW, Bennett DL, Kerr BJ, Bradbury EJ, McMahon SB. Brain-derived neurotrophic factor is an endogenous modulator of nociceptive responses in the spinal cord. Proc Natl Acad Sci U S A. 1999;96:7714–7718. doi: 10.1073/pnas.96.14.7714. [DOI] [PMC free article] [PubMed] [Google Scholar]
- Tsuda M, Kohro Y, Yano T, Tsujikawa T, Kitano J, Tozaki-Saitoh H, Koyanagi S, Ohdo S, Ji RR, Salter MW, Inoue K. JAK-STAT3 pathway regulates spinal astrocyte proliferation and neuropathic pain maintenance in rats. Brain. 2011;134:1127–1139. doi: 10.1093/brain/awr025. [DOI] [PMC free article] [PubMed] [Google Scholar]
- Vidaurre OG, Gascón S, Deogracias R, Sobrado M, Cuadrado E, Montaner J, Rodríguez-Peña A, Díaz-Guerra M. Imbalance of neurotrophin receptor isoforms TrkB-FL/TrkB-T1 induces neuronal death in excitotoxicity. Cell Death Dis. 2012;3:e256. doi: 10.1038/cddis.2011.143. [DOI] [PMC free article] [PubMed] [Google Scholar]
- Wang CH, Chou WY, Hung KS, Jawan B, Lu CN, Liu JK, Hung YP, Lee TH. Intrathecal administration of roscovitine inhibits Cdk5 activity and attenuates formalin-induced nociceptive response in rats. Acta Pharmacol Sin. 2005;26:46–50. doi: 10.1111/j.1745-7254.2005.00007.x. [DOI] [PubMed] [Google Scholar]
- Wang X, Ratnam J, Zou B, England PM, Basbaum AI. TrkB signaling is required for both the induction and maintenance of tissue and nerve injury-induced persistent pain. J Neurosci. 2009;29:5508–5515. doi: 10.1523/JNEUROSCI.4288-08.2009. [DOI] [PMC free article] [PubMed] [Google Scholar]
- Whittaker MT, Zai LJ, Lee HJ, Pajoohesh-Ganji A, Wu J, Sharp A, Wyse R, Wrathall JR. GGF2 (Nrg1-beta3) treatment enhances NG2+ cell response and improves functional recovery after spinal cord injury. Glia. 2012;60:281–294. doi: 10.1002/glia.21262. [DOI] [PubMed] [Google Scholar]
- Wu J, Wrathall JR, Schachner M. Phosphatidylinositol 3-kinase/protein kinase Cdelta activation induces close homolog of adhesion molecule L1 (CHL1) expression in cultured astrocytes. Glia. 2010;58:315–328. doi: 10.1002/glia.20925. [DOI] [PMC free article] [PubMed] [Google Scholar]
- Wu J, Stoica BA, Faden AI. Cell cycle activation and spinal cord injury. Neurotherapeutics. 2011a;8:221–228. doi: 10.1007/s13311-011-0028-2. [DOI] [PMC free article] [PubMed] [Google Scholar]
- Wu J, Leung PY, Sharp A, Lee HJ, Wrathall JR. Increased expression of the close homolog of the adhesion molecule L1 in different cell types over time after rat spinal cord contusion. J Neurosci Res. 2011b;89:628–638. doi: 10.1002/jnr.22598. [DOI] [PubMed] [Google Scholar]
- Wu J, Pajoohesh-Ganji A, Stoica BA, Dinizo M, Guanciale K, Faden AI. Delayed expression of cell cycle proteins contributes to astroglial scar formation and chronic inflammation after rat spinal cord contusion. J Neuroinflammation. 2012a;9:169. doi: 10.1186/1742-2094-9-169. [DOI] [PMC free article] [PubMed] [Google Scholar]
- Wu J, Stoica BA, Dinizo M, Pajoohesh-Ganji A, Piao C, Faden AI. Delayed cell cycle pathway modulation facilitates recovery after spinal cord injury. Cell Cycle. 2012b;11:1782–1795. doi: 10.4161/cc.20153. [DOI] [PMC free article] [PubMed] [Google Scholar]
- Wu J, Kharebava G, Piao C, Stoica BA, Dinizo M, Sabirzhanov B, Hanscom M, Guanciale K, Faden AI. Inhibition of E2F1/CDK1 pathway attenuates neuronal apoptosis in vitro and confers neuroprotection after spinal cord injury in vivo. PLoS One. 2012c;7:e42129. doi: 10.1371/journal.pone.0042129. [DOI] [PMC free article] [PubMed] [Google Scholar]
- Yacoubian TA, Lo DC. Truncated and full-length TrkB receptors regulate distinct modes of dendritic growth. Nat Neurosci. 2000;3:342–349. doi: 10.1038/73911. [DOI] [PubMed] [Google Scholar]
- Yajima Y, Narita M, Narita M, Matsumoto N, Suzuki T. Involvement of a spinal brain-derived neurotrophic factor/full-length TrkB pathway in the development of nerve injury-induced thermal hyperalgesia in mice. Brain Res. 2002;958:338–346. doi: 10.1016/S0006-8993(02)03666-1. [DOI] [PubMed] [Google Scholar]
- Yan Q, Radeke MJ, Matheson CR, Talvenheimo J, Welcher AA, Feinstein SC. Immunocytochemical localization of trkB in the central nervous system of the adult rat. J Comp Neurol. 1997;378:135–157. doi: 10.1002/(SICI)1096-9861(19970203)378:1<135::AID-CNE8>3.0.CO%3B2-5. [DOI] [PubMed] [Google Scholar]
- Yang YR, He Y, Zhang Y, Li Y, Li Y, Han Y, Zhu H, Wang Y. Activation of cyclin-dependent kinase 5 (Cdk5) in primary sensory and dorsal horn neurons by peripheral inflammation contributes to heat hyperalgesia. Pain. 2007;127:109–120. doi: 10.1016/j.pain.2006.08.008. [DOI] [PubMed] [Google Scholar]
- Yanpallewar SU, Barrick CA, Buckley H, Becker J, Tessarollo L. Deletion of the BDNF truncated receptor TrkB.T1 delays disease onset in a mouse model of amyotrophic lateral sclerosis. PLoS One. 2012;7:e39946. doi: 10.1371/journal.pone.0039946. [DOI] [PMC free article] [PubMed] [Google Scholar]
- Zhao P, Waxman SG, Hains BC. Modulation of thalamic nociceptive processing after spinal cord injury through remote activation of thalamic microglia by cysteine cysteine chemokine ligand 21. J Neurosci. 2007;27:8893–8902. doi: 10.1523/JNEUROSCI.2209-07.2007. [DOI] [PMC free article] [PubMed] [Google Scholar]