Abstract
We have developed a new analytical method of evaluating activatable fluorescent probes for ROS detection using integrated fluorescence spectroelectrochemistry. Tafel formalism was applied to describe the process of the probes’ oxidation under electrochemical conditions and identify a novel parameter defined as the threshold oxidation potential. This potential can serve as an approximation to the equilibrium potential and can be utilized for determining the sensitivity of a probe to oxidation. Based upon the measured values of threshold potentials, the order of sensitivity towards oxidation among several mostly used probes was determined to be following (from highest to lowest): 2,7-dichlorodihydrofluorescein > dihydroethidium > dihydrorhodamine 123 > dihydrorhodamine 6G. The presented approach opens up a new direction in synthesizing and screening novel ROS probes with a well-defined sensitivity for in vitro and in vivo applications.
Introduction
The monitoring of reactive oxygen species (ROS), a diverse group of small oxygen-containing molecules with high chemical reactivities, has become an important approach in understanding the pathological processes of the human body’s inflammatory response in cancers, cardiovascular diseases, and neurological disorders.1–5 The importance of measuring ROS in biologic studies is readily apparent as it allows for the precise monitoring of a variety of biologic events on cellular and subcellular levels, the progressions of various diseases and response to specific treatments.
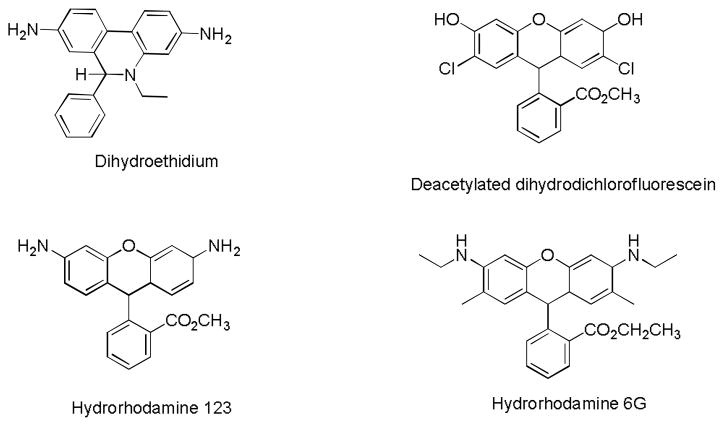
Correspondingly, a great number of biologic and spectroscopic methods for detecting ROS in cells, ex vivo and in vivo, have been developed. While some of these methods are based on ROS’ chemoluminescent properties,6 paramagnetic features,7 and metabolic product analyses,8 the majority of the studies have been performed with activatable fluorescent probes.4, 5, 9 Several major fluorescent probes dominate the field of ROS research (Fig. 1). Despite the structural differences, their mechanism of fluorescence activation is based on the same principle involving the oxidation of the reduced “leuco” (from Greek leuko – white) form of the fluorophore to its oxidized fluorescent dye form. Upon oxidation, an initially broken electronic conjugation of the non-fluorescent leuco dye is restored. Many known commercial probes such as MitoSox and Dihydrocalcein AM as well as modified (i.e. encapsulated10) are based on these major parent compounds.
Fig. 1.
Most common fluorescence activatable probes for studying ROS
The biological interrogation of oxidative processes in cells, in tissues, and in vivo requires the careful selection of an ROS sensor. Besides parameters such as cell permeability, cell retention, organelle targeting, etc., the selection is largely dictated by the probe’s sensitivity to oxidation of the target ROS. Therefore, a number of studies, mostly based on kinetics, have been published devoted to the comparison of these probes to different oxidative agents from small molecules, such as superoxide and hydrogen peroxide, to multicomponent enzymatic and whole-cell assays.11–13
However, there still remains controversy in the selection process of fluorescent probes for ROS detection due, in part, to the limitations of the ROS generation process. The generation of transient, short lived and often highly reactive ROS is not trivial and involves a painstaking combination of chemicals, catalysts, enzymes, and co-factors as well as utilizing advanced techniques such as pulse radiolysis14, 15 and laser flash photolysis.16–18 The lack of a unified method to quantitatively characterize the probes’ specificities and sensitivities has led to controversial and ambiguous results and unconfirmed conclusions.19, 20 As a result, the selection of an appropriate probe for a specific biological application relies either on the probe manufacturer’s semi-quantitative suggestions or the investigator’s preferences.
Herein, we have developed an analytical method for a quantitative assessment of ROS fluorescent probes based on their sensitivity to oxidation. Our approach was centered on defining a single parameter to describe the probes’ sensitivities. This parameter is defined here as the threshold oxidative potential, i.e. the electrochemical potential that causes oxidation of the leuco dyes which leads to an increase in fluorescence intensity. We have combined fluorescence and electrochemical modalities in one instrument to measure the response of fluorescence as a function of applied electrochemical potential. In doing so, we have quantitatively determined the threshold potential for several well-known ROS probes to rank their sensitivity to oxidation.
Results
Threshold oxidation potential: theory
Consider a solution of a leuco dye placed in a three electrode electrochemical cell. At a potential significantly lower than the reduction potential, the compound is entirely in a leuco state (Scheme 1A). At the equilibrium (non-polarized) state, the rates of the oxidation and reduction reactions proceeding at the surface of the working electrode are equal to the potential Eg (Scheme 1B). Under these conditions, and without the presence of other oxidizing agents, the compound is mostly in its original leuco form which renders the solution non-fluorescent. At a higher potential, the oxidation of the leuco form leads to the formation of the fluorescent dye form (Scheme 1C).
Scheme 1.

Interconversion of the leuco and fluorescence forms as a function of applied working electrode potential. Lengths of the arrows reflect the rates of reactions.
The difference between the applied electrochemical potential and Eg is known as the electrode overpotential ηa (Eq. 1).
| (1) |
With an increase of the ηa, the activation barrier for the dye’s oxidation becomes lower while the activation barrier for the reverse reaction increases. This, overall, favours the oxidation reaction. Larger overpotential leads to an increase of the anodic current (ia) and to the accumulation of the oxidized fluorescent dye-product in solution. The relationship between the overpotential and the induced current is known as the Tafel formalism21 and is given by Eq. 2 for anodic oxidation.
| (2) |
where ba is a Tafel slope obtained experimentally from the corresponding potential-current plot, ia is the induced measured anodic current as a result of a chemical reactions reaction, i0 is the background current in the absence of net reaction and at ηa=0. The Tafel formalism is restricted to systems controlled by oxidation processes with fast mass-transfer (i.e. a well stirred electrochemical cell that we utilized in this work).
Combining Eqs. 1 and 2 and subsequent rearrangement yields Eq. 3 where the applied electrochemical potential and the log of the measured current are linearly related. From this equation, Eg can be directly measured as the Y-intercept.
| (3) |
Since fluorescence is directly related to the current ia which is, in general, directly proportional to the amount of the oxidized fluorescent product, we can substitute the current ratio ia/io with the corresponding fluorescence (Eq. 4)
| (4) |
Where fa is the measured fluorescence at the potential E, f0 is initial background fluorescence.
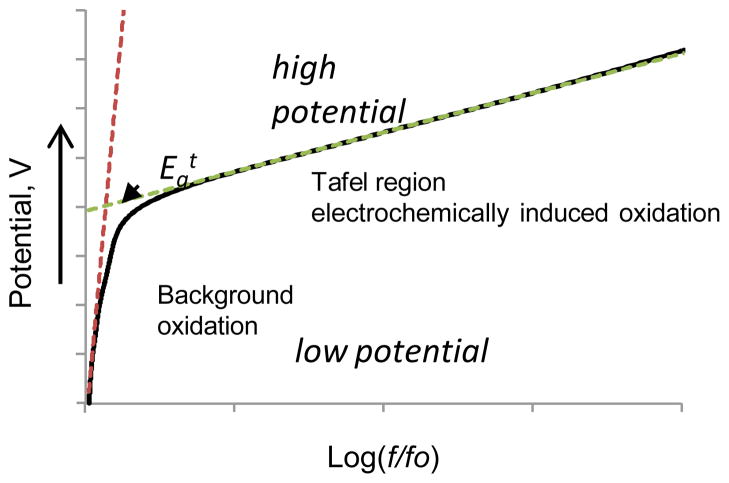
Figure 2 shows a hypothetical Tafel plot for the fluorescence induced by an applied potential. We define the threshold oxidation potential Egt as the value of the sensitivity to oxidation. This parameter can be graphically defined from the Tafel plot as the intercept obtained from two Tafel curves. At low potentials (negative overpotential), the fluorescence is expected to be low and stable or may be slightly increasing as a result of the background oxidation processes caused by the presence of the electrodes or residual ROS in solution. As the potential rises (small overpotential), oxidation starts and fluorescence increases. The continued rise of the applied potential (large overpotential) leads to substantially increasing fluorescence, and the log(f/fo) becomes linearly proportional to the applied potential. In the ideal case with minimum background oxidation (f→fo) and an insignificant role of mass-transfer, the fluorescence increase depends only on the applied potential, and Egt can be measured as an intersection of the linear Tafel slopes.
Fig. 2.
Typical Tafel plot of a hypothetical leuco-dye oxidation under electrochemical condition. Low potential region corresponds to a non-or minimally fluorescent solution at low potentials. High potential region corresponds to the oxidation. The linear part of this region is known as a Tafel region. Egt can be found as a Y coordinate of a cross-section of the two slopes.
Instrumentation design
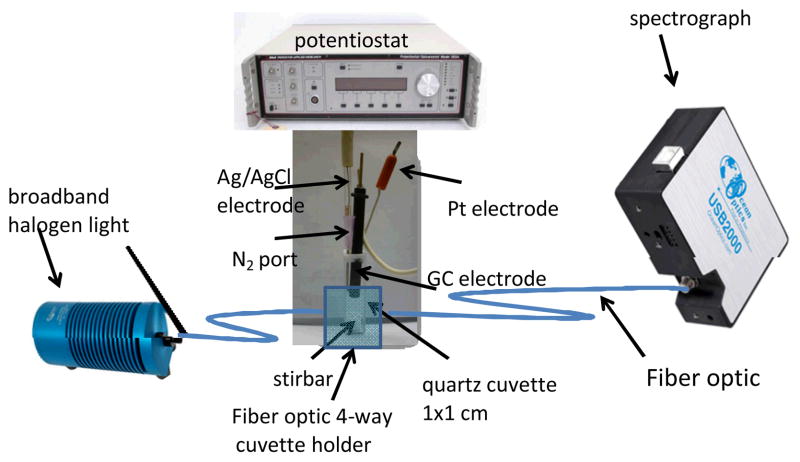
The Egt of leuco-dyes was measured on an in-house built spectrometer that combined an electrochemical method of oxidation with spectroscopic measurements (Fig. 3). In the method, a cuvette was placed into a fluorescence spectrophotometer and essentially acted as a three-electrode voltammetry cell connected to a potentiostat. A continuous step gradient of increasing potential was applied between the working and the reference electrodes. The span of the potential was relatively large covering a 2.8V range from − 0.1V to +2.7V vs. normal hydrogen electrode (NHE). The high redox potential demanded the use of a glassy carbon electrode known for its relatively large inertness at high oxidation potentials.
Fig. 3.
Schematics of instrument setup. The generated fluorescence is recorded as a function of the applied oxidation potential using a fibre-optically connected spectrophotometer. A cuvette with three electrodes is connected to a potentiostat. Halogen lamp (shown) was replaced with LED light sources in some cases.
Since universal reference electrode does not exists for non-aqueous solutions, ferrocene was utilized as an external standard.22 The measured redox potential of ferrocene (Eof) in methanol with LiCl as supporting electrolyte was used as a reference. Under oxidation conditions, ferrocene undergoes a one-electron oxidation to the ferrocenium ion with a well-defined half-wave potential (see Fig. 7 in Materials and Methods). Due to the shielding properties of the two bulky cyclopendadienyls, ferrocene demonstrates negligible dependence on the nature of supporting electrolyte and material of the working electrode and has long been utilized as a calibration standard for electrochemical measurements in organic solvents.23, 24
Fig. 7.
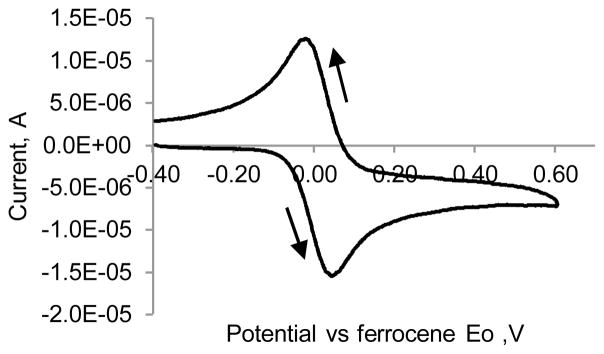
Cyclic voltammetry of ferrocene in the cuvette utilized in this study vs. Eof. 0.1 mM ferrocene, methanol, 0.1 M TBAF, scan rate 100 mV/s, Electrodes: glassy carbon, Ag/AgCl+ in 1M KCl in water, Pt wire.
Arrows show the direction of the scan.
For fluorescence measurements, the cuvette was continuously excited using light source fiber-optically connected to a cuvette holder through bandpass optical filters placed in a filter wheel. The emission signal was recorded at the expected maximum of fluorescence (averaged over a ± 10 nm range) by a high-speed CCD-array spectrophotometer. Alternatively, a CCD camera with corresponding optical filters was utilized (see Supporting Video). Excitation of the sample and recording of the emission signal was synchronized with the applied potential.
Threshold oxidation potential of ROS probes
The selection of the probes was limited to the four most ROS common sensors: DHE, DCFH2-DA, DHR-123 and DHR-6G. All of the compounds, with the exception of DCFH2, were commercially available. The synthesis of DCFH2 required hydrogenation of DCF with sodium borohydride.18 However, the handling of the final DCFH2 product proved to be difficult as it is highly reactive to traces of amounts of air. Instead, DCFH2 was prepared in situ (in a cuvette) from a commercially available DCFH2-DA treated with potassium carbonate in a manner similar to a published procedure.25
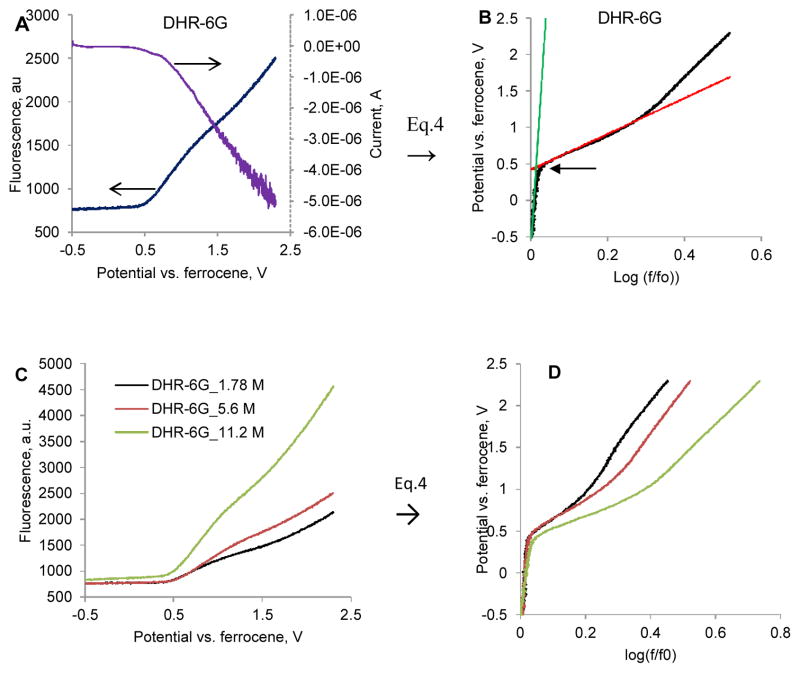
Figure 4 illustrates our approach for measuring the threshold potential for the dye DHR-6G. The initial fluorescence indicated the presence of trace quantities of oxidized dye in the solution. Upon increasing the applied potential from −0.5 to +0.3V vs. Eof, the change in fluorescence was negligible indicating the stability of the leuco form in this range. At potentials >+0.3V vs. Eof, the fluorescence started rapidly increasing. The measured current followed a similar trend indicating that fluorescence and current originated from the same process.
Fig. 4.
Electrochemical oxidation of dihydrorhodamine 6G and the corresponding Tafel plot. A, C: Shows the increase of the emission due to oxidation of the leuco dye B, D: Tafel plots. The intersection (arrow) of the two lines provides Egt threshold oxidation potential. Ex/em.: 460/545–565 nm.
Conversion of the fluorescence vs. potential chart into corresponding Tafel plot using Eq. 4 is shown in Fig. 4B). The Egt can be numerically identified as an intersection of the two tangents. This potential seems to be independent on the concentration of the dye as shown in Fig. C, D. The threshold oxidation potential at different concentrations was within the error of ±22 mV determined from three experiments at the same concentrations. The final intensity of the produced fluorescence was proportional to the concentration of the dye (although the dependence was not entirely linear).
The Tafel plots for DCFH2, DHE and DHR-123 are shown in Fig. 5 and their behavior illustrates the probes’ differences in oxidation sensitivity. For all studied dyes the change in fluorescence was negligible at potentials below their respective threshold potentials. Shortly after the system reached the threshold potential, the signal expressed as log(f/fo) linearly increased in accordance with the Tafel formalism.
Fig. 5.

Tafel plots of a ROS probes in methanol. A: DCFH2 (0.1 mM, ex/em. 460/520–540), B: DHE (0.1 mM, ex/em 500/520–540 nm) and C: DHR-123 (14.4 μM, ex/em. 500/605–625 nm). Arrows point to the Y coordinate corresponding to a threshold potential Egt
Egt values for all four studied compounds are summarized in Fig. 6. A short overview explaining probes’ specific behaviour under the studied conditions is given in the next section.
Fig. 6.
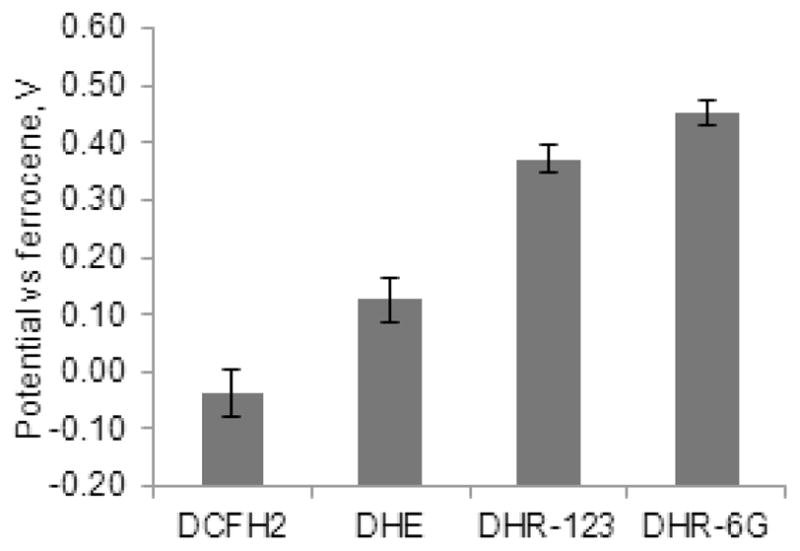
Comparison of the threshold redox potential Egt for four studied ROS activatable probes. The errors were calculated from three experiments at the same concentration of the probe in methanol. DCFH2 -0.037± 0.040V (0.1 mM), DHE +0.126±0.039V (0.1 mM), DHR-123 +0.371±0.023V (5.6 mM), DHR-6G +0.451±0.022V (7.2 mM).
Probes’ oxidation properties
DCFH2
This fluorescein based compound showed the lowest threshold potential demonstrating that the probe is highly sensitive to oxidation (Fig. 5A and Fig. 6). Instead of DCFH2, DCFH2-DA, is commonly used in biological studies.26, 27 The role of the acetate group is twofold: to make the probe permeable to cell membranes and to protect the probe from spontaneous oxidation before entering the cell. After the acetate groups are cleaved by cytosolic esterases, the formed non cell-permeable probe becomes oxidized to a highly fluorescent DCF providing evidence of an oxidative stress. Electrochemical oxidation of DCFH2-DA with the subsequent deacetylation did not result in fluorescence, displaying DCFH2-DA’s stability toward oxidation. When the acetates were cleaved by a base but without any applied potential, an increase in fluorescence was not observed during the experiment time frame. Only under the condition that the acetates were removed before applying potential did the fluorescence intensity emerge.
DHE
DHE demonstrates blue fluorescence (em max 415) nm in aqueous systems.28 After the probe is oxidized to ethidium, it intercalates within DNA and stains the cell nucleus with fluorescent red (em max 615 nm). Without the DNA, the probe is only weakly fluorescent, which explains the low intensity of the signal produced when oxidized even at a relatively high 0.1 mM concentration (Fig. 5B). A number of reports indicated that DHE could be oxidized into two products with distinct absorption/emission spectra: an ethidium and hydroxyl-ethidium.28, 29 The latter is exclusively oxidized by superoxide which allows for selective fluorescent imaging of superoxide in cells and tissues.28, 30 In this work, we did not discriminate between the oxidation processes, however, with some modifications such as the use of dual excitation wavelengths, the method can potentially be used to distinguish between these processes.
DHR-123 and DHR-6G
The rhodamine based probe DHR-123 is oxidized to rhodamine 123, a cationic red fluorescent dye (em max 530 nm) localizing in the mitochondria of living cells. DHR-6G has similar biological applications such as mitochondrial stains, and since it is a longer-wavelength probe (em max 550 nm) it is useful in evaluating ROS in tissues when autofluorescence poses a problem.31 The structure of DHR-6G resembles the structure of DHR-123, and not surprisingly, both probes feature similar Tafel plots (Fig 4B and Fig. 5C). Due to their structural similarities, Egt values of both rhodamine probes were close, although DHR-6G being ~80 mV higher indicates that DHR-6G is the most stable ROS probe toward oxidation.
Overoxidation
At certain high potentials, the systems deviated from the linear response as seen in DCFH2 (>0.5V Fig. 5A), DHR-123 (>0.8 V Fig. 5C), and DHR-6G (>1.0V Fig. 4B). This non-linear behavior indicates that overoxidation of the dyes occurred due to strong oxidative stress. It has been documented19 that activatable fluorescent probes can further participate in overoxidation leading to a decrease in fluorescence. As an example consider DCF, the oxidation product of DCFH2, was shown to be further oxidized to a phenoxyl radical in a horseradish peroxidase–catalyzed reaction.32 The presented results support these observations. In the case of DCFH2, the fluorescence stabilized at applied potentials above ~0.6V (Fig. 5B) pointing to the partial destruction of either the starting material or the product. Overall, rhodamines demonstrated higher stability toward overoxidation, with ethidium being the most stable.
Discussion
The demonstrated method provides critical information as to the sensitivity of the ROS probes to the oxidation process. To the best of our knowledge no other methods have been reported for measuring the sensitivity of these probes. Alternative and more established method based on cyclic voltammetry (CV) proved to be challenging for this purpose. First, the concentration of the probe had to be sufficiently higher in order to generate a measurable amount of the anodic current. Second, the assignment of the peak to a probe’s oxidation was often erroneous due to the presence of electrochemically active impurities and other oxidizable functionalities present on the dye. The presented spectroelectrochemistry method combining electrochemistry and fluorescence is free from these limitations. Although the combination of voltammetry with fluorescence to study redox sensitive species absorbed on the electrodes have been performed to reveal the mechanism of oxidation,33–35 the combination of the two techniques to correlate the specificity of the probes to their activity has not been investigated.
The major output of this method is the threshold oxidation potential Egt. This potential can serve as a model approximation to the equilibrium potential Egt ≈ Eg and enables one to compare the probes to each other. In addition, using Egt, one can also correlate the ability of the probes to be oxidized by different ROS and thus determine which probe is suitable to monitor a certain oxidation process. Recall that ROS can be thermodynamically distinguished by their reduction potentials. Table 1 is a summary of most recently measured ROS standard reduction potentials under physiological conditions. The list indicates only which reactions are thermodynamically possible, but does not necessarily predict which actually occur or how fast. Comparing the tabulated reduction potentials to measured Egt values makes prediction of a dye’s sensitivity straightforward. Oxidants with higher reduction potentials Eo are capable of accepting electrons and oxidizing the probes if Eo >Egt
Table 1.
Reduction potential of the selected ROS at pH=7 at 25 °C
| ROS | Half-Reaction | Eo, V, vs. NHE | Eo, V, vs. Eof |
|---|---|---|---|
| Oxygen | O2 + e− → O2·− | −0.1836 | −0.56 |
| Hydrogen peroxide | H2O2 + e− +H+ → OH·− +H2O | +0.3936 | −0.01 |
| Singlet oxygen | O2 (1Δg) + e− → O2·− | +0.8136 | +0.41 |
| Superoxide | O2·−+ e− → O22− | +0.9136 | +0.51 |
| Nitrogen dioxide | NO2· + e− → NO2− | +0.9937 | +0.59 |
| Hydroperoxyl | HO2· + e− +H+ → H2O2 | +1.0536 | +0.65 |
| Peroxynitrite | ONOO− + e− +2H+ → NO2·+ H2O | +1.4037 | +1.00 |
| Carbonate radical | CO3·− + e− → CO32− | +1.7838 | +1.38 |
| Hydroxyl radical | OH·− + H+ + e− → H2O | + 2.3136 | +1.91 |
A number of previously described findings can be explained using our data. One example is that dihydrorhodamines are considered to be unreactive toward neat hydrogen peroxide39 and quite active in the presence of catalysts converting H2O2 into more active species, such as OH·−. Indeed, a relatively high level of Egt = +0.371V vs. Eof of hydrogen peroxide makes the oxidation of the DHR-123 with the non-catalyzed H2O2 unlikely. In the presence of a catalyst such as peroxidase, cytochrome c, or Fe2+, the produced OH·− radicals with significantly higher reduction potentials (+2.31V) oxidize the probe as reported.11
Conclusions
In this work, we have developed a new analytical method of evaluating fluorescent probes used in ROS detection. Our method, based on measuring the threshold oxidation potential using integrated optical and electrochemical studies, revealed the following order of a probe sensitivity to ROS: DCDHF > DHE > DHR-123 > DHR-6G. The presented method opens up a new direction in screening the dyes and optimizing the design of ROS probes with well-defined threshold potentials and higher overoxidation stabilities. In addition, the approach can create new opportunities for the rapid evaluation of antioxidants or oxidation promoters. These directions are currently under investigation by our laboratory.
Materials and methods
Materials
Solvents DMSO (spectrophotometric grade), methanol, ethanol, acetonitrile (all from Thermo-Fisher Scientific), and high purity water (18.2 MΩ) were used throughout the study. Ferrocene, lithium chloride (99.99%) were purchased from Sigma-Aldrich. Commercially available ROS probes dihydroethidium (DHE) (Sigma-Aldrich), dihydroxyrhodamine 123 (DHR-123), dihydroxyrhodamine 6G (DHR-6G) (Cayman Chemical Company) were used without purification. DCFH2 was prepared from 2,7-dihydrochlorofluorescein acetate (DCFH2-DA) (Cayman).
Electrochemistry setup
Electrochemical experiments (cyclic and staircase voltammetry) were performed with a potentiostat 263A (Princeton Applied Research) operated with PowerCV and PowerSTEP software. The three-electrode electrochemical cell was comprised of a quartz cuvette with a glassy carbon working electrode (d=2 mm, CH Instruments), Pt wire counter electrode, and Ag/AgCl reference electrode (Princeton Applied Research) immersed in a solution of 0.1 KCl in water. The electrodes were inserted in a custom made silicon cap to fit the cuvette. Prior to each experiment, the electrodes were cleaned electrochemically in anhydrous methanol by applying 25 cycles of an alternating potential from −1.0 V to +1.0 V.
Cyclic voltammetry of ferrocene was conducted in methanol at 0.15 mM concentration with 0.1 M LiCl in methanol as supporting electrolyte (Fig. 7). The average potential between oxidation and reduction peaks in the results was compared against literature value of 0.394V to calibrate the instrument.
Combined electrochemical/fluorescence measurements
A solution of the leuco dye in the solvent of interest (2.0 mL) was added to a quartz cuvette (1×1 cm) and stirred at 25 °C with a stir bar at moderate speed to avoid cavitation. The electrodes embedded in a square silicone cap were immersed in the solution ca. 2.0 cm distance from the bottom of the cuvette to avoid crossing an optical path. The cuvette was purged with argon for 2 min prior the measurement. The potential range was scannedfrom −0.5V to +2.3V vs. Eof at a step height of 2.75 mV every 0.6 seconds. Scan rate 0.004583 V/s, total number of points 1017. Fluorescence acquisition (in kinetic mode) was conducted by recording fluorescence intensity at wavelengths ± 10 nm from the maximum fluorescence: DCFH2 – ex. 500±10 nm bandpass filter, emission average of 520–540 nm; DHE – ex. 500 nm ±10 bandpass filter, emission average of 605–625 nm; DHR-123 – ex. 460 nm LED (Thorlabs), emission average of 520–540 nm; DHR-6G – ex. 460 nm LED, emission average of 545–565 nm. Optical measurements were synchronized with a voltammetry scan (fluorescence integration time ~ 1 sec).
Sample preparation
The dyes were dissolved in methanol at low concentrations to avoid non-linearity of the emerging fluorescence signal. The choice of methanol was dictated by good solubility of the studied probes and their fluorescent products upon oxidation. During the acquisition, the solution was stirred to minimize the effect of mass transfer. A stock solution of 1 mg/mL was prepared from the solid probe, or by adding a dye from a commercial solution to a cuvette with 2 mL of methanol. The solution was then purged with argon to eliminate the presence of oxygen under stirring for 2 min.
DCFH2-DA was added to a cuvette at 0.1 mM concentration. Three types of experiments were conducted: 1) Potassium carbonate (2.5 ug) added into a cuvette and incubated for 20 min, fluorescence was recorded without applying potential over 610 sec after the incubation. 2) No base added, applied potential from −0.5 to +2.3V vs. Eof. 3) Potassium carbonate added as a base into a cuvette and incubated for 20 min, fluorescence was recorded synchronously with applied potential −0.5 to +2.3V vs. Eof over 610 sec after the incubation. DHE was added to a cuvette at 0.1 mM concentration in methanol. DHR-6G in DMSO was added to a cuvette with 2 mL of methanol to achieve three concentrations: 1.8 uM, 5.6 uM and 11.2 uM. DHR-123 in DMSO was added to a cuvette with 2 mL of methanol to achieve two concentrations: 7.2 uM, 14.4 uM.
Data acquisition and analysis
Fluorescence data were collected using a SpectraSuite acquisition program (Ocean Optics). Cyclic voltammetry was conducted using PowerCV Voltammetry Software. Potential step voltammetry was conducted using PowerSTEP software (both Princeton Applied Research). For each experiment, the data were collected for a total of 610 seconds. Tafel slopes were calculated using Origin 9.0 (Origin Lab Corp.) with a “Tafel” macro.
Supplementary Material
Acknowledgments
We gratefully acknowledge financial support from the National Cancer Institute of the National Institutes of Health (R21CA149814), the National Heart Lung and Blood Institute as a Program of Excellence in Nanotechnology (HHSN268201000046C) and funds provided by Washington University Molecular Imaging Center.
Footnotes
Electronic Supplementary Information (ESI) available: [video demonstrating fluorescence induced oxidation]. See DOI: 10.1039/b000000x/
Notes and references
- 1.Larson RA, McCord JM. CRC Crit Rev Env Contr. 1977;8:197–246. [Google Scholar]
- 2.Magalotti S, Gustafson T, Cao Q, Abendschein D, Pierce R, Berezin M, Akers W. Mol Imaging Biol. 2013 doi: 10.1007/s11307-013-0614-2. (in press) [DOI] [PMC free article] [PubMed] [Google Scholar]
- 3.Kundu K, Knight SF, Willett N, Lee S, Taylor WR, Murthy N. Angew Chem Int Ed. 2009;48:299–303. doi: 10.1002/anie.200804851. [DOI] [PMC free article] [PubMed] [Google Scholar]
- 4.Chen X, Tian X, Shin I, Yoon J. Chem Soc Rev. 2011;40:4783–4804. doi: 10.1039/c1cs15037e. [DOI] [PubMed] [Google Scholar]
- 5.Liu F, Wu T, Cao J, Zhang H, Hu M, Sun S, Song F, Fan J, Wang J, Peng X. Analyst. 2013;138:775–778. doi: 10.1039/c2an36030f. [DOI] [PubMed] [Google Scholar]
- 6.Faulkner K, Fridovich I. Free Radical Biol Med. 1993;15:447–451. doi: 10.1016/0891-5849(93)90044-u. [DOI] [PubMed] [Google Scholar]
- 7.Valgimigli L, Pedulli GF, Paolini M. Free Radical Biol Med. 2001;31:708–716. doi: 10.1016/s0891-5849(01)00490-7. [DOI] [PubMed] [Google Scholar]
- 8.Khan AU. J Biolumin Chemilumin. 1989;4:200–207. doi: 10.1002/bio.1170040129. [DOI] [PubMed] [Google Scholar]
- 9.Gomes A, Fernandes E, Lima JLFC. J Biochem Biophys Methods. 2005;65:45–80. doi: 10.1016/j.jbbm.2005.10.003. [DOI] [PubMed] [Google Scholar]
- 10.Hammond VJ, Aylott JW, Greenway GM, Watts P, Webster A, Wiles C. Analyst. 2008;133:71–75. doi: 10.1039/b711995j. [DOI] [PubMed] [Google Scholar]
- 11.Royall JA, Ischiropoulos H. Arch Biochem Biophys. 1993;302:348–355. doi: 10.1006/abbi.1993.1222. [DOI] [PubMed] [Google Scholar]
- 12.Hempel SL, Buettner GR, O’Malley YQ, Wessels DA, Flaherty DM. Free Radical Biol Med. 1999;27:146–159. doi: 10.1016/s0891-5849(99)00061-1. [DOI] [PubMed] [Google Scholar]
- 13.Qin Y, Lu M, Gong XG. Cell Biol Int. 2008;32:224–228. doi: 10.1016/j.cellbi.2007.08.028. [DOI] [PubMed] [Google Scholar]
- 14.Zielonka J, Sarna T, Roberts JE, Wishart JF, Kalyanaraman B. Arch Biochem Biophys. 2006;456:39–47. doi: 10.1016/j.abb.2006.09.031. [DOI] [PMC free article] [PubMed] [Google Scholar]
- 15.Wardman P. Rep Prog Phys. 1978;41:259. [Google Scholar]
- 16.Nauser T, Koppenol WH, Pelling J, Schoneich C. Chem Res Toxicol. 2004;17:1227–1235. doi: 10.1021/tx049862u. [DOI] [PubMed] [Google Scholar]
- 17.Shafirovich V, Lymar SV. Proc Natl Acad Sci USA. 2002;99:7340–7345. doi: 10.1073/pnas.112202099. [DOI] [PMC free article] [PubMed] [Google Scholar]
- 18.Loccufier J, Schacht E. Tetrahedron. 1989;45:3385–3396. [Google Scholar]
- 19.Wardman P. Free Radic Biol Med. 2007;43:995–1022. doi: 10.1016/j.freeradbiomed.2007.06.026. [DOI] [PubMed] [Google Scholar]
- 20.Zielonka J, Kalyanaraman B. Free Radical Biol Med. 2010;48:983–1001. doi: 10.1016/j.freeradbiomed.2010.01.028. [DOI] [PMC free article] [PubMed] [Google Scholar]
- 21.Anderson AB, Cai Y. J Phys Chem B. 2004;108:19917–19920. [Google Scholar]
- 22.Gagne RR, Koval CA, Lisensky GC. Inorg Chem. 1980;19:2854–2855. [Google Scholar]
- 23.Bao D, Millare B, Xia W, Steyer BG, Gerasimenko AA, Ferreira A, Contreras A, Vullev VI. J Phys Chem A. 2009;113:1259–1267. doi: 10.1021/jp809105f. [DOI] [PubMed] [Google Scholar]
- 24.Selmeczy AD, Jones WD. Inorg Chim Acta. 2000;300:138–150. [Google Scholar]
- 25.Plattner JJ, Gless RD, Rapoport H. J Am Chem Soc. 1972;94:8613. doi: 10.1021/ja00779a072. [DOI] [PubMed] [Google Scholar]
- 26.Eruslanov E, Kusmartsev S. In: Advanced Protocols in Oxidative Stress II. Armstrong D, editor. Vol. 594. Humana Press; 2010. pp. 57–72. ch. 4. [Google Scholar]
- 27.Vowells SJ, Sekhsaria S, Malech HL, Shalit M, Fleisher TA. J Immunol Methods. 1995;178:89–97. doi: 10.1016/0022-1759(94)00247-t. [DOI] [PubMed] [Google Scholar]
- 28.Robinson KM, Janes MS, Pehar M, Monette JS, Ross MF, Hagen TM, Murphy MP, Beckman JS. Proc Natl Acad Sci USA. 2006;103:15038–15043. doi: 10.1073/pnas.0601945103. [DOI] [PMC free article] [PubMed] [Google Scholar]
- 29.Rothe G, Valet G. J Leukocyte Biol. 1990;47:440–448. [PubMed] [Google Scholar]
- 30.Zielonka J, Vasquez-Vivar J, Kalyanaraman B. Nat Protoc. 2008;3:8–21. doi: 10.1038/nprot.2007.473. [DOI] [PubMed] [Google Scholar]
- 31.Wilhelm J, Vytasek R, Ostadalova I, Vajner L. Mol Cell Biochem. 2009;328:167–176. doi: 10.1007/s11010-009-0086-5. [DOI] [PubMed] [Google Scholar]
- 32.Rota C, Fann YC, Mason RP. J Biol Chem. 1999;274:28161–28168. doi: 10.1074/jbc.274.40.28161. [DOI] [PubMed] [Google Scholar]
- 33.Lei C, Hu D, Ackerman EJ. Chem Commun (Camb) 2008:5490–5492. doi: 10.1039/b812161c. [DOI] [PubMed] [Google Scholar]
- 34.Miomandre F, Allain C, Clavier G, Audibert JF, Pansu RB, Audebert P, Hartl F. Electrochem Commun. 2011;13:574–577. [Google Scholar]
- 35.McLeod CW, West TS. Analyst. 1982;107:1–11. [Google Scholar]
- 36.Koppenol WH, Stanbury DM, Bounds PL. Free Radical Biol Med. 2010;49:317–322. doi: 10.1016/j.freeradbiomed.2010.04.011. [DOI] [PubMed] [Google Scholar]
- 37.Koppenol WH, Moreno JJ, Pryor WA, Ischiropoulos H, Beckman JS. Chem Res Toxicol. 1992;5:834–842. doi: 10.1021/tx00030a017. [DOI] [PubMed] [Google Scholar]
- 38.Augusto O, Bonini MG, Amanso AM, Linares E, Santos CC, De Menezes SL. Free Radical Biol Med. 2002;32:841–859. doi: 10.1016/s0891-5849(02)00786-4. [DOI] [PubMed] [Google Scholar]
- 39.Henderson LM, Chappell JB. Eur J Biochem. 1993;217:973–980. doi: 10.1111/j.1432-1033.1993.tb18328.x. [DOI] [PubMed] [Google Scholar]
Associated Data
This section collects any data citations, data availability statements, or supplementary materials included in this article.


