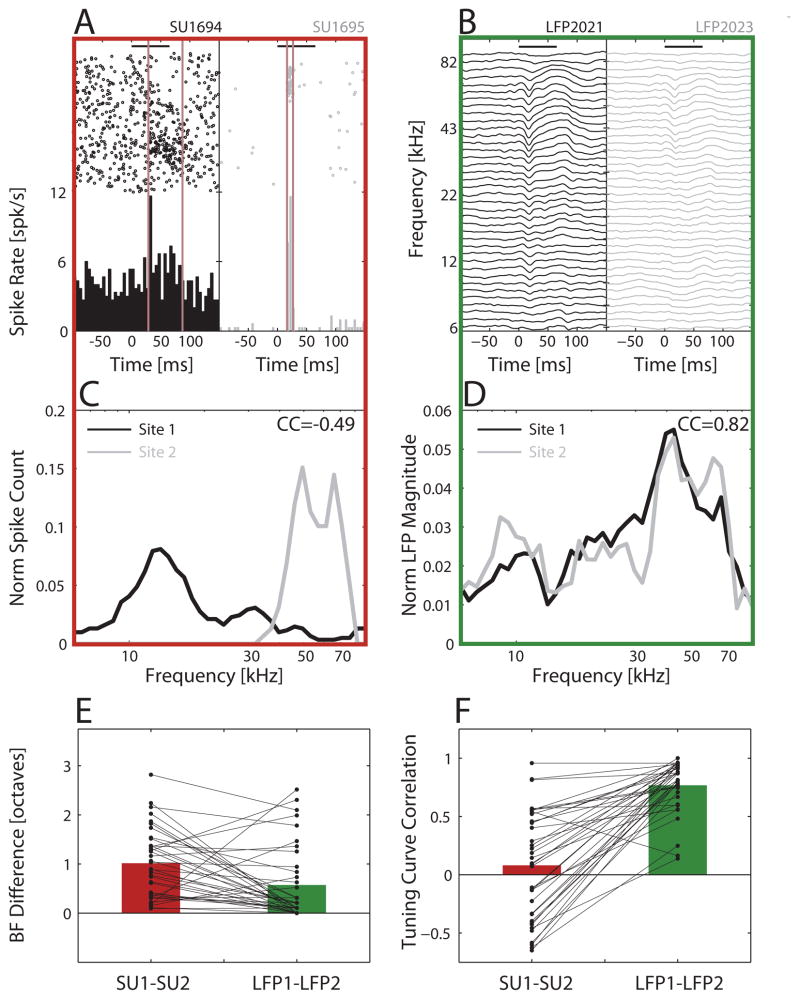
Figure 2.
Validating LFP over SU to characterize frequency tuning in a cortical penetration. SU frequency responses from the same recording penetration were more variable compared to co-localized LFPs. (A) Raster responses (tone trials ordered low to high frequency from bottom to top) and PSTHs for SUs at two sites in one example penetration, recorded at depths of 483 um (SU 1694) and 584 um (SU 1695). (B) Average pure tone LFP responses (smoothed with nearest neighbor frequencies) co-recorded with the SUs: LFP 2021 with SU 1694, and LFP 2023 with SU 1695. Horizontal black bars indicate start and duration of the tones in (A) and (B). (C) Tuning curves for SU 1694 (black) and SU 1695 (gray), based on counting spikes between the vertical brown lines in (A), when responses deviated from spontaneous activity. Tuning curves were normalized to an area of one. (D) Corresponding tuning curves for LFP 2021 (black) and LFP 2023 (gray), based on the peak negative deflection within 70 ms of tone onset, and normalized to a tuning curve area of one. Correlation coefficients (CC) for the tuning curves of the example SU and LFP pairs are shown in the upper right corners of (C) and (D). (E) BF difference in octaves, log2(BF1/BF2), computed between all pairs of SU or co-recorded LFP recordings (37 pairs, average depth difference between pairs of 121.1 um ± 94.2 um standard deviation). (F) CC, computed between all pairs of SU or co-recorded LFP recordings. In both (E) and (F), bars indicate means for SUs (red) and LFPs (green), and connected dots link values for co-recorded pairs of SUs and LFPs. LFPs from the same penetration generally had much closer BFs (E) and more similar tuning curves (F) compared to SUs in the same penetration.

