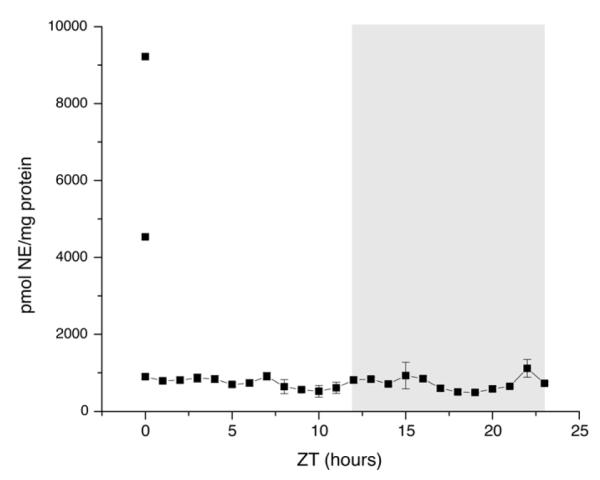
Figure 3.

NE time course. Lights are turned on at ZT0 and turned off at ZT12. Dark phase is indicated by gray bar. Points connected by the line are plotted as mean +/− standard error of the mean. The two points not connected by the line are the two outliers at ZT0. n= 5-7 animals per time point. Measured NE is reported as picomoles of NE per milligram of protein.
