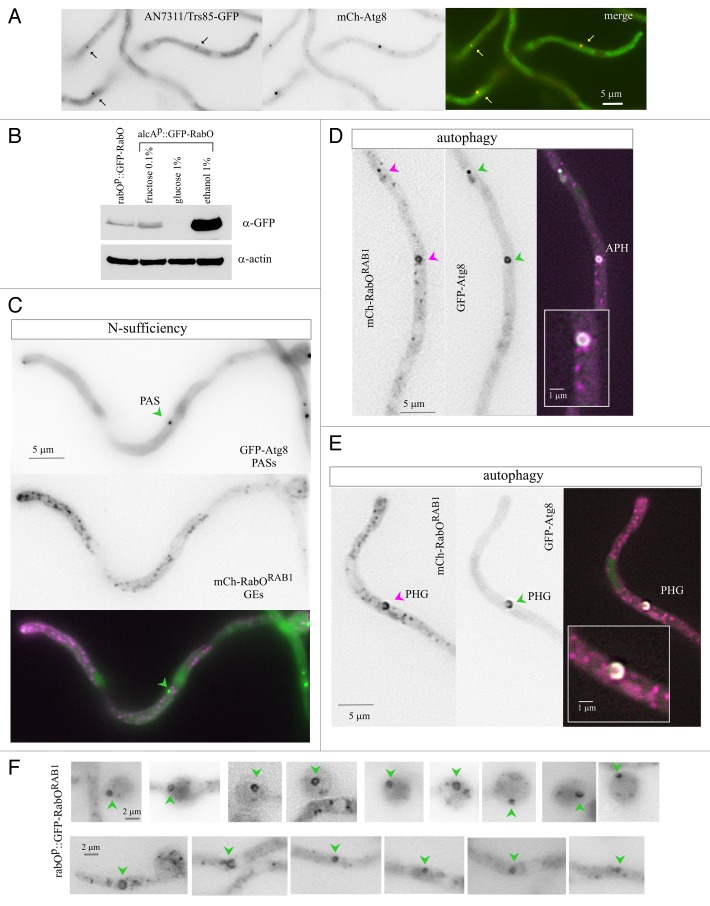
Figure 8. Localization of RabORAB1 to autophagosomes. (A) AN7311/Trs85-GFP, expressed at physiological levels from an endogenously tagged allele, localizes to cytosolic puncta that also contain mCherry-Atg8. (B) Western blot analysis of GFP-RabORAB1 levels driven by the rabOp and the alcAp promoters. In the latter case, glucose represses the promoter, ethanol at 1% induces it, and fructose at 0.1% leads to basal levels of expression, which are similar to those driven by rabOp. Anti-actin western blotting of the same samples was used as a loading control. (C) Strain co-expressing mCherry-RabORAB1 and GFP-Atg8. In nitrogen-fed cells cultured with 0.1% fructose as carbon source, mCherry-RabORAB1, expressed at approximately physiological levels under the control of the alcAp driver, localizes to polarized Golgi cisternae. Images in (C–E) display the mCherry and GFP single channel images in inverted contrast, as indicated, and the “merge” of the two channels in color. In the “merge” images, the mCherry signal is shown in magenta, whereas the GFP signal is shown in green. Regions of signal overlap are white. (D) Localization of mCherry-RabORAB1 to cytosolic puncta and autophagosomes (APH) containing GFP-Atg8 in cells cultured under autophagy-inducing conditions. (E) Example of colocalization of mCherry-RabORAB1 and GFP-Atg8 in an expanding cup-shaped phagophore (PHG). For (D and E) the insets shown are at double magnification. (F) Several examples of autophagic structures labeled with GFP-RabORAB1, expressed at physiological levels under the control of the rabO promoter; cells were incubated in autophagy conditions. Autophagosomes are marked with a green arrowhead.

An official website of the United States government
Here's how you know
Official websites use .gov
A
.gov website belongs to an official
government organization in the United States.
Secure .gov websites use HTTPS
A lock (
) or https:// means you've safely
connected to the .gov website. Share sensitive
information only on official, secure websites.
