

Abstract
Eleven patients being evaluated with intracranial electroencephalography for medically resistant temporal lobe epilepsy participated in a visual recognition memory task. Interictal epileptiform spikes were manually marked and their rate of occurrence compared between baseline and three 2 s periods spanning a 6 s viewing period. During successful, but not unsuccessful, encoding of the images there was a significant reduction in interictal epileptiform spike rate in the amygdala, hippocampus, and temporal cortex. During the earliest encoding period (0–2000 ms after image presentation) in these trials there was a widespread decrease in the power of theta, alpha and beta band local field potential oscillations that coincided with emergent focal gamma frequency activity. Interictal epileptiform spike rate correlated with spectral band power changes and broadband (4–150 Hz) desynchronization, which predicted significant reduction in interictal epileptiform spike rate. Spike-triggered averaging of the field potential power spectrum detected a burst of low frequency synchronization 200 ms before the interictal epileptiform spikes that arose during this period of encoding. We conclude that interictal epileptiform spikes are modulated by the patterns of network oscillatory activity that accompany human memory offering a new mechanistic insight into the interplay of cognitive processing, local field potential dynamics and interictal epileptiform spike generation.
Keywords: interictal epileptiform spikes, epilepsy, memory
Introduction
Interictal epileptiform spikes represent the most accessible physiological signature of epilepsy. Interictal epileptiform spikes, which are generated by a synchronized pathological discharge of a large population of neurons, should be distinguished from ‘spikes’ resulting from action potentials of single neurons (Buzsaki et al., 2012). The significance of interictal epileptiform spikes in epilepsy is controversial, but several lines of evidence suggest that interictal epileptiform spikes arise from networks that generate seizures. In experimental models of chronic epilepsy, interictal epileptiform spikes appear immediately before the development of seizures (White et al., 2010; Staley et al., 2011). Long-term recordings in patients demonstrate that the rate of interictal epileptiform spikes is higher in the seizure onset zone compared to other brain regions (Asano et al., 2003).
If interictal epileptiform spikes represent the pathological interictal activity of seizure generating networks, then understanding factors that modulate interictal epileptiform spikes may have implications for seizure initiation and control. In addition, interictal epileptiform spikes may disrupt normal physiological function and contribute to cognitive deficits associated with epilepsy (Elger et al., 2004). Many previous studies have sought to prove interictal epileptiform spike-associated cognitive impairment by demonstrating a higher incidence of interictal epileptiform spikes during error compared to correct trials (Aarts et al., 1984; Krauss et al., 1997; Holmes and Lenck-Santini, 2006; Kleen et al., 2010). Cognitive tasks are also known to suppress interictal epileptiform spikes, an effect attributed to arousal or attention (Aarts et al., 1984). A better understanding of the physiological underpinnings of these phenomena might provide insights into the endogenous processes that suppress or activate epileptogenic networks and their impact on cognition.
Intracranial EEG primarily reflects the local field potential generated by synaptic potentials associated with synchronous activity of local neuronal assemblies (Mitzdorf, 1985; Buzsaki et al., 2012). The local field potential spectral power can therefore be used as a measure of local neuronal synchrony to investigate physiological events with high spatiotemporal accuracy. The intracranial EEG has allowed detailed analysis of the rhythmic local field potential patterns underlying memory and motor function (Pfurtscheller and Lopes da Silva, 1999; Fell et al., 2001; Sederberg et al., 2003, 2007; Buzsaki and Draguhn, 2004; Burke et al., 2013). Here we investigate local field potential spectral power dynamics in patients with temporal lobe epilepsy during a visual memory task in an effort to clarify the mechanism by which cognition modulates the rate of interictal epileptiform spikes.
Materials and methods
Subjects
Eleven patients participated in this Mayo Clinic Institutional Review Board approved protocol. All patients gave written informed consent in accordance with Declaration of Helsinki and the Mayo Clinic Institutional Review Board. All patients had medically resistant temporal lobe epilepsy and were evaluated with intracranial EEG as part of their evaluation for epilepsy surgery (Supplementary Table 1). The location of electrodes and duration of monitoring were entirely determined by clinical considerations.
Experimental protocol
Patients were shown images chosen from the International Affective Picture Set on a laptop computer screen (Lang et al., 1997). In this standardized collection of emotionally laden images, a ‘normalized valence’ indicates the pleasantness or unpleasantness of each image as scored by a test population. At the initial presentation (encoding task), images were visible on the screen for 6 s followed by a 2 s blank screen. A prompt then appeared on the screen asking the patient to rate the image on a five-point scale ranging from ‘very unpleasant’ to ‘very pleasant’. A rating key-press triggered 6 s of blank screen. The cycle then repeated itself until 80 images were presented (Fig. 1). Patients were aware that they would be asked to identify these images the following day.
Figure 1.

Schematic diagram of the protocols for image encoding and recognition tasks. Data epochs [baseline, and three post-presentation epochs Period 1 (P1), Period 2 (P2) and Period (P3)] are indicated for one sample image presentation. Green arrow indicates the onset of image presentation. Example images in the figures are not from the International Affective Picture Set.
Twenty-four hours later, patients participated in a second image presentation (recognition task). Images were shown for 6 s followed by a 2 s blank screen. A prompt screen then asked the patient if the image was ‘old’, that is presented in the earlier session or ‘new’, that is, not previously presented. A key-press triggered a second prompt asking the patients to rate their level of certainty in their previous answer on a five-point scale from ‘very certain’ to ‘very uncertain.’ A key press triggered 6 s of blank screen that completed a cycle. During the second presentation the 80 images presented the day before were randomly mixed with 60 new images (Fig. 1).
Trials were categorized as correct if the ‘new’ or ‘old’ judgement was correct. Correct encoding specifies encoding trials resulting in the later successful recognition of the same image. Incorrect encoding refers to encoding trials, which led to unsuccessful recognition of ‘old’ images. Recognition trials were categorized as correct recognition for correct responses to ‘old’ images, and correct rejection for correct responses to ‘new’ images. Errors were categorized as either true misses or false alarms. True misses are defined as images the patient incorrectly identified as not having seen in the encoding task. False alarms are defined as incorrect identification of images as having been seen previously in the encoding task.
Intracranial recordings
Continuous broadband intracranial EEG was recorded from clinical macroelectrodes (depth and subdural electrodes) and microelectrodes (Fig. 2). Microelectrodes consisted of 40 -µm diameter wires arranged in small arrays at the tips of depth electrodes or between their contacts (Worrell et al., 2008). Only one microwire from any array was used to ensure independence of the data. The intracranial EEG (acquired using Neuralynx Inc. Cheetah: 128 channel, DC capable amplifiers, 9000 Hz low-pass filter and sampling at 32 kHz) was filtered (0.1–1000 Hz) and decimated to 5000 Hz (Brinkmann et al., 2009a). A notch filter was used to eliminate 60 Hz line noise.
Figure 2.

Intracranial EEG recorded from mesial temporal lobe with a hybrid depth electrode. Left: Hybrid depth electrode with bundle of eight micro-electrodes exiting the tip (red, labelled B), eight clinical macro-electrodes (blue, labelled contacts 1–4), and nine microelectrodes along the depth shaft (red, labelled S). Right: Eight seconds of data from wake patient. From the top, channels 1–7 (labelled B) are from the microwires extending from the electrode tip, channels 8–11 are from the clinical macroelectrodes (labelled 1–4), and the channels 16–20 are from the shaft microwires. The ovals highlight focal interictal epileptiform discharges that are localized to single channels, and the rectangle highlights a diffuse interictal epileptiform discharges occurring on multiple micro and macroelectrode channels.
Interictal epileptiform spike marking
Continuous intracranial EEG was visually reviewed and the interictal epileptiform spikes and artefacts marked in the recordings spanning the entire duration of the encoding and recognition sessions. Each channel was marked independently using custom software (Brinkmann et al., 2009b). The software allowed the reviewers to toggle between common reference, average reference, and local reference (bipolar montage) viewing to assist in decision-making. Visual identification of interictal epileptiform spikes can never be entirely objective. To minimize subjectivity, reviewers marked sharply contoured events that met the following strict criteria (i) durations of ≤200; (ii) amplitudes >100 µV; (iii) an associated subsequent slow wave that disrupted the ongoing intracranial EEG activity; and (iv) a field distribution consistent with an intracerebral event. These criteria were used for both macro- and microelectrodes. To remove bias related to experimental context, all marking was made blinded to the timing of image presentation and memory task performance. Independently, a board-certified clinical neurophysiologist blinded to all clinical and study information reviewed each marked record along with all surrounding electrodes in the same viewer to determine if the spike was correctly marked and if it displayed field characteristics consistent with a physiological or pathological event. Unmarked events that criteria on expert review were added. Figure 2 demonstrates a typical marked tracing from a depth electrode containing macro- and microelectrodes.
Electrode localization
Patients underwent a MRI brain scan immediately before monitoring and either a high-resolution CT scan or MRI scan after electrode implantation. The two scans (pre-implantation and post-implantation) were co-registered and fitted to a Talairach atlas (Analyze Inc.). We mapped the derived Talairach coordinates to brain structures through the Mayo 3D Brain Atlas within Analyze software. Brodmann areas were derived through the Talairach Daemon (www.talairach.org). Electrodes that localized to the amygdala, hippocampus, parahippocampal cortex, or temporal cortex were selected for the analysis.
Data and statistical analysis
Following marking, the latencies of interictal epileptiform spikes were aligned with image presentation and processed with custom software written in MATLAB (Mathworks). For each trial we divided the data and computed frequency of interictal epileptiform spikes for four data epochs. Baseline was defined as the 2000 ms before image presentation and three post-presentation analysis periods (Period 1 from 0–2000 ms, Period 2 from 2000–4000 ms, Period 3 from 4000–6000 ms) that spanned the entire period of image viewing (Fig. 1).
To assess for the presence of early image processing we computed average evoked response potentials to image presentation (Liu et al., 2009). Field potentials were low pass filtered at 10 Hz and smoothed. The mean absolute deviation from the baseline was computed during the first 500 ms to obtain absolute peak amplitudes.
To determine the effect of image viewing on the interictal epileptiform spike rate we looked for significant changes in the interictal epileptiform spike rate during Period 1 compared with baseline. If a significant change was found, the analysis was carried into Period 2 and Period 3 to judge the duration of the effect. For each electrode, the interictal epileptiform spike rate was calculated from all relevant trials (interictal epileptiform spike rate = total spikes per 2 s period / number of trials × 2 s). We divided primary hypothesis testing into 24 separate comparisons grouping trials by electrode location, trial type, accuracy and error type. Paired comparisons of electrode values were made with a Wilcoxon signed rank test. Bonferroni correction specified that any comparison reach P < 0.002 to achieve significance.
When testing demonstrated a significant change in the interictal epileptiform spike rate during Period 1, electrodes were further subdivided by side of hemispheric dominance (determined by Wada testing), the presence of mesial temporal sclerosis (determined by pathology or MRI), and macro- and microelectrode type and testing was repeated. For the macro–micro comparison, microwire electrodes were matched with adjacent depth electrodes. At least six patients contributed data for every comparison.
To ensure that statistically significant group results were not due to strong effects from one or two subjects, we repeated analyses using data from single patients. The resulting individual P-values were used to calculate a cut-off q-value using a false discovery rate algorithm set at 0.05 (Benjamini and Hochberg, 1995). This cut-off q-value was used to estimate the number of strongly contributing patients in each analysis.
Time frequency spectra were constructed from each group of trials using the Hilbert transform (Canolty et al., 2006). Raw data were recomputed using a common average reference, further filtered at a band pass of 0.1–250 Hz and down-sampled to 1250 Hz. Segments spanning a period from 8000 ms before to 10 000 ms after the image presentation were used. These raw data segments were filtered in steps of 1 Hz with a 1 Hz bandwidth from 1 to 250 Hz. Each stepwise filtered data segment was normalized and then processed through a Hilbert transform algorithm (Mathworks). The absolute value of the resulting complex time series was squared to give a normalized estimate of power at each band step at each data point. Data from the first 2 s and last 2 s of the resulting time series were discarded to eliminate edge effects. Data were plotted as normalized power at each band step versus time. The raw data segment and Hilbert transform for each trial was individually reviewed and those with blink, muscle or technical artefact were rejected.
In order to confirm the findings on Hilbert time-frequency analysis and to better resolve the frequency range changes in local field potential power during task performance we used multi-taper spectral analysis (www.chronux.org) (Bokil et al., 2010). Multi-taper analysis often offers more accurate frequency resolution over the spectrum of network oscillations (van Vugt et al., 2007). The method applies Fast Fourier Transform within a sliding window (1 s wide with 0.01 s steps) to calculate the trial-averaged power of oscillations in the task. Power density is determined using a specified number of tapers to adjust the frequency resolution of the analysis. The spectrograms from the two methods of analysis were compared to ensure that our conclusions were supported by each technique.
To test for significant changes in band spectral power during the viewing period the Hilbert transform was performed with filters set to select the commonly grouped bands: theta (4–8 Hz), alpha (9–12 Hz), beta (13–28 Hz), gamma (29–80 Hz) and high gamma (81–150 Hz). Normalized power was summed for the baseline and viewing time periods to give a measure of integrated power. The mean change in power compared to baseline was calculated for each viewing period by comparing trials or mean values at each electrode using a Wilcoxon sign rank test. The significance level was corrected to P < 0.001 using a Bonferroni correction for the comparison of multiple bands, electrode locations and time periods. Correlation of the change in band power to the change in interictal epileptiform spike rate during Period 1 was performed using Spearman’s rank correlation coefficient with a corrected P < 0.003 for testing of multiple bands and electrode locations.
Spike-triggered averaging of interictal epileptiform spikes was performed for trials of interest. Trials with a single interictal epileptiform spike occurring from 500 ms to 2500 ms after presentation were identified and manually aligned. Time-frequency spectra were performed on the aligned traces.
A simulation experiment was performed to assess the independent effect of interictal epileptiform spikes on the measures of band power in order to confirm that changes found in analyses were not simply related to changes in interictal epileptiform spike rate. For a given condition, trials with single interictal epileptiform spike during the viewing time period (spike trials) were found and matched to the next trial from the same patient that was identical for all parameters except for the absence of spikes (no-spike trial). The interictal epileptiform spike waveform (100 ms before to 200 ms after spike peak latency) was inserted into the no-spike raw data segment at the spike latency (simulation trial) after DC correction and power measures were calculated for all three trial types. From these values the mean power change per spike (simulation trial value minus no-spike trial value) was calculated for each frequency band. The band change and correlation analyses were re-run subtracting these mean power values for every spike occurring during a studied epoch.
Results
Behavioural data
Patients completed 1377 recognition trials and correctly categorized the image as ‘new’ or ‘old’ on 1187 (86.2%) presentations; performance accuracy above chance. Reaction times to recognition judgements were significantly shorter in correct (median = 1.61 s) as compared to error (median = 2.19 s) trials [W(1375) = 1.92 × 10⁵, Z = 4.33, P = 1.48 × 10⁻⁵].
After review, 46 613 trials were included in the analysis of which 16 520 were encoding trials and 30 093 were recognition trials. There were 25 313 epochs in which the recognition judgement was correct (84.1%). The 4780 error epochs were divided between true misses (47.5%) and false alarms (52.5%).
Distribution of electrodes
One hundred and ninety-four electrodes were included for analysis of which 21 were in the amygdala, 58 in the hippocampus, 15 in parahippocampal areas, and 100 in temporal cortex. The parahippocampal electrodes were localized to Brodmann area 28 (entorhinal cortex, n = 4), area 35 (perirhinal cortex, n = 2), and area 36 (fusiform gyrus, n = 9). Temporal electrodes localized to Brodmann area 20 (ventral temporal cortex, n = 24), area 21 (inferior temporal cortex n = 37), area 38 (temporal pole, n = 11), area 22 (superior temporal gyrus, n = 21), and area 37 (occipito-temporal cortex n = 7). Fourteen of the electrodes were hippocampal microwires.
Early evoked responses to image viewing
Evoked responses to image viewing were clearly recorded in 17% of electrodes. The percentage of electrodes displaying evoked responses differed for each anatomical location (amygdala = 19%, hippocampus = 9%, parahippocampal = 80%, temporal cortex = 13%). For the parahippocampal electrodes, there were no significant differences between correct encoding and incorrect encoding for evoked response amplitude or latency. Mean absolute voltage deviation during the first 500 ms did not correlate with interictal epileptiform spike rate during Period 1 at any location.
Changes in interictal epileptiform spike rate during image viewing
During encoding trials, image presentation was associated with significant reductions in the interictal epileptiform spike rate (Table 1). Interictal epileptiform spike rate was reduced in the amygdala, hippocampus and temporal cortex, but only during correct encoding, that is, encoding that resulted in later successful identification of an image as ‘old’. Occasionally, this suppression could be discerned on histograms from single electrodes (Fig. 4 and Supplementary Fig. 1). No significant changes in the interictal epileptiform spike rate were detectable during either correct or error recognition trials following image presentation.
Table 1.
Change in interictal epileptiform spike rate following image presentation
| Electrode Location | n | Median diff | P | W(df) | |
|---|---|---|---|---|---|
| Correct encoding | Amygdala | 19 | −0.033 | 6.10 × 10⁻⁵* | 0(15) |
| Hippocampus | 50 | −0.033 | 5.00 × 10⁻⁶* | 20(32) | |
| Parahippocampal | 34 | −0.020 | 0.003 | 35(22) | |
| Temporal cortex | 87 | −0.014 | 5.45 × 10⁻⁶* | 190(52) | |
| Incorrect encoding | Amygdala | 19 | 0.1 | 0.43 | 15(9) |
| Hippocampus | 48 | −0.033 | 0.054 | 53.5(20) | |
| Parahippocampal | 34 | −0.033 | 0.072 | 12.5(11) | |
| Temporal cortex | 87 | 0.05 | 0.32 | 136.5(26) | |
| Correct recognition | Amygdala | 22 | −0.024 | 0.007 | 16(16) |
| Hippocampus | 51 | 0.010 | 0.60 | 207(30) | |
| Parahippocampal | 35 | −0.0086 | 0.55 | 152(26) | |
| Temporal cortex | 100 | −0.0069 | 0.045 | 531.5 (55) | |
| Correct rejection | Amygdala | 22 | −0.010 | 0.45 | 40(14) |
| Hippocampus | 51 | −0.0096 | 0.42 | 235(33) | |
| Parahippocampal | 35 | −0.0086 | 0.74 | 127(23) | |
| Temporal cortex | 100 | 0.0086 | 0.29 | 368(42) | |
| False alarms | Amygdala | 22 | −0.042 | 0.1 | 10.5(9) |
| Hippocampus | 51 | −0.031 | 0.10 | 11(10) | |
| Parahippocampal | 35 | 0.083 | 0.34 | 8(7) | |
| Temporal cortex | 100 | −0.022 | 0.27 | 83(21) | |
| True misses | Amygdala | 22 | −0.071 | 0.48 | 16(9) |
| Hippocampus | 49 | 0.017 | 0.20 | 43(16) | |
| Parahippocampal | 35 | −0.063 | 0.69 | 85(19) | |
| Temporal cortex | 100 | 0.063 | 0.06 | 37(17) |
Values for Wilcoxon signed rank tests comparing values for interictal epileptiform spike rate (per second) in Period 1 (0–2000 ms after image presentation) to baseline.
n = number of electrodes in comparison; median diff = median difference in interictal epileptiform spike rate (Period 1 minus baseline); W(df) = Wilcoxon Signed Rank Statistic at specified degrees of freedom.
*P < 0.002.
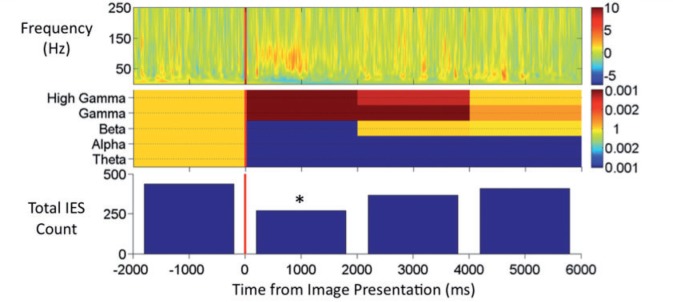
Figure 4.

Top: Multi-taper time-frequency spectrogram from Patient 6 during correct encoding in one hippocampal electrode (Talairach coordinates x = 25.62, y = −16.55, z = −18.94). Power is plotted per the adjacent colour bar in arbitarary units of normalized power. Middle: Instantaneous power plotted for low (4–28 Hz) and high frequency (30–150 Hz) bands showing the reciprocal changes between the two bands in the Period 1 period in this patient. Bottom: Total interictal epileptiform spike (IES) count during 400 ms windows. Total interictal epileptiform spike count declines through Period 1 and returns towards baseline in Period 3. Red dashed line indicates image presentation.
The interictal epileptiform spike rate reduction during correct encoding was most prominent in the temporal cortex where it persisted throughout the viewing periods Period 2 [median difference = −0.013 interictal epileptiform spikes per second, W(54) = 228, P = 9.29 × 10⁻⁶] and Period 3 [median difference = −0.014 interictal epileptiform spikes per second, W(53) = 245.5, P = 3.15 × 10⁻⁵]. In the amygdala, interictal epileptiform spike rate reduction persisted in Period 2 [median difference = −0.02 interictal epileptiform spikes per second, W(15) = 15, P = 9.29 × 10⁻⁴] and in the hippocampus it was present only in Period 1.
In the temporal cortex, interictal epileptiform spike suppression during correct encoding of visual images in Period 1 demonstrated a differential pattern. The effect was more prominent in non-dominant [median difference = −0.082 interictal epileptiform spikes per second, W = 2(20), P = 0.0001] as opposed to dominant cortex (not significant) and in cortex overlying a normal [median difference = −0.017 interictal epileptiform spikes per second, W = 147.5(46), P = 1.73 × 10⁻⁵] as opposed to MTS-affected (not significant) hippocampus. During encoding, interictal epileptiform spike rate in the temporal cortex was significantly related to the subject’s later certainty of response [χ2 = (2, 6857) = 21.8, P = 2.65 × 10⁻⁵] and the normalized valence of the image (rho = 0.032, P = 0.009).
Adjacent hippocampal micro- and macroelectrodes were compared for 100 consecutive interictal epileptiform spikes gathered equally from each electrode pair. When interictal epileptiform spikes were marked simultaneously in micro- and macroelectrodes, the interictal epileptiform spike amplitude in the macroelectrode was significantly greater than the microelectrode [W(73) = 135, P = 5.6 × 10⁻¹¹, 360.7 ± 136 µV versus 224.8 ± 195 µV]. There was no significant difference in duration of interictal epileptiform spikes (83.0 ± 29.7 versus 72.5 ± 27.0 ms) and interictal epileptiform spike morphology appeared similar (Fig. 2). Interictal epileptiform spikes were detected on the microelectrode channels alone 25% of the times, and on the macroelectrode channels alone in only 1% of samples, confirming a more sensitive measurement provided by the former. Comparing all trials, interictal epileptiform spikes were more frequent in microelectrode as compared to adjacent macroelectrodes [median difference = +0.50 interictal epileptiform spikes per second, W(993) = 1.83 × 10⁵, P = 8.68 × 10⁻¹³]. However, during correct encoding a significant reduction in the interictal epileptiform spike rate during Period 1 was detectable in the macroelectrodes [median difference = −0.04 interictal epileptiform spikes per second, W = 0(14), P = 1.96 × 10⁻⁴], but not the microelectrodes.
Analysis of the individual subject comparisons using false discovery rate analysis demonstrated that the results found during correct encoding were due to contributing effects from several patients. For the 30 comparisons of individual subjects during correct encoding in the amygdala, hippocampus and temporal cortex a q-value of 0.021 was computed. Six subjects had at least one comparison below this q-value and one other had a value trending near this cut-off. These six subjects had higher overall spike rates than those without a comparison below the cut-off [W(10) = 16, P = 0.009]. The two groups did not differ in accuracy during the task.
Physiological accompaniments of interictal epileptiform spike rate reduction during correct encoding
Time-frequency spectrograms during correct encoding demonstrate loss of power in the theta, alpha, and beta bands during Period 1 accompanied by a burst of increased gamma and high gamma power beginning shortly after image presentation (Fig. 3). These spectral power changes became less pronounced by 1000 ms after presentation, but could persist to a lesser degree throughout Period 1, Period 2 and Period 3. This spectral pattern could be seen in individual patient data and was similar by both Hilbert and multi-taper spectral analysis (Figs 3 and 4). This pattern was significant in the amygdala, hippocampus and temporal cortex during Period 1 when comparison was made trial × trial (Table 2). When the comparisons were made electrode × electrode the reductions in power in the theta, alpha, and beta bands were confirmed, but there was no significant increase in gamma or high gamma power (Fig. 5B). Through Periods 2 and 3, the power reduction in the theta, alpha, beta bands became less consistent and the increase in integrated gamma and high gamma power largely disappeared. However, in the temporal cortex where interictal epileptiform spike rate was reduced through Periods 2 and 3, there was highly significant power loss in the theta, alpha, and beta bands through these later viewing periods.
Figure 3.
Top: Hilbert time-frequency spectrogram of correct encoding trials from all hippocampal electrodes. Power is plotted per the adjacent colour bar in arbitrary units of normalized power. Middle: Probability values for the change in integrated power during the viewing periods, Periods 1, 2, and 3 for each of the five tested frequency bands. Colour bar indicates the probability value with values for significance of power reduction towards blue and values for significance of power increase towards red. Bottom: Total interictal epileptiform spikes (IES) counted during the time period. *Significant reduction in interictal epileptiform spikes frequency compared with baseline at P < 0.002.
Table 2.
Changes in band power following image presentation during correct encoding trials
| Correct encoding | Theta | Alpha | Beta | Gamma | High gamma | |
|---|---|---|---|---|---|---|
| (4–8 Hz) | (9–12 Hz) | (13–30 Hz) | (31–80 Hz) | (81–150 Hz) | ||
| Period 1 (0–2000 ms) | Amygdala df(1234) | −332* | −522* | −362* | 161* | 274* |
| W = 3.1 × 10⁵ | W = 2.8 × 10⁵ | W = 3.1 × 10⁵ | W = 3.4 × 10⁵ | W = 2.8 × 10⁵ | ||
| P = 1.8 × 10⁻⁷ | P = 8.0 × 10⁻¹⁷ | P = 7.8 × 10⁻⁷ | P = 7.8 × 10⁻⁴ | P = 2.1 × 10⁻¹⁵ | ||
| Hippocampus df(2828) | −895* | −771* | −192* | 131* | 160* | |
| W = 1.3 × 10⁶ | W = 1.3 × 10⁶ | W = 1.7 × 10⁶ | W = 1.8 × 10⁶ | W = 1.7 × 10⁶ | ||
| P = 3.3 × 10−62 | P = 4.5 × 10−59 | P = 1.7 × 10⁻¹⁴ | P = 1.7 × 10⁻⁴ | P = 7.5 × 10⁻⁹ | ||
| Temporal cortex df(5797) | −836* | −428* | −307* | 139* | 152* | |
| W = 5.8 × 10⁶ | W = 6.8 × 10⁶ | W = 7.1 × 10⁶ | W = 7.7 × 10⁶ | W = 7.2 × 10⁶ | ||
| P = 2.2 × 10−93 | P = 3.2 × 10⁻³⁵ | P = 9.1 × 10⁻²⁶ | P = 7.5 × 10⁻⁸ | P = 8.4 × 10⁻²³ | ||
| Period 2 (2000–4000 ms) | Amygdala df(1234) | −379* | −187* | −21 | 61 | 116 |
| W = 3.2 × 10⁵ | W = 3.3 × 10⁵ | W = 3.5 × 10⁵ | W = 3.7 × 10⁵ | W = 3.4 × 10⁵ | ||
| P = 5.8 × 10⁻⁷ | P = 5.6 × 10⁻⁵ | P = 9.2 × 10⁻³ | P = 5.1 × 10⁻¹ | P = 1.3 × 10⁻³ | ||
| Hippocampus df(2828) | −416* | −312* | 19 | 131* | 83 | |
| W = 1.7 × 10⁶ | W = 1.8 × 10⁶ | W = 2.0 × 10⁶ | W = 1.8 × 10⁶ | W = 1.9 × 10⁶ | ||
| P = 3.1 × 10⁻¹³ | P = 7.1 × 10⁻⁶ | P = 4.1 × 10⁻¹ | P = 1.6 × 10⁻⁷ | P = 1.3 × 10⁻³ | ||
| Temporal cortex df(5797) | −693* | −444* | −236* | −10 | 33 | |
| W = 6.4 × 10⁶ | W = 6.9 × 10⁶ | W = 7.1 × 10⁶ | W = 8.1 × 10⁶ | W = 8.3 × 10⁶ | ||
| P = 1.0 × 10−55 | P = 2.0 × 10⁻³³ | P = 7.2 × 10⁻²³ | P = 6.5 × 10⁻³ | P = 3.8 × 10⁻¹ | ||
| Period 3 (4000–6000 ms) | Amygdala df(1234) | −369* | −10 | 32 | 95 | 108 |
| W = 3.3 × 10⁵ | W = 3.6 × 10⁵ | W = 3.8 × 10⁵ | W = 3.5 × 10⁵ | W = 3.4 × 10⁵ | ||
| P = 1.1 × 10⁻⁵ | P = 8.3 × 10⁻² | P = 6.5 × 10⁻¹ | P = 2.2 × 10⁻² | P = 1.5 × 10⁻³ | ||
| Hippocampus df(2828) | −462* | −311* | −47 | 78 | 38 | |
| W = 61.7 × 10⁶ | W = 1.8 × 10⁶ | W = 2.0 × 10⁶ | W = 1.9 × 10⁶ | W = 2.0 × 10⁶ | ||
| P = 2.8 × 10⁻¹² | P = 1.5 × 10⁻⁶ | P = 6.6 × 10⁻¹ | P = 5.5 × 10⁻³ | P = 8.1 × 10⁻¹ | ||
| Temporal cortex df(5797) | −539* | −395* | −255* | −15 | 3 | |
| W = 6.9 × 10⁶ | W = 7.2 × 10⁶ | W = 7.4 × 10⁶ | W = 8.1 × 10⁶ | W = 8.3 × 10⁶ | ||
| P = 4.5 × 10⁻³³ | P = 1.5 × 10⁻²¹ | P = 1.7 × 10⁻¹⁶ | P = 1.8 × 10⁻² | P = 6.7 × 10⁻¹ |
Values indicate the change in band power comparing the period indicated to baseline in arbitrary units of normalized, integrated band power.
df = degrees of freedom, W = Signed Rank Statistic.
*P < 1.0 × 10⁻³.
Figure 5.

Interictal epileptiform spike (IES) rate and band power changes. (A) Values for each of the 155 individual electrodes are plotted showing the relationship of change in interictal epileptiform spike rate during Period 1 to change in band power during Period 1 for the theta, alpha, beta, gamma, and high gamma frequency bands. ρ = Spearman rank correlation coefficient. **P-value < 0.003. (B) Change in interictal epileptiform spike rate and band power computed at for all 155 electrodes during correct encoding comparing Period 1 to baseline. *P-value < 0.001, θ = normalized theta band power, α = normalized alpha band power, β = normalized beta band power, γ = normalized gamma band power, and hγ = normalized high gamma band power. (C) Relationship of high (30–150 Hz) and low (4–28 Hz) band power changes in all 155 electrodes during Period 1 of correct encoding trials. Interictal epileptiform spike rate is reduced in electrodes plotted with black circles and maintained or increased in electrodes plotted with orange circles.
We compared band power values during the correct encoding periods displaying the interictal epileptiform spike rate reduction to values from the same electrodes and periods during incorrect encoding. As expected, the correct encoding periods displayed a significant difference in interictal epileptiform spike rate [median difference = −0.012 interictal epileptiform spikes per second, W(222) = 7583, P = 5.6 × 10⁻⁷]. During correct encoding compared with incorrect encoding trials there was a greater reduction in theta [median difference = −470, W(346) = 2.0 × 10⁴, P = 9.9 × 10⁻⁸] and beta [median difference = −271, W(346) = 2.1 × 10⁴, P = 2.7 × 10⁻⁶] normalized power and a lesser increase in gamma [median difference = −278, W(346) = 1.9 × 10⁴, P = 3.3 × 10⁻⁹] normalized power. Alpha [median difference = −87, W(346) = 2.7 × 10⁴, P = 0.07] and high gamma [median difference = −89, W(346) = 2.6 × 10⁴, P = 0.04] power differences did not reach significance at the corrected P-value of 0.01.
During correct encoding, interictal epileptiform spike rate and spectral band power displayed strong, positive correlation at all three structure locations and in multiple frequency bands (Table 3). The most significant correlations were seen in the temporal neocortex and within the alpha, beta and gamma bands at all locations.
Table 3.
Correlation of band power and interictal epileptiform spike rate during correct encoding trials
| Location | Theta | Alpha | Beta | Gamma | High gamma | ||
|---|---|---|---|---|---|---|---|
| (4–8 Hz) | (9–12 Hz) | (13–30 Hz) | (31–80 Hz) | (81–150 Hz) | |||
| Correct encoding | Amygdala | rho | 0.55 | 0.68 | 0.71 | 0.74 | 0.59 |
| (n = 19) | P | 1.2 × 10⁻² | 1.3 × 10⁻³* | 5.3 × 10⁻⁴* | 3.3 × 10⁻⁴* | 8.3 × 10⁻³ | |
| Hippocampus | rho | 0.39 | 0.45 | 0.54 | 0.47 | 0.31 | |
| (n = 49) | P | 5.0 × 10⁻³ | 1.2 × 10⁻³* | 6.7 × 10⁻⁵* | 6.4 × 10⁻⁴* | 2.9 × 10⁻² | |
| Temporal cortex | rho | 0.53 | 0.58 | 0.66 | 0.53 | 0.45 | |
| (n = 87) | P | 1.7 × 10⁻⁷* | 5.7 × 10⁻⁹* | 5.3 × 10⁻¹²* | 1.6 × 10⁻⁷* | 1.1 × 10⁻⁵* |
Values indicate the results of Spearman rank correlation tests between the integrated band power changes during Period 1 compared with baseline and the change in interictal epileptiform spike rate during Period 1 compared with baseline.
*P < 2.0 × 10⁻³.
Gamma and high gamma power increase during correct encoding in Period 1 were positively correlated with the interictal epileptiform spike rate. Yet, there was a reduction in the interictal epileptiform spike rate during the same period. We sought an explanation for this apparent paradox in the values for individual electrodes. Changes in the high frequency (30–150 Hz) bands during Period 1 were diverse with increases in power in 46% of electrodes. The increase in high frequency power appears to be spatially specific. We mapped the power changes during Period 1 in one patient with a large right temporal grid and found widespread low frequency (4–28 Hz) band power reduction. High gamma power was reduced in most electrodes, but increased in a focal area of the anterior temporal lobe (Fig. 6). When electrodes from all three locations were analysed together there were significant positive correlations between the interictal epileptiform spike rate and power at every frequency band (Fig. 5A). However, in the gamma and high gamma frequencies correlation appeared non-linear; a reduction in power was associated with prominent interictal epileptiform spike rate reduction whereas increases in power were accompanied by only a maintenance or mild increase in the interictal epileptiform spike rate. As a cumulative effect of these correlation curves, low and high frequency bands appear to interact in modulating the interictal epileptiform spike rate (Fig. 5C). Most electrodes (87%) display low frequency power reduction during Period 1. If low frequency power loss is accompanied by loss of high frequency power then interictal epileptiform spike rate is likely to be reduced. In the presence of increases in high frequency power, interictal epileptiform spike rate is more likely to be mildly increased or maintained at the baseline rate. During incorrect encoding a lower proportion of electrodes demonstrated low frequency power loss (74%) and a higher proportion high frequency power increase (54%) explaining the higher interictal epileptiform spike rate during these trials compared with those during correct encoding.
Figure 6.

Three dimensional map from Patient 10 showing the net change in (i) low frequency (4–28 Hz); and (ii) high gamma (81–150 Hz) normalized integrated power between Period 1 and baseline periods. The low frequency range shows widespread marked suppression of power, while the high gamma power shows moderate to profound suppression in most areas with increased focal high gamma power along the anterior temporal lobe.
Network oscillations associated with interictal epileptiform spike generation
Interictal epileptiform spikes were selected from trials of correct encoding during Period 1 and early Period 2 with latencies that ensured that the 500 ms before the interictal epileptiform spike peak were contained in Period 1. The averaged time frequency spectrogram of 85 selected interictal epileptiform spikes aligned to the voltage peak reveals that interictal epileptiform spikes during Period 1 typically occur within a background of low power in the theta, alpha and beta bands and relatively higher power in the gamma and high gamma bands (Fig. 7). The spectrogram shows a consistent burst of power in the theta, alpha and beta bands, and a brief increase in high gamma power preceding interictal epileptiform spike occurrence by ∼200 ms, suggesting a causal relationship between network oscillations and the mechanisms of interictal epileptiform spike generation.
Figure 7.

Spike triggered average during correct encoding. Top: Spike centred average of raw normalized voltage of 85 selected interictal epileptiform spikes (IES). Dotted line indicates the time corresponding to the point of manual spike alignment. Shaded are corresponds to ±1 standard error of mean. Bottom: Hilbert time-frequency spectrogram of all interictal epileptiform spikes in the spike centred average. Power is plotted per the adjacent colour bar in arbitrary units of normalized power. White box indicates a burst of low frequency power preceding the averaged interictal epileptiform spikes by 200 ms.
Simulation
Simulation experiments demonstrated that interictal epileptiform spikes resulted in increases in power most marked in the theta, alpha and beta bands. The spectral effect of interictal epileptiform spikes on gamma and high gamma power values was less prominent. The mean change in normalized power per 2 s for each band was theta = 250, alpha = 271, beta = 331, gamma = 128, high gamma = 20. When all analyses were recomputed adjusting for the power changes caused by spikes, only three results changed. In the amygdala, the reduction in beta power during Period 1 lost statistical significance [median difference = −90, W(1234) = 3.5 × 10⁵, P = 0.005] and the correlation between theta (rho = 0.54, P = 4.9 × 10⁻⁴) and high gamma (rho = 0.59, P = 1.1 × 10⁻⁴) power and interictal epileptiform spike rate gained statistical significance. All of the remaining 62 analyses remained statistically concordant with the results done without spike simulation correction.
Discussion
Cognitive deficits are a significant and common comorbidity of epilepsy (Elger et al., 2004). Although much of the recent interest has focused on how interictal epileptiform spikes might disrupt normal function (Holmes and Lenck-Santini, 2006; Kleen et al., 2010), it has long been recognized that the cognitive tasks also directly affect interictal epileptiform spikes. Early EEG observers described an effect of cognition on interictal epileptiform spikes noting that generalized spike and wave discharges could be terminated by a signal in a reaction time task (Schwab, 1941). Modern era video EEG recordings recognized a complex, reciprocal relationship between interictal epileptiform spikes and cognition (Binnie et al., 1991). During cognitive testing, focal and generalized spikes decreased in 31% and increased in 13% of patients (Aarts et al., 1984). These phenomena have been attributed to changes in arousal, but physiological analysis has been lacking. In this study, we investigated the interplay between interictal epileptiform spike rate, local field potential dynamics, and visual memory performance. We present evidence for interictal epileptiform spike rate reduction during a visual memory task and correlated this phenomenon with changes in network local field potential oscillations.
Significant interictal epileptiform spike rate reduction occurred during successful, but not unsuccessful, encoding of images. This reduction in interictal epileptiform spike rate is likely driven by normal memory processing as (i) it appears in the seconds after visual image presentation; (ii) it is detectable only in trials leading to later memory success; (iii) it is most strongly present in the non-dominant temporal cortex as would be expected for a visual task; (iv) it becomes less prominent in the cortex overlying MTS; and (v) it is consistent with reported functional MRI changes performed during similar tasks. During the successful encoding of images, blood oxygen level-dependent changes have been recorded in the amygdala, hippocampus and temporal cortex (Ramsoy et al., 2009). Activation of the amygdala corresponds to the emotional enhancement of memory (Canli et al., 2000). The phenomenon does not appear to be due to inattention as evoked potentials, which represent the immediate formation of object representations, did not differ between correct and incorrect encoding trials (Liu et al., 2009).
The phenomenon of interictal epileptiform spike rate reduction may be a common accompaniment of cognition. We found statistical evidence for interictal epileptiform spike rate reduction in 6 of 11 patients. At times, the change in rate could be seen in single electrode histograms. Interictal epileptiform spike rate reduction may reflect a widespread feature of cortical processing as a similar phenomenon has been described in primary motor cortex during voluntary movement (Yanagisawa et al., 2009). However, the absence of interictal epileptiform spike rate reduction during the cognitive process of recognition in our task requires explanation. We propose that our task, with its high proportion of successful memory judgements, places the greatest demands on successful encoding of images. The recognition judgement likely invokes familiarity memory that uses the perirhinal cortex (Diana et al., 2007; Yonelinas et al., 2010). The absence of interictal epileptiform spike rate reduction during recognition in our paradigm could reflect limited electrode coverage of the active perirhinal area and less intense or less prolonged cognitive effort. Measuring interictal epileptiform spikes during more demanding recognition memory tasks could shed light on this question.
Correct encoding was associated with a pattern of reduced theta, alpha, and beta power and increased gamma and high gamma power. The pattern of induced gamma power with low frequency power reduction was first described in studies of scalp and intracranial EEG during visual processing and has since been observed in other sensory, motor or cognitive tasks (Tallon-Baudry et al., 1996; Lachaux et al., 2005). Investigations into the network oscillations underlying normal memory encoding have correlated this pattern with memory success. Synchronization and desynchronization of local neuronal activity are the physiological mechanisms that underlie increases and reductions of local field potential spectral power (Pfurtscheller and Andrew, 1999; Buzsaki et al., 2012). Subsequent memory effects describe significant changes in band spectral power during encoding that predict later successful recognition and are positive or negative based on the direction of the correlation. Scalp EEG studies initially described desynchronization in the alpha band as a predictor of memory encoding success (negative subsequent memory effect) (Klimesch et al., 1996). Intracranial EEG studies have added more detail. Negative subsequent memory effects were found for broadband activity, including theta through gamma frequencies (Fell et al., 2001; Sederberg et al., 2007). Positive subsequent memory effects for synchronization in the theta and high gamma frequency are also reported. The high gamma effect was observed at only 14% electrodes in focal areas including the hippocampus (Sederberg et al., 2003, 2007). These findings echo intracranial EEG studies of simple movement that describe wide spread low frequency desynchronization across the cortex combined with high gamma frequency synchronization that is more discrete and localized to the activated portion of the primary motor cortex (Crone et al., 1998a, b). Recently, a similar pattern has been reported in the temporal lobe during memory encoding of a word recall task (Burke et al., 2013). Broadband desynchronization combined with synchronized and highly localized gamma and high gamma communication lines may be a brain dynamic pattern that minimizes noise and improves information transfer (Fell et al., 2001; Hanslmayr et al., 2012).
Interictal epileptiform spike rate reduction during memory encoding is clearly related to this well-described network oscillatory pattern. Interictal epileptiform spike rate positively correlated with band power across all measured frequencies indicating a strong link between synchronization patterns and interictal epileptiform spikes. This finding confirms and extends the observations during motor tasks reporting a correlation with alpha band power and interictal epileptiform spike rate (Yanagisawa et al., 2009). Consistent with the above model, we recorded widespread theta, alpha and beta power reductions and heterogenous gamma and high gamma power changes during the successful encoding process. Gamma and high gamma power increases were seen in less than one half of recorded electrodes and appeared to occur in small spatial zones. Correct encoding trials with interictal epileptiform spike rate reduction were distinguished from incorrect encoding trials by greater degrees of theta, beta desynchronization and a lesser, more spatially localized, gamma synchronization. When gamma and high gamma desynchronization accompanies broadband low frequency desynchronization, the interictal epileptiform spike rate is reduced. In the areas where gamma and high gamma synchronization occur, interictal epileptiform spike rate remains at baseline or slightly increased levels. Cumulatively, these changes in network oscillatory power predict a reduced interictal epileptiform spike rate.
Spike triggered averaging offers a picture of the oscillatory changes that generate an interictal epileptiform spike during this state of reduced interictal epileptiform spike rate. As expected, these few interictal epileptiform spike events occurred in the background of relatively reduced low-frequency power. The triggering event appeared as a transient burst of synchronization 200 ms before the interictal epileptiform spike, most prominent in the lower frequencies (Fig. 5). The physiological origin of this brief burst of synchronization is not known. Together, these observations suggest that oscillatory changes during correct encoding are causative in suppressing interictal epileptiform spikes.
The precise mechanism by which local field potential desynchronization suppresses interictal epileptiform spikes and synchronization activates interictal epileptiform spikes is unclear. Desynchronization during memory is a poorly understood physiological process. Blood oxygen level-dependent imaging studies suggest that it is an active, energy-utilizing process; however, the structures, neurons and neurotransmitters involved are unknown (Hanslmayr et al., 2011). Interictal epileptiform spike physiology, by contrast, has been elucidated by several elegant studies. Interictal epileptiform spikes arise from sparse, heterogeneous and variable neuronal ensembles that exhibit sensitivity to gamma-aminobutyric acid interneuronal activity (Keller et al., 2010; Sabolek et al., 2012). It is conceivable that desynchronization and synchronization impact the same interneuronal networks and impede or facilitate small neuronal ensembles into larger interictal epileptiform spikes. Our finding that interictal epileptiform spike suppression was more prominent on the spatial scale of macro- (9.3 mm2) than microelectrodes (10−3 mm2) supports this hypothesis (Worrell et al., 2008).
A potential confounding factor in this analysis lies in the possibility that the presence of interictal epileptiform spikes influences band power calculations. Our simulation experiments, however, demonstrated that the changes in band power induced by interictal epileptiform spikes had little impact on our statistical comparisons and no effect that would alter our conclusions.
Many studies have concluded that interictal epileptiform spikes disrupt cognition by demonstrating an increased interictal epileptiform spike rate in cognitive error trials. The relationship between the interictal epileptiform spikes and cognitive processing can now be revisited in light of the effects of local field potential oscillatory changes on interictal epileptiform spike rate. At the very least, the confounding effects of changes in oscillatory power require statistical control. However, if these oscillatory changes are not coincidental—but rather intrinsic to the very process of memory (Buzsaki and Draguhn, 2004)—then unravelling the reciprocal effects of interictal epileptiform spikes and cognition becomes extraordinarily complex. More intense engagement of cognitive processes would be expected to increase network oscillatory changes, which in turn would result in both fewer errors and a lower interictal epileptiform spike rate. Investigations going beyond measurements of interictal epileptiform spike rate may be needed to detect the possible effects of interictal epileptiform spikes on cognitive processes such as memory.
If interictal epileptiform spike rate correlates with the likelihood of seizures, then the modulatory effects described here might be used to advantage in innovative therapies. Stimulation is an emerging therapy for epilepsy and hippocampal stimulation in the high gamma range (130 Hz), mimicking a state of low frequency desynchronization and high frequency synchronization, shows benefit (Boon et al., 2007; Tyrand et al., 2012). Novel stimulation techniques inducing desynchronization across all frequency bands, including gamma and high gamma, might increase efficacy. Further, if the mechanisms of broadband desynchronization in memory can be understood it is conceivable that selective activation of these mechanisms could suppress epileptic networks in real time.
Supplementary Material
Acknowledgements
The authors thank Cindy Nelson and Karla Crockett for technical support and Jay Mandrekar for statistical advice.
Funding
This work was supported by Mayo Clinic and the National Institute of Neurological Disorders and Stroke [R01-NS63039 to GW, R01-NS078136 to SMS)].
Supplementary material
Supplementary material is available at Brain online.
References
- Aarts JH, Binnie CD, Smit AM, Wilkins AJ. Selective cognitive impairment during focal and generalized epileptiform EEG activity. Brain. 1984;107:293–308. doi: 10.1093/brain/107.1.293. [DOI] [PubMed] [Google Scholar]
- Asano E, Muzik O, Shah A, Juhasz C, Chugani DC, Sood S, et al. Quantitative interictal subdural EEG analyses in children with neocortical epilepsy. Epilepsia. 2003;44:425–34. doi: 10.1046/j.1528-1157.2003.38902.x. [DOI] [PubMed] [Google Scholar]
- Benjamini Y, Hochberg Y. Controlling the false discovery rate: a practical and powerful approach to multiple testing. J R Stat Soc Series B Methodol. 1995;57:289–300. [Google Scholar]
- Binnie CD, Channon S, Marston DL. Behavioral correlates of interictal spikes. Adv Neurol. 1991;55:113–26. [PubMed] [Google Scholar]
- Bokil H, Andrews P, Kulkarni JE, Mehta S, Mitra PP. Chronux: a platform for analyzing neural signals. J Neurosci Methods. 2010;192:146–51. doi: 10.1016/j.jneumeth.2010.06.020. [DOI] [PMC free article] [PubMed] [Google Scholar]
- Boon P, Vonck K, De Herdt V, Van Dycke A, Goethals M, Goossens L, et al. Deep brain stimulation in patients with refractory temporal lobe epilepsy. Epilepsia. 2007;48:1551–60. doi: 10.1111/j.1528-1167.2007.01005.x. [DOI] [PubMed] [Google Scholar]
- Brinkmann BH, Bower MR, Stengel KA, Worrell GA, Stead M. Large-scale electrophysiology: acquisition, compression, encryption, and storage of big data. J Neurosci Methods. 2009a;180:185–92. doi: 10.1016/j.jneumeth.2009.03.022. [DOI] [PMC free article] [PubMed] [Google Scholar]
- Brinkmann BH, Bower MR, Stengel KA, Worrell GA, Stead M. Multiscale electrophysiology format: an open-source electrophysiology format using data compression, encryption, and cyclic redundancy check. Conf Proc IEEE Eng Med Biol Soc. 2009b;2009:7083–6. doi: 10.1109/IEMBS.2009.5332915. [DOI] [PMC free article] [PubMed] [Google Scholar]
- Burke JF, Zaghloul KA, Jacobs J, Williams RB, Sperling MR, Sharan AD, et al. Synchronous and asynchronous theta and gamma activity during episodic memory formation. J Neurosci. 2013;33:292–304. doi: 10.1523/JNEUROSCI.2057-12.2013. [DOI] [PMC free article] [PubMed] [Google Scholar]
- Buzsaki G, Anastassiou CA, Koch C. The origin of extracellular fields and currents–EEG, ECoG, LFP and spikes. Nat Rev Neurosci. 2012;13:407–20. doi: 10.1038/nrn3241. [DOI] [PMC free article] [PubMed] [Google Scholar]
- Buzsaki G, Draguhn A. Neuronal oscillations in cortical networks. Science. 2004;304:1926–9. doi: 10.1126/science.1099745. [DOI] [PubMed] [Google Scholar]
- Canli T, Zhao Z, Brewer J, Gabrieli JD, Cahill L. Event-related activation in the human amygdala associates with later memory for individual emotional experience. J Neurosci. 2000;20:1. doi: 10.1523/JNEUROSCI.20-19-j0004.2000. [DOI] [PMC free article] [PubMed] [Google Scholar]
- Canolty RT, Edwards E, Dalal SS, Soltani M, Nagarajan SS, Kirsch HE, et al. High gamma power is phase-locked to theta oscillations in human neocortex. Science. 2006;313:1626–8. doi: 10.1126/science.1128115. [DOI] [PMC free article] [PubMed] [Google Scholar]
- Crone NE, Miglioretti DL, Gordon B, Sieracki JM, Wilson MT, Uematsu S, et al. Functional mapping of human sensorimotor cortex with electrocorticographic spectral analysis. I. Alpha and beta event-related desynchronization. Brain. 1998a;121:2271–99. doi: 10.1093/brain/121.12.2271. [DOI] [PubMed] [Google Scholar]
- Crone NE, Miglioretti DL, Gordon B, Lesser RP. Functional mapping of human sensorimotor cortex with electrocorticographic spectral analysis. II. Event-related synchronization in the gamma band. Brain. 1998b;121:2301–15. doi: 10.1093/brain/121.12.2301. [DOI] [PubMed] [Google Scholar]
- Diana RA, Yonelinas AP, Ranganath C. Imaging recollection and familiarity in the medial temporal lobe: a three-component model. Trends Cogn Sci. 2007;11:379–86. doi: 10.1016/j.tics.2007.08.001. [DOI] [PubMed] [Google Scholar]
- Elger CE, Helmstaedter C, Kurthen M. Chronic epilepsy and cognition. Lancet Neurol. 2004;3:663–72. doi: 10.1016/S1474-4422(04)00906-8. [DOI] [PubMed] [Google Scholar]
- Fell J, Klaver P, Lehnertz K, Grunwald T, Schaller C, Elger CE, et al. Human memory formation is accompanied by rhinal-hippocampal coupling and decoupling. Nat Neurosci. 2001;4:1259–64. doi: 10.1038/nn759. [DOI] [PubMed] [Google Scholar]
- Hanslmayr S, Staudigl T, Fellner MC. Oscillatory power decreases and long-term memory: the information via desynchronization hypothesis. Front Hum Neurosci. 2012;6:74. doi: 10.3389/fnhum.2012.00074. [DOI] [PMC free article] [PubMed] [Google Scholar]
- Hanslmayr S, Volberg G, Wimber M, Raabe M, Greenlee MW, Bauml KH. The relationship between brain oscillations and BOLD signal during memory formation: a combined EEG-fMRI study. J Neurosci. 2011;31:15674–80. doi: 10.1523/JNEUROSCI.3140-11.2011. [DOI] [PMC free article] [PubMed] [Google Scholar]
- Holmes GL, Lenck-Santini PP. Role of interictal epileptiform abnormalities in cognitive impairment. Epilepsy Behav. 2006;8:504–15. doi: 10.1016/j.yebeh.2005.11.014. [DOI] [PubMed] [Google Scholar]
- Keller CJ, Truccolo W, Gale JT, Eskandar E, Thesen T, Carlson C, et al. Heterogeneous neuronal firing patterns during interictal epileptiform discharges in the human cortex. Brain. 2010;133:1668–81. doi: 10.1093/brain/awq112. [DOI] [PMC free article] [PubMed] [Google Scholar]
- Kleen JK, Scott RC, Holmes GL, Lenck-Santini PP. Hippocampal interictal spikes disrupt cognition in rats. Ann Neurol. 2010;67:250–7. doi: 10.1002/ana.21896. [DOI] [PMC free article] [PubMed] [Google Scholar]
- Klimesch W, Schimke H, Doppelmayr M, Ripper B, Schwaiger J, Pfurtscheller G. Event-related desynchronization (ERD) and the Dm effect: does alpha desynchronization during encoding predict later recall performance? Int J Psychophysiol. 1996;24:47–60. doi: 10.1016/s0167-8760(96)00054-2. [DOI] [PubMed] [Google Scholar]
- Krauss GL, Summerfield M, Brandt J, Breiter S, Ruchkin D. Mesial temporal spikes interfere with working memory. Neurology. 1997;49:975–80. doi: 10.1212/wnl.49.4.975. [DOI] [PubMed] [Google Scholar]
- Lachaux J-P, George N, Tallon-Baudry C, Martinerie J, Hugueville L, Minotti L, et al. The many faces of the gamma band response to complex visual stimuli. Neuroimage. 2005;25:491–501. doi: 10.1016/j.neuroimage.2004.11.052. [DOI] [PubMed] [Google Scholar]
- Lang PJ, Bradley MM, Cuthbert BN. International affective picture system (IAPS): technical manual and affective ratings. Gainesville, Florida: University of Florida, NIMH Center for the Study of Emotion and Attention; 1997. [Google Scholar]
- Liu H, Agam Y, Madsen JR, Kreiman G. Timing, timing, timing: fast decoding of object information from intracranial field potentials in human visual cortex. Neuron. 2009;62:281–90. doi: 10.1016/j.neuron.2009.02.025. [DOI] [PMC free article] [PubMed] [Google Scholar]
- Mitzdorf U. Current source-density method and application in cat cerebral cortex: investigation of evoked potentials and EEG phenomena. Physiol Rev. 1985;65:37–100. doi: 10.1152/physrev.1985.65.1.37. [DOI] [PubMed] [Google Scholar]
- Pfurtscheller G, Andrew C. Event-Related changes of band power and coherence: methodology and interpretation. J Clin Neurophysiol. 1999;16:512–9. doi: 10.1097/00004691-199911000-00003. [DOI] [PubMed] [Google Scholar]
- Pfurtscheller G, Lopes da Silva FH. Event-related EEG/MEG synchronization and desynchronization: basic principles. Clin Neurophysiol. 1999;110:1842–57. doi: 10.1016/s1388-2457(99)00141-8. [DOI] [PubMed] [Google Scholar]
- Ramillisecondsoy TZ, Liptrot MG, Skimminge A, Lund TE, Sidaros K, Christensen MS, et al. Regional activation of the human medial temporal lobe during intentional encoding of objects and positions. Neuroimage. 2009;47:1863–72. doi: 10.1016/j.neuroimage.2009.03.082. [DOI] [PubMed] [Google Scholar]
- Sabolek HR, Swiercz WB, Lillis KP, Cash SS, Huberfeld G, Zhao G, et al. A candidate mechanism underlying the variance of interictal spike propagation. J Neurosci. 2012;32:3009–21. doi: 10.1523/JNEUROSCI.5853-11.2012. [DOI] [PMC free article] [PubMed] [Google Scholar]
- Schwab R. The influence of visual and auditory stimuli on the electroencephalographic tracing of petit mal. Am J Psychiatry. 1941;97:1301–12. [Google Scholar]
- Sederberg PB, Kahana MJ, Howard MW, Donner EJ, Madsen JR. Theta and gamma oscillations during encoding predict subsequent recall. J Neurosci. 2003;23:10809–14. doi: 10.1523/JNEUROSCI.23-34-10809.2003. [DOI] [PMC free article] [PubMed] [Google Scholar]
- Sederberg PB, Schulze-Bonhage A, Madsen JR, Bromfield EB, McCarthy DC, Brandt A, et al. Hippocampal and neocortical gamma oscillations predict memory formation in humans. Cereb Cortex. 2007;17:1190–6. doi: 10.1093/cercor/bhl030. [DOI] [PubMed] [Google Scholar]
- Staley KJ, White A, Dudek FE. Interictal spikes: harbingers or causes of epilepsy? Neurosci Lett. 2011;497:247–50. doi: 10.1016/j.neulet.2011.03.070. [DOI] [PMC free article] [PubMed] [Google Scholar]
- Tallon-Baudry C, Bertrand O, Delpuech C, Pernier J. Stimulus specificity of phase-locked and non-phase-locked 40 Hertz visual responses in human. J Neurosci. 1996;16:4240–9. doi: 10.1523/JNEUROSCI.16-13-04240.1996. [DOI] [PMC free article] [PubMed] [Google Scholar]
- Tyrand R, Seeck M, Spinelli L, Pralong E, Vulliemoz S, Foletti G, et al. Effects of amygdala-hippocampal stimulation on interictal epileptic discharges. Epilepsy Res. 2012;99:87–93. doi: 10.1016/j.eplepsyres.2011.10.026. [DOI] [PubMed] [Google Scholar]
- van Vugt MK, Sederberg PB, Kahana MJ. Comparison of spectral analysis methods for characterizing brain oscillations. J Neurosci Methods. 2007;162:49–63. doi: 10.1016/j.jneumeth.2006.12.004. [DOI] [PMC free article] [PubMed] [Google Scholar]
- White A, Williams PA, Hellier JL, Clark S, Edward Dudek F, Staley KJ. EEG spike activity precedes epilepsy after kainate-induced status epilepticus. Epilepsia. 2010;51:371–83. doi: 10.1111/j.1528-1167.2009.02339.x. [DOI] [PMC free article] [PubMed] [Google Scholar]
- Worrell GA, Gardner AB, Stead SM, Hu S, Goerss S, Cascino GJ, et al. High-frequency oscillations in human temporal lobe: simultaneous microwire and clinical macroelectrode recordings. Brain. 2008;131:928–37. doi: 10.1093/brain/awn006. [DOI] [PMC free article] [PubMed] [Google Scholar]
- Yanagisawa T, Hirata M, Kishima H, Goto T, Saitoh Y, Oshino S, et al. Movement induces suppression of interictal spikes in sensorimotor neocortical epilepsy. Epilepsy Res. 2009;87:12–7. doi: 10.1016/j.eplepsyres.2009.07.002. [DOI] [PubMed] [Google Scholar]
- Yonelinas AP, Aly M, Wang WC, Koen JD. Recollection and familiarity: examining controversial assumptions and new directions. Hippocampus. 2010;20:1178–9. doi: 10.1002/hipo.20864. [DOI] [PMC free article] [PubMed] [Google Scholar]
Associated Data
This section collects any data citations, data availability statements, or supplementary materials included in this article.