Abstract
Due to the importance of Mn2+ ions in biological processes, it is of growing interest to develop protocols for analysis of Mn2+ uptake and distribution in cells. A supramolecular metal displacement assay can provide ratiometric fluorescence detection of Mn2+, allowing for quantitative and longitudinal analysis of Mn2+ uptake in living cells.
Manganese functions in both catalytic and structural roles in diverse proteins such as the photosynthetic apparatus and the enzyme superoxide dismutase.1 It plays important roles in gene expression via Mn-binding transcription factors, and metalloregulatory proteins are involved in metal-specific homeostasis.2 Its roles in virulence3 and oxidative stress4 have been reviewed. Additionally, Mn2+ is used widely as a versatile tool for biological studies at the cellular and organ level. Its similarity to calcium and efficient quench of intracellular dyes have facilitated the measurement of ion channel flux.5 The high spin of Mn2+ renders it an excellent MRI contrast agent, the only metal ion other than gadolinium(III) approved for clinical use. Moreover, paramagnetic Mn2+ ions have been shown to accumulate in neural cells by uptake through voltage-gated calcium channels,6 enabling Mn-enhanced MRI (MEMRI) for mapping neural activity in mice.7–9 In light of the wide occurrence and broad utility of Mn2+ in living systems, it is of interest to develop analytical tools for its detection. The goal of this study was to develop an on-fluorescence method for the quantitation of Mn2+ in cells that may eventually be adapted to tissue assays.
Fluorescent probes have proven highly useful for cell biology studies. Chelating dyes such as Quin-2 and Fura-2 have been used to measure Ca2+ in different cellular compartments.10,11 The membrane permeable dye Mag-fura-2 has been used to quantify ER Ca2+ levels.12 Fluctuation of Ca2+ levels associated with cellular transitions have been measured.13 Several available probes developed for Ca2+ are quenched by Mn2+.10 Some on-fluorescence probes for Mn2+ are available (e.g., Calcium Green, Invitrogen), but they generally show poor selectivity, particularly against Ca2+. We are not aware of the availability of ratiometric fluorescent probes for intracellular Mn2+.14,15
Supramolecular strategies for analyte detection have drawn increasing attention for the solution of a variety of detection, quantification, and imaging problems.16 We reported previously a two-metal, two-dye displacement assay to ratiometrically monitor Cu2+ ions in aqueous solution.17 We applied a similar strategy to the development of systems for naked-eye detection of Mn2+.18 Recently, Lippard and coworkers reported an on/off MRI/fluorescence displacement system.19 In this paper, we utilize our metal-displacement assay to visualize Mn2+ concentrations both in solution and in living cells.
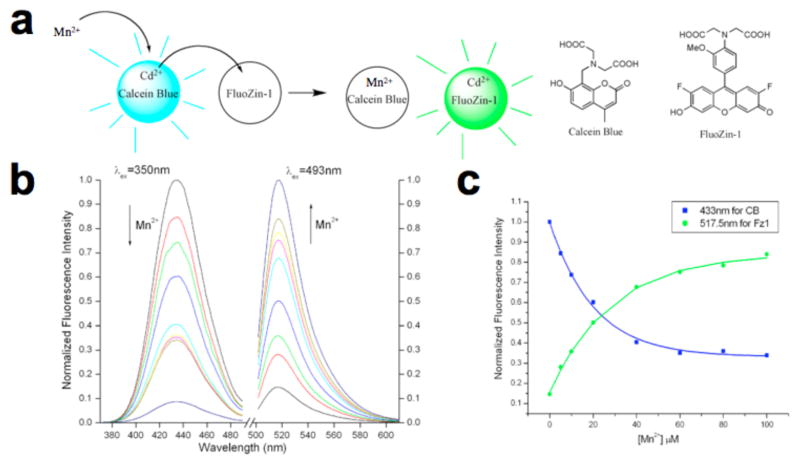
Similarly to the previous method, two commercially available dyes were employed, calcein blue (CB) and fluozin-1 (Fz1). Initially, Cd2+ was chelated by the stronger ligand CB and the formed complex was strongly fluorescent (“on”), while free ligand Fz1 gave weak fluorescence (“off”). Added Mn2+ competes with Cd2+ for CB, and quenches CB. In the new equilibrium state, Cd2+ forms a complex with ligand Fz1 whose fluorescence is consequently turned “on”. Solution experiments indicated that the metal displacement assay was compatible for use with Mn2+. With an equimolar solution of Cd2+, CB, and Fz1, strong blue and weak green fluorescence was observed with excitation at 350 and 493 nm, respectively (Figure 1). As Mn2+ was added, the blue fluorescence diminished and the green fluorescence increased proportionately. Over the concentration range shown, the 433 nm fluorescence was quenched by 12-fold, while that at 518 nm increased by 7-fold. Since complexation of Mn2+ quenched CB and Cd2+ caused Fz1 to show increased fluorescence quantum yield, the observed behavior is consistent with the expectation that Mn2+ competes with Cd2+ for complexation of the stronger chelator (CB), liberating Cd2+ to form a complex with Fz1. Interestingly, a large excess of Mn2+ compared with concentrations of the Cd2+ and the two dye molecules did not result in quenching at 518 nm, indicating that Mn2+ did not compete effectively with Cd2+ for chelation by Fz1 (Figure 1c). This conclusion was supported by a direct competition experiment (Figure S4) in which addition of 10 μM Mn2+, Cd2+ and Fz1 showed only slightly diminished fluorescence compared to Cd2+ and Fz1 alone, implying a strong preference for Cd2+. This is a significant advantage for this system with Mn2+ compared to Cu2+, where excess Cu2+ quenched green fluorescence.
Figure 1.
Reporter metal displacement assay. (a) Reaction scheme. (b) Normalized fluorescence response for the titration of aqueous solution (pH=7.2) containing 10 μM CB, 10 μM Fz1, 10 μM Cd(ClO4)2, 50 mM HEPES and 100 mM KNO3 with 0, 5, 10, 20, 40, 60, 80, 100 and 1000 μM MnCl2. (c) Normalized fluorescence intensity at 433 nm (CB) and 517.5 nm (Fz1), as a function of Mn2+ concentration.
The system was less sensitive to Mn2+ as compared with Cu2+ as a result of the relative binding constants of the chelating dyes with Mn2+ and Cd2+ (5.9 × 10⁶ vs. 7.1 × 10⁷ M−1 for CB). Lower association of Mn2+ compared with Cu2+ would be expected as predicted by the classic Irving-Williams series. Association constants of Mn2+ and Cd2+ were determined by titration; in addition, a direct competition experiment for Mn2+ and Cd2+ for CB indicated a 7.5-fold preference for Cd2+, in contrast to the very strong association of Cu2+.17 Fortunately, with 10 μM concentrations of the two dyes and Cd2+, ratiometric behavior was observed over a range from 5–1000 μM.
Metal ion response screening for the same system was analyzed. A solution containing 10 μM Fz1, 10 μM CB, 10 μM Cd2+, 10 μM metal ion was titrated with 50 μM Mn2+. Na+, Cs+, Mg+2, Li+ did not interfere with fluorescence (Figure S1). The biologically important metal, Zn2+, does compete with Mn2+ and could be a potential source of background fluorescence in certain applications. Fluorescence intensity at 493 nm and at 350 nm was studied at several pH values. In the range of pH from 6.1 to 7.6 (Figure S6), Fz1 response is not dependent on pH, and its fluorescence intensity in both trials is consistent, whereas CB fluorescence intensity increases slightly with pH.
The method was next adapted to detect intracellular Mn2+. We examined the displacement assay approach in Human Embryonic Kidney cells (HEK 293-F, fast growing variant) and an HEK cell line that stably over-expressed Divalent Metal Transporter 1 (DMT-1)20 obtained from the Garrick Laboratory.21 Cell permeable acetoxymethyl (AM) esters of CB and Fz1 (CBAM and Fz1AM) were employed, as these neutral derivatives cross the cell membrane and are then hydrolyzed to cell impermeant CB and Fz1 by intracellular esterases within one hour.22,23 An excess of CBAM compared to Fz1AM, was required as a result of the reduced take-up of CBAM which has only two AM esters as purchased commercially while Fz1AM has three and can therefore cross the cell membrane more easily. In experiments where Mn2+ supplementation was used, cells were first incubated with Mn2+, followed by the two dyes, and finally the Cd2+.
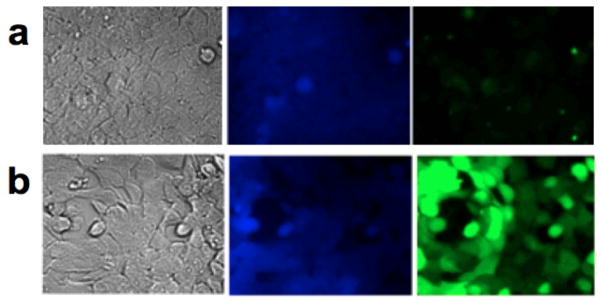
Previous 54Mn2+ uptake experiments performed on HEK cells showed minimal uptake without the expression the metal transport protein DMT-1.21 Supplementation of HEK and DMT-1 cells with 5 μM Mn2+ yielded very little green fluorescence in HEK cells while DMT-1 cells showed strong enhancement of fluorescence in the green channel, and diminished fluorescence in the blue channel (Figure 2). Anticorrelated green and blue fluorescence was heterogeneously distributed within the field of view (Figure S3). The ability of this method to resolve cellular, and potentially subcellular, localization of Mn24–25 promises distinct advantages over other techniques. Control experiments were consistent with the operation of the displacement mechanism. In DMT-1 cells treated with only Fz1AM and Mn2+, absence of Cd2+gave no fluorescent response (Figure S8). Cells treated with only CBAM enhanced with Cd2+ but not Mn2+(Figure S9). Treatment with CBAM and FzAM showed quenched CB with Mn2+ and enhanced CB with Cd2+(Figure S10). These experiments demonstrate that the fluorescence enhancement is well above background, and that Zn2+ does not significantly interfere at the micromolar Mn2+ concentrations examined here..
Figure 2.

HEK and DMT-1 cells treated with: 5 μM Mn2+, 3.6 μM Fz1AM, 26.6 μM CB-AM and 10 μM Cd2+. (a) HEK cells show blue fluorescence but little green fluorescence, suggesting minimal Mn2+ present in the cell. (b) DMT-1 cells under the same conditions show lower blue fluorescence with bright green fluorescence indicative of markedly increased Mn2+ uptake.
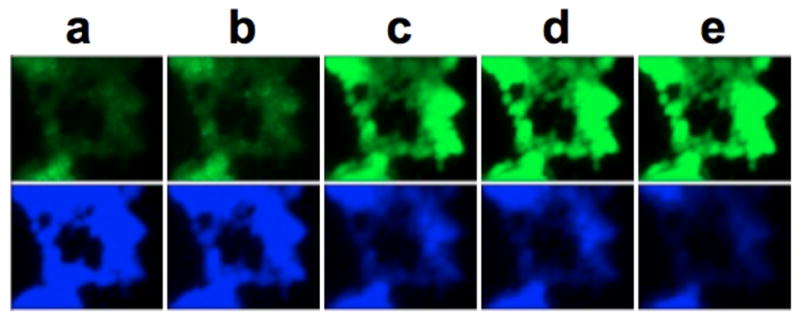
To fully realize the utility of our system for live imaging of cellular Mn2+, real-time uptake of Mn2+ was analysed in the DMT-1 cells (Figure 3). Cells were incubated with the standard amount of CBAM, Fz1AM, and Cd2+. Mn2+ was then added and images were collected every twenty min over a period of 100 min. Fluorescence changes plateaued after 80 min (Figure S11). consistent with 54Mn assays in cell pellets.21 Blue fluorescence from CB correspondingly decreased over the entire time course.
Figure 3.

Uptake of Mn2+ over time monitored using fluorescence. Pictures were taken upon addition of 3.6uM Fz1-AM, 26.6 uM CB-AM, and 10 uM Cd(II) followed by 5 uM Mn2+ at: (a) 20 min (b) 40 min (c) 60 min (d) 80 min and (e)100 min.
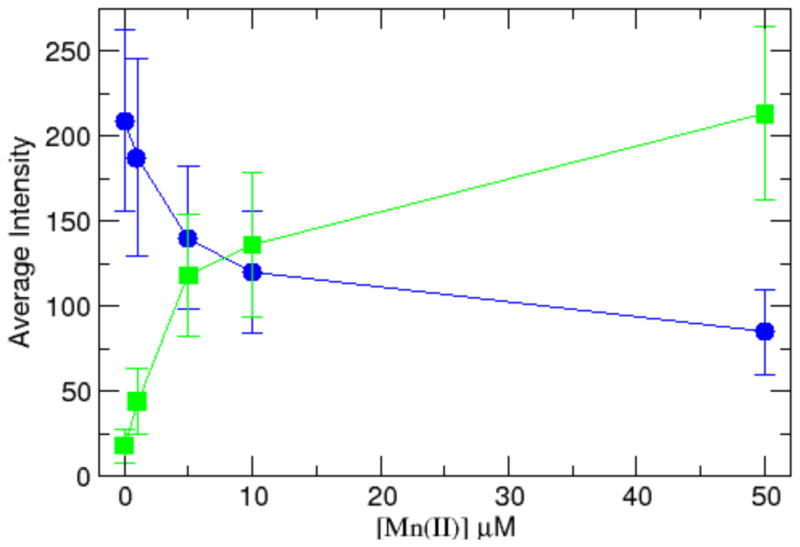
The intracellular supramolecular assay responded quantitatively to varying concentrations of Mn2+ (Figure 4, S12). Blue and green fluorescence intensities shifted over a range of 0–50 mM extracellular Mn2+ in DMT-1 cells. In a multiwell experiment, each concentration of Mn2+ from 0 to 50 μM gave a decrease in blue fluorescence by a factor of 3 and an increase in green fluorescence by a factor of 11, consistent with a saturable system (Figure 4). A double reciprocal plot shows a linear relationship as expected for the DMT1 transporter for both green and blue average fluorescence intensities (Figure S13). These data again fit very well with previous 54Mn2+ uptake experiments.21
Figure 4.

Plot of fluorescent intensities as a function of Mn2+ concentration in DMT-1 cells.
Mn sensitivity was also explored in an additional cell line. The human lung carcinoma A549 cell line26–27 behaved similarly to control HEK cells, giving signal only with high Mn2+ exposure (Figure S14). Transient transfection with a DMT1 expressing plasmid improved sensitivity to Mn2+ by several orders of magnitude in transfected cells (Figures S15). These data suggest that, in multiple cell types, Mn2+ uptake in the cells is a tightly regulated process, which normally allows for very little free intracellular Mn2+ without active uptake by DMT1.
Supramolecular displacement assays have found widespread interest in recent years,16 but there have been few applications demonstrated in a cellular context. There are many challenges to the application of such methods in biological systems, including solubility, cell permeability, potentially variable subcellular localization of components, biocompatibility, orthogonality of the chemistry to intracellular receptors and metals, among others. The present assay requires a metal exchange reaction to occur in living cells and in preference to other potentially competing processes. The Mn2+ ion must find the Cd(CB) complex, undergo an exchange reaction, and the Cd2+ must then find the Fz1 dye to form a complex without the metals being sequestered by endogenous metal receptor sites and without intracellular metal ions blocking access by the Mn2+ or Cd2+. As demonstrated by controls, without delivery of all components at relevant concentrations, no green fluorescence can be observed. Despite these challenges, these experiments were successful in reporting intracellular Mn2+ in two different cell lines, and offers hope that other chemical displacement methods may also be effective in cellular systems.
Although our results presented here represent a significant advance in terms of demonstration of supramolecular displacement and Mn2+ studies in live cells, there are several potential areas for improvement of this method for analysis of Mn2+. Modification of CB with chelating moieties that would provide more selective association of Mn2+ would improve quenching efficiency of the blue dye and would increase sensitivity. Also, linking the two dyes together covalently could guarantee delivery of equivalent concentrations to the cells and simplify the calibration required for quantitative studies.28 Use of a more widely biocompatible reporter ion could permit a wider scope of application.
Supplementary Material
Acknowledgments
Financial support was provided by the National Institutes of Health (GM076202, NS038461). We thank Dr. Laura Garrick at SUNY Buffalo for providing DMT1-expressing HEK cell lines. We are grateful to Xin Yu (NIH/NINDS) for early contributions to this project. We thank Professor Lara Mahal and Tomasz Kurcon for help with the high resolution images.
Footnotes
Electronic Supplementary Information (ESI) available: Data from control experiments and quantitation. See DOI: 10.1039/b000000x/
Supplementary Information available. Additional experimental data including control experiments on A549 and HEK cell lines and statistical analysis.
Notes and references
- 1.Miller AF. FEBS Lett. 2012;586:585. doi: 10.1016/j.febslet.2011.10.048. [DOI] [PMC free article] [PubMed] [Google Scholar]
- 2.Golynskiy MV, Gunderson WA, Hendrich MP, Cohen SM. Biochemistry. 2006;45:15359. doi: 10.1021/bi0607406. [DOI] [PMC free article] [PubMed] [Google Scholar]
- 3.Rivera-Mancia S, Rios C, Montes S. Biometals. 2011;24:811. doi: 10.1007/s10534-011-9454-1. [DOI] [PubMed] [Google Scholar]
- 4.Dobson AW, Aschner M. Manganese-Induced Oxidative Stress. In: Qureshi GA, Parves SH, editors. Oxidative Stress and Neurodegenerative Disorders. Elsevier; Amsterdam: 2007. p. 433. [Google Scholar]
- 5.Munck S, Uhl R, Harz H. Cell Calcium. 2002;31:27. doi: 10.1054/ceca.2001.0253. [DOI] [PubMed] [Google Scholar]
- 6.Lin YJ, Koretsky AP. Magn Reson Med. 1997;38:378. doi: 10.1002/mrm.1910380305. [DOI] [PubMed] [Google Scholar]
- 7.Yu X, Sanes DH, Aristizabal O, Wadghiri YZ, Turnbull DH. Proc Nat Acad Sci USA. 2007;104:12193. doi: 10.1073/pnas.0700960104. [DOI] [PMC free article] [PubMed] [Google Scholar]
- 8.Yu X, Wadghiri YZ, Sanes DH, Turnbull DH. Nat Neurosci. 2005;8:961–968. doi: 10.1038/nn1477. [DOI] [PMC free article] [PubMed] [Google Scholar]
- 9.Inoue T, Majid T, Pautler RG. Rev Neurosci. 2011;22:675–94. doi: 10.1515/RNS.2011.048. [DOI] [PMC free article] [PubMed] [Google Scholar]
- 10.Tsien RY, Pozzan T. Meth Enz. 1972;172:230. doi: 10.1016/s0076-6879(89)72017-6. [DOI] [PubMed] [Google Scholar]
- 11.Kostyuk PG, Mironov SL, Tepikin AV, Belan PV. J Membr Biol. 1989;110:11. [Google Scholar]
- 12.Solovyova N, Verkhratsky A. J Neurosci Meth. 2002;122:1. doi: 10.1016/s0165-0270(02)00300-x. [DOI] [PubMed] [Google Scholar]
- 13.Poenie M, Alderton J, Steinhardt R, Tsien R. Science. 1986;233:886. doi: 10.1126/science.3755550. [DOI] [PubMed] [Google Scholar]
- 14.Grynkiewicz G, Poenie M, Tsien RY. J Biol Chem. 1985;260:3440. [PubMed] [Google Scholar]
- 15.Liang JA, Canary JW. Angew Chem Int Ed Engl. 2010;49:7710. doi: 10.1002/anie.201002853. [DOI] [PMC free article] [PubMed] [Google Scholar]
- 16.Anslyn EV. J Org Chem. 2007;72:687. doi: 10.1021/jo0617971. [DOI] [PubMed] [Google Scholar]
- 17.Royzen M, Dai ZH, Canary JW. J Am Chem Soc. 2005;127:1612. doi: 10.1021/ja0431051. [DOI] [PubMed] [Google Scholar]
- 18.Dai ZD, Khosla KN, Canary JW. Supramol Chem. 2009;21:296. [Google Scholar]
- 19.You Y, Tomat E, Hwang K, Atanasijevic T, Nam W, Jasanoff AP, Lippard SJ. ChemComm. 2010;46:4139–4141. doi: 10.1039/c0cc00179a. [DOI] [PMC free article] [PubMed] [Google Scholar]
- 20.Mackenzie B, Takanaga H, Hubert N, Rolfs A, Hediger MA. Biochem J. 2007;403:59. doi: 10.1042/BJ20061290. [DOI] [PMC free article] [PubMed] [Google Scholar]
- 21.Garrick MD, Kuo HC, Vargas F, Singleton S, Zhao L, Smith JJ, Paradkar P, Roth JA, Garrick LM. Biochem J. 2006;398:539. doi: 10.1042/BJ20051987. [DOI] [PMC free article] [PubMed] [Google Scholar]
- 22.Tsien RY. Nature. 1981;290:527. doi: 10.1038/290527a0. [DOI] [PubMed] [Google Scholar]
- 23.Roe MW, Lemasters JJ, Herman B. Cell Calcium. 1990;11:63. doi: 10.1016/0143-4160(90)90060-8. [DOI] [PubMed] [Google Scholar]
- 24.Carmona A, Devès G, Roudeau S, Cloetens P, Bohic S, Ortega R. ACS Chem Neurosci. 2010;1:194. doi: 10.1021/cn900021z. [DOI] [PMC free article] [PubMed] [Google Scholar]
- 25.Morello M, Canini A, Mattioli P, Sorge RP, Alimonti A, Bocca B, Forte G, Martorana A, Bernardi G, Sancesario G. Neurotoxicology. 2008;29:60. doi: 10.1016/j.neuro.2007.09.001. [DOI] [PubMed] [Google Scholar]
- 26.Zhao J, Chen H, Davidson T, Kluz T, Zhang Q, Costa M. Toxicol Appl Pharmacol. 2004;196:404. doi: 10.1016/j.taap.2004.01.012. [DOI] [PubMed] [Google Scholar]
- 27.Kang YJ, Nuutero ST, Clapper JA, Jenkins P, Enger MD. Toxicology. 1990;61:195. doi: 10.1016/0300-483x(90)90020-h. [DOI] [PubMed] [Google Scholar]
- 28.Kikuchi K. Chem Soc Rev. 2010;39:2048. doi: 10.1039/b819316a. [DOI] [PubMed] [Google Scholar]
Associated Data
This section collects any data citations, data availability statements, or supplementary materials included in this article.


