

Abstract
Multigrain halwa mixes (four types) were prepared from cereals, millets, legumes, nuts and condiments. These mixes had around 4% initial moisture content (IMC), during storage studies they had 23 to 32% as equilibrium relative humidity (ERH); 5 to 8% as the critical moisture content (CMC) and critical relative humidity (CRH) for these mixes were ~ 60%. Packaging material for storing these mixes was 75 μm thickness LDPE pouches. Under accelerated storage, these mixes picked up moisture up to 9% and at ambient up to 6.4%. Free fatty acids ~18% was developed under accelerated condition for 90 days; under ambient condition ~14% for 180 days. Ragi based spicy halwa mix could develop FFA up to 120%, which was due to the presence of tricarboxylic acid as one of the ingredient in this particular mix. Halwa mixes can be stored for 75 days under accelerated and 180 days under ambient conditions. Halwa prepared from these mixes had 26 to 31% moisture; protein, fat, carbohydrates and ash content were 5.7 to 6.3%, 7.9 to 8.7%, 54 to 58%, 1.6 to 3.3%, respectively. Energy derived from these ranged from 1,318 to 1,380 kJ/100 g. Ragi based spicy multigrain halwa was harder and chewy in texture; while wheat based multigrain halwa was softer. Dark brown colour persisted for Ragi based spicy multi grain halwa because of the inherent colour of the finger millet, ghee aroma and sweetness was insignificant for all the 4 types of halwa.
Keywords: Ready to cook, Multigrain halwa mixes, Storage, Relative humidity, Equilibrium moisture content, Sensory
Introduction
Halwa refers to many types of dense, sweet confections. It is a type of dessert with the consistency of a very thick pudding, made from various kinds of fruits, vegetables, grains, nuts and lentils. It is generally prepared from various raw materials like fine soji (semolina) from wheat, mung dhal, chick pea, carrot. In India, there are different types of desserts like Nauki halwa, Carrot halwa, Mung dhal halwa, Bombay halwa etc. In North India, the product-halwa is yellow brownish in colour, opaque, soft and smooth in texture, while in Southern India it is a jelly like translucent product with luster. It is not very easy to prepare halwa, as the raw materials specifications, their proportion, sequence of adding and processing steps are rather specific. Moreover, the halwa is normally rich in fat and sugar, but not satisfactory in other nutrients. In practice, halwa is sold in the market as ready to eat (RTE), but a ready to prepare (RTP) halwa mix or ready to cook (RTC) halwa mix is rather scanty. The present developed product is similar to North Indian halwa. Generally Bombay halwa resembles confectionary jelly in texture. Starch being an important glucose polymer, is a main gelling agent in the halwa (Jeyarani et al. 1996).
Generally market is witnessing wide range of ready to eat (RTE) products like Haldiram halwa, masur pak, etc. and similarly RTC products viz. fermented dry mix of idli and dosa (Vasudeva Singh et al. 2002), idli mix, dosa mix, jamun mix, pongal mix etc. On the other hand halwa mix from single grains like wheat is also available. We do not find a mix consisting of blend of several grains especially from cereal, millet, pulses, nuts and condiments. Fortified Chick pea sattu was prepared traditionally with vitamins and minerals and stored at ambient and accelerated conditions in LDPE and laminated pouches. FFA and alcoholic acidity increased but they were within sensory limits (Mridula et al. 2010). Convenience foods currently manufactured are made by extrusion cooking or roller drying of slurry of cereal and legumes and are too costly to be afforded by the majority of the target population in the developing countries (Desikachar 1979). Simpler methods of making convenience foods using diverse and locally available raw materials which could be made available at low cost are necessary. Physicochemical properties of starches in these halwa mixes and preparation, nutritional composition, functional properties and antioxidant activities of multigrain composite mixes were also reported by Hameeda and Singh (2010, 2011). Keeping these studies in view, in the present study, storage of halwa mixes, proximate composition of four types of cooked halwa, their texture and sensory characteristics have been studied and results are reported.
Materials and methods
Materials
Cereals and millets : rice (Oryza sativa L.), wheat (Triticum aestivum), ragi (finger millet) (Eleusine coracana L.), jowar (Sorghum vulgare) pulses : whole chick pea (Cicer arietinum), whole green gram (Phaseolus aureus Roxb), puffed bengal gram (Cicer arietinum), black gram dhal (Phaseolus mungo Roxb), nuts and oil seeds: almond (Prunus amygdalus), cashew nut (Anacardium occidentale), sesame (Sesamum indicum), condiments : poppy seeds (Papaner somniferum), cardamom (Elettaria cardamomum), cane sugar (Saccharum officinarium), agar agar were purchased from local market in Mysore, Karnataka, India. The grains were then cleaned, kept in air tight polyethylene bags, in a cool and dry place prior to use. All chemicals used were of analytical grade.
Flow chart for the preparation of ready to cook multigrain halwa mixes is shown in Fig. 1.
Fig. 1.

Flow chart for the preparation of RTC multi-grain halwa-mixes
Moisture sorption studies of halwa mixes
To study the influence of moisture on ready to cook multigrain halwa mixes and to select appropriate packaging material, to obtain desired shelf life for the product, the humidity moisture content relationship of the products were studied at 27 °C, by exposing weighed quantities of samples in petri dishes, to different relative humidities (RHs) ranging from 11 to 92% using appropriate saturated salt solutions (Lopez et al. 1995). The samples were periodically weighed till they attained practically constant weight or showed signs of mold growth whichever was earlier. After equilibration, the moisture content of the product under different RHs were calculated by adding/subtracting the gain/loss to the initial moisture content.
Packaging material
Low density polyethylene (LDPE) of thickness 75 μm was selected for packaging studies and shelf life of the mixes was evaluated.
Packaging and storage studies of halwa mixes
Two hundred gram of the products were packed in 11 × 16 cm LDPE pouches of 75 μm thickness and stored under 92% RH/38 °C (accelerated) and 65% RH/27 °C (ambient) storage conditions. They were withdrawn periodically every 15 days from accelerated and every month from ambient stored conditions and analysed for moisture content (MC), free fatty acids (FFA). Halwa was prepared individually from the respective mixes and their sensory studies were carried out.
Percentage of free fatty acids in the stored halwa mixes
This was analysed for multigrain halwa mixes at accelerated and ambient stored products according to the methods of AACC (2000). Fat was extracted in petroleum ether (60–80 °C) at room temperature for 5 h/overnight. The extract was filtered through Whatman filter paper No. 1. Filtrate was divided into equal volumes; one part was evaporated in a pre weighed petri dish on water bath and dried at 105 °C for 1 h and another part was titrated against known concentration of alkali using phenolphthalein as indicator with addition of equal volume of warm neutral alcohol. FFA was expressed as Oleic acid (%) and it was determined using the formula:
 |
Preparation of multigrain halwa
Ragi based multigrain halwa (RBMH), Wheat based multigrain halwa (WBMH), Sorghum based multigrain halwa (SBMH) and Ragi based spicy multigrain halwa (RBSMH) were cooked individually from the respective halwa mixes. To 100 g of each multigrain halwa mix., 170 ml of water was added and the slurry was cooked in a thick gauge round bottomed Indalium vessel on low flame. While cooking ~12 g of ghee was added step wise with continuous stirring and cooked until it attains chewiness which is judged by mouth feel.
Proximate analyses of cooked halwa
The moisture content of the prepared multigrain halwa was estimated by standard AOAC methods (2000). The micro Kjeldhal method was employed to determine the total nitrogen and their protein content (Nx6.25) was estimated (AOAC 2000). Fat content was estimated by extraction with petroleum ether (60–80 °C), with a soxhlet apparatus and ash content was determined as per AOAC (2000). Gross energy (kJ/100 g dry matter) was calculated based on the formula:  (Ekanayake et al. 1999).
Texture Profile Analysis (TPA) of cooked halwa
Textural properties were measured by double compression method using a texture analyzer (LLOYD texture instrument LR 5 K, England) equipped with a 1KN load cell. Multigrain halwa samples (1 cm) cube were cut from the central portion of the multigrain halwa cake (5 cubes from one cake). Dimension measurements were carried out using an 80 mm diameter cylindrical plunger at a cross head speed of 50 mm/min at 90° of compression and the time gap between the two compressions varied between 6 and 7 s. The following parameters were determined. Hardness, cohesiveness, springiness, gumminess, chewiness, adhesiveness, and stiffness were calculated from the texture profile analysis as described by Bourne (1978).
Sensory analysis of cooked halwa
A trained panel was employed for carrying out sensory evaluation of halwa prepared from individual multi-grain halwa mixes by following the method of quantitative descriptive analysis (Stone and Sidel 1998). Halwa was prepared from fresh as well as stored samples of halwa mixes (for 6 months), and were evaluated for sensory quality attributes at designated intervals of 15 days in the case of accelerated and 30 days in the case of ambient stored conditions. Evaluations were carried out in sensory booths under white fluorescent light, air conditioned at 20 ± 2 °C with RH 50 ± 5%. The samples were served to panelists in porcelain plates coded with 3-digit random numbers to minimize bias.
Panel training
Descriptors were developed during initial sessions by the panelists. Each member was asked to describe the food sample with as many spontaneous descriptive terms as they found applicable. The common descriptors chosen by at least one-third of the panel were compiled along with some impact descriptors for the preparation of scorecard. In order to trace the changes that could alter the sensory profile of the samples during storage, specific terminologies such as brown, binding, softness, chewiness, ghee-aroma, sweetness, spicy etc. were used in the scorecard for evaluation of the products. Panelists were suitably briefed and oriented about the perception of these notes.
Scaling method
Quantitative Descriptive Analysis (QDA) method of intensity scaling was used. The scorecard consisted of 15 cm scale where in 1.25 cm was anchored as ‘Low’ and 13.75 cm as ‘High’. The panel was asked to mark the intensity of the attribute by drawing a vertical line on the scale and writing the code. The scores for each attribute for a given sample were tabulated, representing the judgment of individual panelists. Finally, mean value was taken for each attribute of a sample, representing the panel’s verdict about the sensory quality of the product. But the overall quality was evaluated on an intensity scale which was anchored at ‘Very Poor’, ‘Fair’ and ‘Very Good’ to see the linking or preference of the samples by the panel members.
Statistical analyses
The results are expressed as mean ± standard deviation of three replicate analyses. All the data were analyzed by one way analysis of variance (ANOVA) followed by multiple comparison test (Tukey’s test) at 5% level of significance using GraphPad software Inc, USA.
Results and discussion
Moisture sorption studies of halwa mixes
As can be seen from Table 1, all the four halwa mixes exhibit similar moisture sorption behavior which was typical for starch based food product. All the four mixes were equilibrated to 23 to 32% relative humidity (RH) at their initial moisture content. At 11% RH, RBMHM and RBSMHM had registered around 3% moisture content, whereas WBMHM and SBMHM registered around 2% moisture content. At 22% RH, both types of ragi based mixes showed ~4% moisture where as wheat and sorghum based showed ~3% moisture each. At 32% RH, ragi based mixes registered ~4.4% moisture; wheat and sorghum based one had showed ~3.0%. The products at this RH were very good with roasted grain aroma. Similarly with 4 to 5% moisture content at 44% RH and 5 to 6% moisture content at 56% RH by all the 4 types of halwa mixes were noticed. The products at these RH were good with toasted aroma. However, they did not exhibit any lump formation. The product equilibrated at 64 and 75% RH were free from lumpiness, but had developed a kind of stale odour. At 64% RH, there was a sudden increase in moisture sorption of about 4% by RBSMHM compared to at 56% RH, where around 10% moisture content was noticed. However RBMHM and other two mixes picked up 0.7% moisture compared to at 56% RH. At 75% RH, the moisture pick up was 1.4 to 2.9% compared to at 64% RH, again highest pick up was noted in RBSMHM. At 86 and 92%, visible mould was observed in 5 and 4 weeks period stored mixes respectively. At 86% RH, moisture content was almost double compared to at 75% RH, and began to spoil. In RBSMHM, the moisture content was ~22% and in other three the range was ~15 to 17%. At 92% RH, the moisture content was around 35% for RBSMHM; RBMHM showed 21% and at the same time mould also appeared in each of the samples.
Table 1.
Changes in the equilibrium moisture content of RTC multigrain halwa mixes at different RH conditions
| Sl. no | RH (%) | EMC% (dry weight) | |||
|---|---|---|---|---|---|
| RBMHM | WBMHM | SBMHM | RBSMHM | ||
| 1 | 11 | 2.9 ± 0.10a | 2.2 ± 0.03a | 1.9 ± 0.00a | 3.1 ± 0.01a |
| 2 | 22 | 4.0 ± 0.04a | 2.9 ± 0.01abi | 2.7 ± 0.01ab | 3.9 ± 0.06ab |
| 3 | 32 | 4.4 ± 0.00a | 3.4 ± 0.00bci | 3.2 ± 0.03ab | 4.4 ± 0.00ab |
| 4 | 44 | 4.8 ± 0.46a | 4.3 ± 0.06c | 3.9 ± 0.15abc | 5.2 ± 0.01bc |
| 5 | 56 | 6.1 ± 0.01a | 5.2 ± 0.05de | 4.9 ± 0.04abc | 6.2 ± 0.01c |
| 6 | 64 | 6.8 ± 0.01a | 5.9 ± 0.03e | 5.5 ± 0.01bcf | 10.0 ± 0.01d |
| 7 | 75 | 8.2 ± 0.08a | 7.4 ± 0.07f | 7.0 ± 0.00c | 12.9 ± 0.03e |
| 8 | 86 | 16.2 ± 0.34bd | 16.8 ± 0.58g | 14.9 ± 1.06d | 22.3 ± 0.35f |
| 9 | 92 | 21.4 ± 5.39cd | 27.5 ± 0.14h | 25.6 ± 2.34e | 34.9 ± 1.04g |
| IMC% (dry wt) | 3.1 ± 0.30i | 2.9 ± 0.12af | 4.3 ± 0.30a | 4.3 ± 0.30a | |
| ERH% | 30 | 23 | 24 | 32 | |
| CMC% (dry wt) | 6.6 | 5.4 | 5.1 | 8.1 | |
| CRH% | 60.0 | 60.0 | 60.0 | 60.0 | |
RBMH, WBMH, SBMH, RBSMH - as per Table 1
RH Relative Humidity; IMC Initial Moisture Content; ERH Equilibrium Relative Humidity; CMC Critical Moisture Content; CRH Critical Relative Humidity
Values are mean ± standard deviation of three independent determinations
Means with the same superscript within the same column do not differ significantly (p > 0.05)
Initial moisture content (IMC) of ragi based multigrain halwa mix and that of RBSMHM were almost same (~4.3%) (Table 1) and that of wheat and sorghum based were around 3%, thus showing a difference of 1% high by RBMHM, which may be due to the differences in fibrous portion in the respective constituents of the mix (Hameeda and Singh 2011). Equilibrium relative humidity (ERH) for each product differed. For ragi based mixes, it varied from 30 to 32% and for wheat and sorghum based one, it was 23 and 24% respectively.
Critical moisture content (CMC) of each of these products was different. Highest (~8%) was noticed in RBSMHM and least by SBMHM (~5%) (Table 1). It was observed that the CMC for RBMHM and WBMHM were ~6.6 and 5.4% respectively. However no significant differences between wheat and sorghum based mixes were noticed. As the moisture sorption isotherm (a graph of %RH verses EMC) starts taking rise above 60% RH, the product deteriorates at high rate. Hence 60% RH was taken as critical relative humidity. Therefore all the products have a moisture tolerance of more than 2%. The product needs a high barrier packaging material when they are to be stored above 60% RH and the barrier property will not be a criterion when they were to be stored below 60% RH.
From the sorption results, using clipack software developed in house (Rangarao and Chetana 1993) in a packaging material of water vapour transmission rate (WVTR) 5–6 g/m2/day under 90% RH/38 °C, the shelf life was calculated. As per this procedure, the product can be kept below its CMC for 2 months under accelerated and more than 6 months under ambient conditions. However, the flavour changes needs to be monitored for the mixes during storage. Hence, the shelf life of the products packed in 75 μm LDPE (WVTR 5.8 g/m2/day under 90 °C RH gradients at 38 °C) determined as per BIS (1960) was evaluated under both the storage conditions.
Changes in moisture content of halwa mixes
The changes in moisture content of 4 types of halwa mixes on storage at accelerated (90% RH 38 °C) and at ambient (65% RH 27 °C) conditions for different periods are shown in (Table 2). During a period of 90 days, in RBMHM at 90% RH, the moisture content varied from 4.1 to 7%, where there was gradual increase in moisture content and at the end of 60 days it attained the critical moisture content and started deteriorating. Similarly at 65% RH, the moisture content increase was marginal but still gradual and at the end of 180 days, its moisture content just reached its critical level. Hence the product could be stored up to 180 days without spoilage.
Table 2.
Moisture changes of Ready to cook Multigrain Halwa mixes during storage in 200 g/packs of 11 × 16 cm and 75 μm LDPE pouches
| Storage Days | RBMHM | WBMHM | SBMHM | RBSMHM | ||||
|---|---|---|---|---|---|---|---|---|
| 90% RH | 65% RH | 90% RH | 65% RH | 90% RH | 65% RH | 90% RH | 65% RH | |
| 0 | 4.1 ± 0.30a | 4.1 ± 0.30a | 3.0 ± 0.30a | 3.0 ± 0.30a | 2.8 ± 0.12a | 2.8 ± 0.12a | 4.1 ± 0.30a | 4.1 ± 0.30a |
| 15 | 4.8 ± 0.01b | – | 3.1 ± 0.02b | – | 3.7 ± 0.03b | – | 5.1 ± 0.01b | – |
| 30 | 5.4 ± 0.05c | 4.4 ± 0.02ab | 4.3 ± 0.22cb | 3.4 ± 0.04b | 4.6 ± 0.25c | 3.2 ± 0.01b | 6.2 ± 0.05c | 4.5 ± 0.02b |
| 45 | 5.9 ± 0.10d | – | 5.2 ± 0.05d | – | 4.8 ± 0.10dc | – | 7.6 ± 0.10d | – |
| 60* | 6.6 ± 0.03*e | 4.6 ± 0.12bc | 5.6 ± 0.03*ed | 3.7 ± 0.03cb | 5.2 ± 0.01*e | 3.4 ± 0.03c | 8.4 ± 0.03*e | 4.8 ± 0.12cb |
| 75 | 6.7 ± 0.04fe | – | 5.8 ± 0.10fe | – | 5.5 ± 0.16f | – | 8.9 ± 0.04f | – |
| 90 | 7.0 ± 0.04gf | 4.9 ± 0.00cd | 6.2 ± 0.14gf | 3.9 ± 0.03dc | 6.0 ± 0.00g | 3.7 ± 0.01d | 9.4 ± 0.04g | 5.9 ± 0.00d |
| 120 | – | 5.1 ± 0.01de | – | 4.2 ± 0.03ed | – | 4.1 ± 0.04e | 9.7 ± 0.04h | 5.1 ± 0.01ed |
| 150 | – | 5.3 ± 0.13e | – | 4.1 ± 0.06f | – | 4.7 ± 0.05f | – | 6.1 ± 0.13fd |
| 180 | – | 5.9 ± 0.03f | – | 5.3 ± 0.22gf | – | 4.9 ± 0.00g | – | 6.4 ± 0.13g |
*Respective critical moisture content have been crossed, RBMHM, WBMHM, SBMHM, and RBSMHM - as per Table 1
Values are mean ± standard deviation of three independent determinations
Means with the same superscript within the same column do not differ significantly (p > 0.05)
In the case of WBMHM, at accelerated storage, initial moisture content was 3% (0 days) and gradual increase was noticed with increase in storage periods and at the end of 45 days the moisture content was ~5.2%. At the end of 60 days the moisture content crossed just its critical moisture content (5.6%). At ambient storage, the moisture content gradually increased and at the end of 150 days the moisture content was 4.1% and at the end of 180 days the moisture content reached just near to its CMC (5.3%). Thus showing the shelf stability of this mix for 180 days (6 months).
In the case of SBMHM, the initial moisture content was 2.8% and with increase in accelerated storage days, the moisture content increased to 5.2%, at the end of 60 days, which was almost equivalent to CMC of this mix. After this period of storage, the mix started spoiling by the indication of musty odour, mould etc. In the case of ambient storage, the moisture content increase was very gradual. At the end of 60 days the moisture content was ~3.4% and at the end of 180 days the moisture content was 4.9%, which was still below its CMC (5.14%). Hence the product could be stored even up to 180 days.
In RBSMHM, the initial moisture content was 4.1%; it increased gradually to 8.4% at the end of 60 days under accelerated storage, which was almost equivalent to CMC of this mix. At the end of 120 days the product almost got spoiled with the development of musty odour (Table 2). However under ambient condition, the moisture content increased gradually. At the end of 180 days the moisture content was only 6.4% which was below its CMC. Hence the product remained sound even at this period of storage.
As to be expected and can be seen in (Tables 1 and 2), their respective critical moisture content could cross in about 60 days of storage under accelerated condition whereas, the moisture content was below their critical value even after 180 days under ambient condition for all the products, which indicates the stability of the product.
Changes in FFA in the stored halwa mixes
Even though the mixes had a low fat content (<3%), changes in FFA was monitored to see the correlation with the sensory quality. It is known that the rate of increase of FFA will be in commensuration with the moisture content (Vijayalakshmi et al. 2009). As the moisture content was increasing in all the pouches, it was expected that FFA may increase and cause off flavour in the product. But, the change in FFA was marginal. The initial FFA for ragi, wheat and sorghum based multigrain halwa mixes was between 10.7 and 11.8%, whereas, for ragi based spicy multigrain halwa mix, it was 27.5% (Table 3). At accelerated storage the FFA in RBMHM increased from 12 to 17% for 90 days, in WBMHM it increased from 11 to 19%; in SBMHM from 10.7 to ~17%. However in the case of RBSMHM, it increased to ~67% and periodically it went up to ~115% and finally at the end of 90 days the value was 120%. This high increase in value was due to the presence of citric acid, which is a tri-carboxylic acid, which was used as one of the ingredient while developing this mix. At ambient storage, the increase in FFA was less than 1% at each withdrawal for every month. In the case of RBMHM at 180 days the increase in FFA was around 2%, in WBMHM it was ~2.6% and in SBMHM it was ~3.6% compared to their initial values. However the increase was quite high in RBSMHM for the reasons explained above. Thus the changes were marginal on storing at ambient condition as the maximum value observed was around 15% up to 2 and 6 months respectively under accelerated and ambient storage conditions.
Table 3.
Percentage of free fatty acids in ready to cook (RTC) multigrain halwa mixes while storage for different periods at accelerated and ambient conditions
| StorageDays | RBMHM | WBMHM | SBMHM | RBSMHM | ||||
|---|---|---|---|---|---|---|---|---|
| 90% RH | 65% RH | 90% RH | 65% RH | 90% RH | 65% RH | 90% RH | 65% RH | |
| 0 | 11.6 ± 0.06a | 11.8 ± 0.07a | 11.2 ± 0.05a | 11.2 ± 0.06a | 10.7 ± 0.02a | 10.7 ± 0.01a | 27.5 ± 0.06a | 27.5 ± 0.07a |
| 15 | 12.4 ± 0.01b | – | 11.7 ± 0.02b | – | 11.1 ± 0.01b | – | 67.3 ± 0.02b | – |
| 30 | 13.2 ± 0.01c | 12.5 ± 0.00b | 13.1 ± 0.04c | 11.8 ± 0.02b | 13.9 ± 0.01c | 12.3 ± 0.03b | 77.3 ± 0.02c | 102.2 ± 0.01b |
| 45 | 14.1 ± 0.18d | – | 14.6 ± 0.01d | – | 14.9 ± 0.12d | – | 87.7 ± 0.12d | – |
| 60 | 15.6 ± 0.06e | 13.1 ± 0.03c | 15.6 ± 0.06e | 12.0 ± 0.04c | 15.3 ± 0.05e | 13.5 ± 0.04c | 97.8 ± 0.06e | 108.3 ± 0.04c |
| 75 | 15.9 ± 0.03f | – | 16.7 ± 0.02f | – | 16.1 ± 0.07f | – | 114.9 ± 0.05f | – |
| 90 | 16.9 ± 0.02g | 13.6 ± 0.02d | 18.8 ± 0.01g | 12.1 ± 0.03d | 17.0 ± 0.03g | 14.0 ± 0.02d | 120.0 ± 0.02g | 112.1 ± 0.02d |
| 120 | – | 13.8 ± 0.00e | – | 13.2 ± 0.01e | – | 14.2 ± 0.01e | – | 113.2 ± 0.01e |
| 150 | – | 13.8 ± 0.03fe | – | 13.7 ± 0.01f | – | 14.3 ± 0.05f | – | 114.1 ± 0.10f |
| 180 | – | 13.9 ± 0.10gef | – | 13.9 ± 0.02g | – | 14.5 ± 0.06g | – | – |
RBMHM, WBMHM, SBMHM, and RBSMHM—as per Table 1
Values are mean ± standard deviation of three independent determinations
Means with the same superscript within the same column do not differ significantly (p > 0.05)
Proximate composition of cooked halwa
Proximate composition of four types of halwa is shown in (Table 4). Moisture content of these varied from 26 to 31% (w.b). Carbohydrate content determined by difference varied from 54 to 58%, among these wheat based halwa had highest carbohydrate, as this halwa contained base material consisting of grains which contained high carbohydrate compared to other three types. Protein content was in the range of 5.7 to 6.3%. Ragi based spicy halwa had around 0.5% higher protein, compared to other three types of halwa. This may be due to higher protein content in the individual raw material. Fat content varied from 8 to 9%, which was due to the addition of ghee while preparing halwa. Ash content was highest in ragi based spicy halwa compared to other types of halwa, which was due to the presence of spices and seed coat in the grains, as majority of the grains were used along with the seed coat or as whole grain. Wheat based halwa showed the highest energy content (1379.5 kJ/100 g) while the least was in the sorghum based halwa (1317.5 kJ/100 g). Ragi based (1359.7 kJ/100 g) and ragi based spicy halwa (1321.5 kJ/100 g) had intermediate energy value, thus indicating no substantial change in nutritive value and energy content due to processing.
Table 4.
Proximate composition of cooked halwa
| Components | RBMH | WBMH | SBMH | RBSMH |
|---|---|---|---|---|
| Moisture (%) | 27.8a ± 0.04 | 26.0b ± 0.38 | 31.0c ± 0.75 | 27.5a ± 0.33 |
| Total carbohydrate (%) | 55.9a ± 3.26 | 58.1a ± 1.95 | 53.7a ± 2.60 | 55.0a ± 2.70 |
| Protein (%) (Nx6.25) | 5.9a ± 0.09 | 5.9a ± 0.11 | 5.7a ± 0.00 | 6.3b ± 0.09 |
| Fat (%) | 8.7a ± 0.64 | 8.2a ± 0.52 | 8.0a ± 0.02 | 7.9a ± 0.04 |
| Ash (%) | 1.8a ± 0.03 | 1.7a ± 0.05 | 1.6ba ± 0.04 | 3.3c ± 0.08 |
| Energy (kJ/100 g) | 1359.7a ± 2.68 | 1379.5b ± 3.32 | 1317.5 ± 3.76c | 1321.5dc ± 2.65 |
Values are mean ± standard deviation of three independent determinations
Means with the same superscript within the same row do not differ significantly (p > 0.05)
Texture profile analyses of cooked halwa
Texture analyses of four types of halwa are presented in (Fig. 2), and various parameters measured are shown in (Table 5). Hardness, cohesiveness, springiness, gumminess, chewiness, adhesiveness and stiffness were analyzed using force time textural curve. Hardness (N) is the force necessary to attain a given deformation of the material or it is the force required to bite through the sample with molars. Halwa with low value for hardness means soft and smooth in texture and vice-versa. Cohesiveness is related to work required to overcome the internal bonding or maximum degree to which the sample holds together in a mass while chewing. Springiness is described as the rate at which a deformed material recovers to its undeformed conditions after the deforming force was removed. Halwa with higher springiness possesses higher elasticity. Chewiness is defined as the energy required to masticate a solid food product to a state of readiness for swallowing and is instrumentally quantified as a product of hardness, cohesiveness and springiness. Therefore halwa with higher chewiness is stiffer and harder to eat. Figure 2a–d shows a typical force verses time curve obtained after the application of two bite compression for these 4 types of halwa. Gumminess (N) is the force necessary to disintegrate a semisolid sample for swallowing (Hardness x Cohesiveness). Adhesiveness (N.mm) is the work necessary to pull the compressing plunger away from the sample. The middle portion of the halwa was analyzed for textural parameters because it had a homogeneous texture. Textural parameters were influenced by the type of grains used in the base material of the halwa. Wheat based multigrain halwa showed least values for hardness, cohesiveness, springiness, gumminess, chewiness, adhesiveness and stiffness followed by sorghum based, ragi based and ragi based spicy halwa.
Fig. 2.

Texture measurement of four types of multigrain halwa. a. Ragi based multigrain halwa. b. Wheat based multigrain halwa. c. Sorghum based multigrain halwa. d. Ragi based spicy multigrain halwa
Table 5.
Texture measurement of multigrain halwa
| Parameters | Sample height (mm) | Hardness 1 (N) | Hardness 2 (N) | Area1 (Nmm) | Area2 (Nmm) | Cohesiveness | Springiness (mm) | Gumminess (N) | Chewiness (Nmm) | Fracture force (N) | Adhesiveness (Nmm) | Stiffness (N/mm) |
|---|---|---|---|---|---|---|---|---|---|---|---|---|
| RBMH | 10a | 56.6a ± 5.50 | 43.5a ± 4.01 | 14.0a ± 2.88 | 3.4a ± 0.71 | 0.2a ± 0.00 | 3.5a ± 0.73 | 1.4a ± 0.16 | 5.0a ± 1.59 | 55.4a ± 5.27 | 0.09a ± 0.06 | 2.0 ± 0.18 |
| WBMH | 10a | 44.5b ± 1.54 | 34.8b ± 1.28 | 12.7a ± 1.22 | 2.3b ± 0.10 | 0.2a ± 0.02 | 2.5b ± 0.17 | 0.8b ± 0.12 | 2.1b ± 0.42 | 42.6b ± 3.40 | – | 1.8 ± 0.37 |
| SBMH | 10a | 57.2a ± 2.83 | 43.8a ± 2.31 | 15.5a ± 0.78 | 3.1ab ± 0.24 | 0.2a ± 0.00 | 2.5cb ± 0.10 | 1.2a ± 0.10 | 2.9a ± 0.34 | 55.4a ± 2.21 | 0.07a ± 0.04 | 2.0 ± 0.22 |
| RBSMH | 10a | 93.5c ± 1.97 | 71.4c ± 2.09 | 20.2b ± 2.06 | 6.5c ± 0.13 | 0.3b ± 0.03 | 3.5a ± 0.06 | 3.1c ± 0.34 | 10.6c ± 1.00 | 93.5c ± 1.97 | 0.08a ± 0.02 | 2.9 ± 0.14 |
RBMH, WBMH, SBMH, RBSMH—as per Table 1
Values are mean ± standard deviation of three independent determinations
Means with the same superscript within the same column do not differ significantly (p > 0.05)
Hardness 1 of halwa ranged from 44.5 to 93.5 N. The value was highest in RBSMH and in between was for RBMH (56.6 N) and SBMH (57.2 N). Least value for hardness in WBMH indicates higher softness compared to other halwa samples. Hardness 2 followed almost same pattern, but comparatively the values were less. Again hardness was highest in RBSMH. These values are clearly seen from the (Fig. 2), for individual halwa. Similar pattern was noticed for Area 1 and Area 2 in (N.mm). Highest area was noticed for RBSMH and least was for WBMH, in both areas 1 and 2. It is observed that the area 1 was high compared to Area 2. Highest cohesiveness was noticed for RBSMH and least for WBMH and in between were for other two halwa. Highest value of springiness was noticed for RBMH and RBSMH (3.5 mm) and least values for other two halwa. Gumminess i.e. force required to disintegrate a semisolid sample for swallowing. Again RBSMH showed highest value (3.1 N) and least for WBMH (0.8 N). Wheat based halwa had smooth texture compared to other three types of halwa. The values also showed the best texture for wheat based multigrain halwa compared to sorghum; ragi and ragi based spicy halwa. Chewiness of halwa varied between 2.1 and 10.6 N.mm. Highest for RBSMH followed by ragi, sorghum and wheat based halwa. Fracture force was highest for RBSMH (~93 N) and again least for WBMH (~43 N). However the fracture force was almost identical for RBMH and SBMH (~55.4 N). Adhesiveness was almost same among these three halwa samples. Stiffness was 2.9 N.mm, which was highest for RBSMH and least for WBMH (1.8 N.mm).
Sensory analysis of cooked halwa at different storage periods
Results of sensory analysis showed that ragi based multigrain halwa had darker brown colour compared to wheat and sorghum based multigrain halwa. Ragi based spicy multigrain halwa also had higher intensity of brown colour (Fig. 3a–d). The binding was quite similar in all the samples as the values varied between 6.8 and 7.7. Softness was more in wheat and sorghum based multigrain halwa. Ragi based and spice based multigrain halwa were quite hard and chewy. There was insignificant difference between the samples for ghee aroma and sweetness attributes. The overall quality score did not differ significantly between the samples. However in case of spice based multigrain halwa, the overall quality score was above fair. This may be due to non-compatibility of spice flavour with other ingredients present in the multigrain halwa mix. During the storage of mix, halwa prepared from different types of mixes, there was insignificant change in the specific sensory attributes for all the four samples. Figure 3a–d shows the sensory profiles of 0 day and 180 days under ambient storage condition and 0 day and 75 days under accelerated condition for ragi, wheat, sorghum and spice based multigrain halwa samples.
Fig. 3.
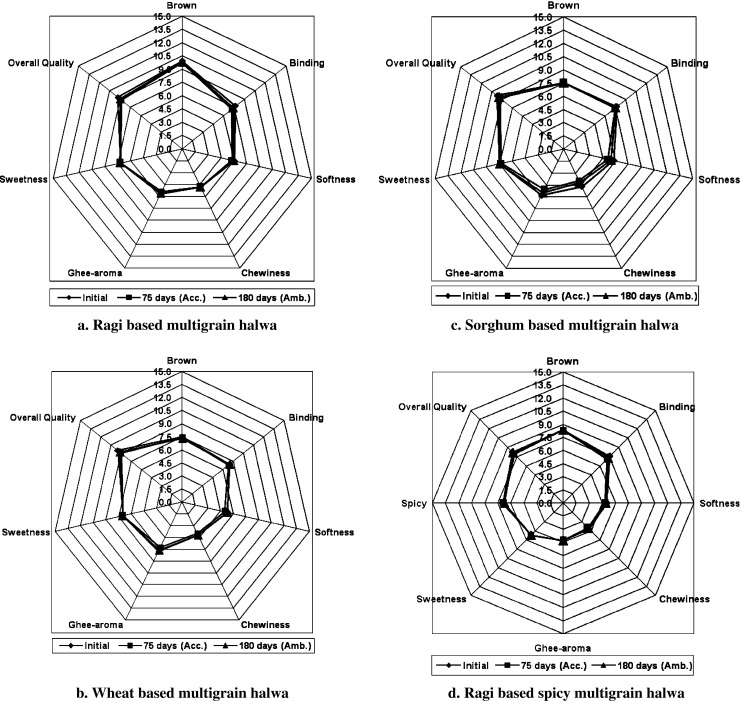
Sensory profile of four types of multigrain halwa
It may be concluded from the storage study that under accelerated condition the multigrain halwa mixes showed shelf life of about 2½ months and under ambient condition, about 6 months of shelf life, which have been proved by the sensory studies of the prepared halwa periodically.
Conclusions
Ready to cook multigrain halwa mixes were developed from different combinations of food grains - cereals, millets, legumes along with the nuts and condiments. These mixes could be stored in LDPE pouches of 75 μm thickness under ambient condition for 180 days and under accelerated condition for 75 days. Equilibrium Relative Humidity (ERH), CMC, IMC CRH and remarks on the quality of the equilibrated product for these mixes have been determined from sorption isotherm. Free Fatty Acids (FFA) developed was high under accelerated condition compared to ambient condition. Halwa prepared from these mixes, showed that ragi based spicy multigrain halwa was hard and wheat based halwa was soft. Under ambient condition these halwa were quite acceptable. Overall quality of these halwa varied from 8 to 9 based on quantitative descriptive analysis method of intensity scale.
Acknowledgements
The authors are thankful to Director, Dr. V. Prakash, Central Food Technological Research Institute, for showing keen interest and encouraging us in all respects in carrying out this work. We gratefully acknowledge financial support in the form of a 11th Five year plan Project awarded by Govt. of India.
References
- Approved methods of analysis. 10. St Paul: American Association of Cereal Chemists; 2000. [Google Scholar]
- AOAC (2000) Official Methods of Analysis, 17th edn. Washington, DC: Association of Official Analytical Chemists
- BIS Bureau of Indian standards (1960) Methods of sampling and test for paper and allied products IS: 1060 (Part II) New Delhi
- Bourne MC (1978) Texture profile analysis. Food Technol. 32(7):62–67, 72
- Desikachar HSR (1979) Weaning food formulations with hot paste viscosity suitable for Home/village level application. Proceedings of the symposium on food needs of infants and preschool children, 4th and 5th October at Madras
- Ekanayakke S, Jansz ER, Nair BM. Proximate composition, mineral and amino acid content of mature Canavalia gladiata seeds. Food chem. 1999;66:115–119. doi: 10.1016/S0308-8146(99)00041-2. [DOI] [Google Scholar]
- HameedaBanu Itagi N, Singh V. Preparation and functional properties of starch in ready to cook multigrain halwa mixes. Trends Carbo Res. 2010;2(3):15–24. [Google Scholar]
- HameedaBanu Itagi N, Singh V (2011) Preparation, nutritional composition, functional properties and Anti-oxidant activities of multigrain composite mixes. J Food Sci Technol doi:10.1007/s13197-011-0267-6 [DOI] [PMC free article] [PubMed]
- Jeyarani T, Yella Reddy S, Prabhakar JV. Physico-chemical and functional properties of starches separated from bombay halwa, a traditional Indian confection. J Food Sci Technol. 1996;33(2):116–120. [Google Scholar]
- Lopez A, Pique MT, Clop M, Tasius J. The hygroscopic behaviour of the hazelnut. J Food Engg. 1995;25:197–200. doi: 10.1016/0260-8774(94)00021-Z. [DOI] [Google Scholar]
- Mridula D, Jain R, Singh KK. Effect of storage on quality of fortified Bengal gram sattu. J Food Sci Technol. 2010;47(1):119–123. doi: 10.1007/s13197-010-0006-4. [DOI] [PMC free article] [PubMed] [Google Scholar]
- Rangarao GCP, Chetana UV (1993) “Food Life” a software package for prediction of shelf life of moisture sensitive food and selection of flexible package structure. Paper presented at 3rd IFCON 93, AFST(I) CFTRI campus, 7th–12th September at Mysore
- Singh V, Narasimha HV, Ali SZ (2002) A process for the preparation of fermented and dehydrated batter useful for making Indian Traditional Products like idli, dosa and like. PN:India 2006/199772
- Stone H, Sidel TC. Quantitative descriptive analysis, developments, application and the future. Food Technol. 1998;52(8):48–52. [Google Scholar]
- Vijayalakshmi NS, Indiramma AR, Rangarao GCP, Ramesh BS. Package design for chips based on their deteriorative characteristics, size and permeability of packages. J Food Sci Technol. 2009;46(5):450–454. [Google Scholar]