Abstract
The investigation was undertaken to establish a relationship between key odorants and perceived flavor attributes of dark chocolate as influenced by cocoa fermentation method, roasting and conching conditions, using multivariate data analysis in an attempt to use one variable to predict the other. Eight of the sixteen flavor attributes used by a trained sensory panel to describe and quantify the intensity of attributes in the samples were significantly different (p < 0.05). Roasting significantly reduced astringency in heap-fermented samples but the reduction in tray-fermented samples was not significant. Unconched samples were rated higher in banana attribute than conched samples. Multivariate data analytical tools, Principal Component Analysis (PCA) and Partial Least Squares (PLS) were used to investigate quantitative descriptive analysis and GC-O data and also to relate the two sets of data. PLS 1 models based on single sensory attributes gave better models than PLS2 models based on all sixteen sensory attributes. Ethyl-3-methylbutanoate (fruity, flowery); 2,5-dimethylpyrazine (popcorn); dihydro-2(3H)-furanone, (sweet); linalool oxide (sweet, flowery); benzaldehyde (earthy, nutty) and 2/3-methylbutanal (cocoa, roasted) modeled fruit attribute. It was also possible to model the attribute astringent from the aroma compounds 5-methyl-2-phenyl-2-hexenal (sweet, roasted cocoa), ethyl-3-methylbutanoate and pentyl acetate (green, cucumber). Since fruit attribute was higher in unconched samples and astringent higher in unroasted samples, it may be possible to use the levels of these important aroma compounds as indicators of the sensory attributes fruit and astringent.
Keywords: Heap-fermented, Tray-fermented, Roasting, Conching, Chocolate, Flavor attributes
Introduction
Chocolate is a unique food due to its attractive flavor. The chocolate manufacturing processes of roasting and conching play an important part in determining its flavor aside the genotype/origin of the cocoa and the fermentation/drying methods. Roasting and conching involves high temperatures that ensure the evaporation of undesirable compounds and at the same time the development of desirable ones that impact on the flavor of the finished product. The temperature and duration of the two processes influence the type and levels of aroma compounds in the finished chocolate and thereby determine its flavor quality (Ramli et al. 2006; Krysiak 2006; Counet et al. 2002) and so does the method of cocoa fermentation (Owusu et al. 2008). All three processing factors together determine the sensory flavor attributes of the final product.
The consumption of dark chocolate in moderate amounts is being encouraged due to its reported health benefits (Wollgast and Ankalm 2000; Steinberg et al. 2003). This not-withstanding, good flavor characteristics are still determinants for quality and inform the choice of a chocolate product. Chocolate manufacturers frequently use different roasting and conching temperatures/durations for different cocoa beans varieties and for different chocolate products to achieve specific flavor attributes. A good understanding of the flavor of any food partly involves relating the sensory perception of its flavor with its volatile chemical components (Drake et al. 2007).
Mulitvariate data analytical tools have been frequently used to find patterns and correlations within samples and variables, and between instrumental and sensory data in a variety of food/beverages including wine (Nobel and Ebeler 2002), tomatoes (Berna et al. 2005; Lee et al. 1999), bread (Sabanis et al. 2009; Gambaro et al. 2002), cheese texture (Drake and Gerard 1999), spaghetti (Martinez et al 2007) and textural changes in chocolate (Andrae-Nightingale et al. 2009).
Although a good correlation between instrumental aroma volatiles and sensory flavor attributes may not indicate a cause and effect relationship because there may be other reasons for the correlation, it is an indication that both variables change in same manner. The presence of a high level of an identified odorant for instance may also be an indication of a high intensity of a flavor attribute with which it is correlated. In the case of this investigation, a good correlation of particular flavor attributes and key odorants associated with the three different processing conditions, for instance, may enable the use of the latter as indicators of particular flavor characteristics.
This investigation was carried out to determine the effect of fermentation method, as well as roasting and conching conditions on the flavor characteristics of dark chocolates since all three processes together determine the nature of the final product. It is also to establish a relationship between key odorants and perceived flavor attributes of dark chocolate as influenced by these processing conditions, using multivariate data analysis in an attempt to use one variable to predict the other. This will be a useful tool in the day to day quality control of chocolate production which is essential in processing adjustments that yield products with more desirable and improved sensory attributes.
Materials and methods
Dark chocolate formulation
Six samples of dark chocolate were prepared at the Toms Confectionery Group A/S chocolate factory, Ballerup, Denmark. Three of these samples were prepared from heap-fermented Ghanaian cocoa beans and the other three from tray-fermented Ghanaian beans. All samples were prepared using the same recipe. The sample code and conditions were as follows:
hr0c2: heap fermented, unroasted, conched at 80 °C for 8 h.
tr0c2: tray fermented, unroasted, conched at 80 °C for 8 h.
hr2c0: heap fermented, roasted at 120 °C for 45 min, unconched.
tr2c0: tray fermented, roasted at 120 °C for 45 min, unconched.
hr3c1: heap fermented, roasted at 150 °C for 30 min, conched at 80 °C for 6 h.
tr3c1: tray fermented, roasted at 150 °C for 30 min, conched at 80 °C for 6 h.
For each sample, the beans were broken and de-shelled in a nut-cracking machine (LA-P, Westrup, Denmark) and the nibs separated from the shell in a winnowing machine (LA-LS-0705, Westrup, Denmark). The nibs were then roasted in a hot air oven (Venticell, Medcenter Einrichtungen Gmbh, Germany). For each of the roasting temperatures under investigation, the oven temperature was set and left to equilibrate for at least 30 min. The nibs were spread about 2 cm thick on baking trays and these were put on the oven shelves and the door quickly closed to minimize the amount of outside air that goes into the oven. After roasting, the nibs were cooled to room temperature before processing in a laboratory grinder (Spectral 10, Santha, US) to produce cocoa liquor. To produce approximately 4 kg of chocolate, 1.353 kg of sugar was added to 2.275 kg of cocoa liquor and mixed in a Bjørn Vari-mixer for 5 min. The mixture was then refined in a Three-roll mill (WDLH300, F.B. Lehmann, Germany) to reduce particle size and the resultant powder conched (Frisse Elk, Bülher, Switzerland) at 80 °C for the duration under investigation. At the end of the conching period, 452 g of cocoa butter and 20 g of lecithin as emulsifier were added to the chocolate in the conch and mixed for 20 min. The conched chocolate was then tempered to make the chocolate have a good snap, appear shiny and melt at near body temperature and then molded into pieces, each weighing ~ 4 g.
Quantitative descriptive analysis
The eight-member panel used for this evaluation involved persons that had been selected and received previous training on chocolate evaluation. The panel members were however given further training which involved developing descriptive words for the aroma and flavor of the chocolate samples and also learning to associate specific flavor attributes of the samples with flavor references. There were three preliminary/training sessions each lasting for at least 2 h to discuss the aroma/flavor of the chocolate samples. The sensory descriptors for flavor and aroma emerging from the training sessions were used to describe the dark chocolates. In situations where the same attribute emerged for aroma and flavor, the former was designated as the attribute followed by an ‘a’ whilst the latter was designated by an ‘f’ following the attribute. The attributes and physical references agreed on and used by the panel are shown in Table 1.
Table 1.
Sensory attributes and physical references used in the aroma and flavor evaluation of chocolates produced from two cocoa fermentation methods and with different roasting and conching conditions (where the same attribute occurred for aroma and flavor, the former is designated by an’a’ and the latter by an ‘f’ after the attribute)
| Attribute | Reference | Attribute | Reference |
|---|---|---|---|
| Yoghurt a | yoghurt (3% fat) | sour | 0.15% citric acid solution |
| Musty a | damp old book | banana | ripe banana |
| Smoked a | smoked almonds | prune/raisins | sun-dried prunes and raisins |
| Fruit a | fresh apple, prune, orange | sweet | 10% sucrose solution |
| Musty f | raw potato peel | coffee | medium-roasted coffee |
| Yoghurt f | yoghurt (3% fat) | dark /porter beer | dark beer, porter beer |
| Smoked f | smoked almonds | burnt | burnt coffee, burnt nuts |
| Unripe fruit | unripe green apple | astringent | green unripe banana |
Each chocolate sample was coded with a four-digit random number. The samples werebrought to room temperature prior to evaluation. Samples were presented to panelists in a randomized order to avoid an order effect. Panelists evaluated four samples in each session, over the course of three sessions based on a completely randomized design (Petersen 1985). Each sample was evaluated in duplicate by each judge. The six samples with two replications gave twelve combinations. Each judge was provided with a spit cup and a cup of water at room temperature to rinse mouth in-between sample tasting. One sample and an evaluation sheet were presented to each judge at a time and these were taken away at the end of the evaluation before another sample was presented. Evaluations were done on line-marking scales with labeled endpoints in sensory booths. Each evaluation sheet had all the sixteen aroma and flavor descriptors agreed on during the training sessions and panelists were instructed to mark points on each scale to indicate the intensity of the attribute. The 15 cm scale was anchored on the extreme left with ‘nothing’ and on the extreme right with ‘very much’.
Dynamic headspace sampling/Gas Chromatography-Mass Spectrometry
Twenty grams of each sample of dark chocolate was put in a 500 ml gas washing flask, closed with a purge head and placed in a water bath. The sample was allowed to equilibrate at 50 °C with agitation for 20 min without purging and then purged with a nitrogen flow of 200 mL/min for 60 min. Aroma compounds were collected on a Tenax-TA trap containing 250 mg of Tenax-TA with mesh size 60/80 and a density of 0.37 g/mL (Buchem bv, Apeldoorn, The Netherlands). Each sample was analyzed in triplicate.
The trapped volatiles were desorbed using an automatic thermal desorption unit (ATD 400, Perkin Elmer, Norwalk, USA). Primary desorption was carried out by heating the trap to 250 °C with a flow (60 mL min-1) of carrier gas (He) for 15.0 min. The stripped volatiles were trapped in a Tenax TA cold trap (30 mg held at 5 °C), which was subsequently heated at 300 °C for 4 min (secondary desorption, outlet split 1:10). This allowed for rapid transfer of volatiles to the GC column through a heated (225 °C) transfer line.
The volatiles were separated on a DB-Wax capillary column 30 m long x 0.25 mm internal diameter, 0.25 μm film thickness. The column flow rate was 1.0 mL/min using helium as carrier gas. The column temperature program was: 10 min at 40 °C, from 40 °C to 240 °C at 8 °C/min, and finally 5 min at 240 °C. The GC (Agilent 7890A) was equipped with a mass spectrometric detector (Agilent MSD 5975 C VL with Triple-Axis detector from Agilent Technologies, Palo Alto, California) operating in the electron ionisation mode at 70 eV. Mass-to-charge ratios between 15 and 300 were scanned.
Volatile compounds were identified by matching their mass spectra with those of a commercial database (Wiley 275.L, HP product no. G1035A), by comparison with retention times of authentic standards run under similar conditions, and by GC-olfactometry. The software program, GCD Plus ChemStation G1074B (Version E.02.00, Hewlett Packard, Palo Alto, California), was used for data analysis.
GC-Olfactometry
The same conditions used in the headspace sampling for GC-MS analysis described above, were used for GC-O analysis. Desorption of the aroma compounds was done thermally by a Short Path Thermal Desorption Unit (Scientific Services Inc. NJ). The desorption of the trap was done at 250 °C for 4 min with a helium flow of 10 mL/min. Separation was performed with a Hewlett-Packard 5890 GC with the following conditions: column, DB Wax; 30 m × 0.25 mm i.d. × 0.25 μm film thickness; carrier gas, helium; start flow, 1 mL/mm; split ratio, 1:20; column pressure, 88kPa (constant); oven program, 45 °C for 10 min, 6 °C /min to 240 °C, constant at 240 °C for 10 min; detector temperature, 250 °C; air flow, 345 mL/min; hydrogen flow, 35 mL/min.
For the GC-O analysis, the column flow was split approximately 1:4 with the minor part going to the FID and the other part leading to an olfactory detector outlet ODO-1 from SGE, Ringwood, Victoria, Australia. The flow from the outlet was combined with humidified air at 150 mL/min to avoid nasal dehydration.
Four samples (hr2c0, tr2c0, hr3c1 and tr3c1) were selected based on variation in the peak areas of their aroma compounds identified by GC-MS. These samples were used for GC-O. Eight judges sniffed all samples, one at a time, at different sessions. Each judge recorded the start and end times of the perception of a peak as well as its odor description. The recordings were done using a sound editing software Wavepad Sound Editor version 4.28. Identification of sniffed peaks was done by comparing GC-MS and GC-FID chromatograms and also by comparing retention times of identified peaks with those of authentic standards.
Statistical analysis
Analysis of variance (ANOVA) and Turkey’s least significant difference for each significant attribute were performed with the statistical software JMP 8.0 (Sas Institute Inc. 2008). Multivariate data analysis (Principal Component Analysis, PCA and Partial Least Squares PLS) regression were carried out on mean values with Latentix Version 2.0 (Latent 5, Copenhagen, Denmark). Each variable was mean-centered and scaled (multiplied by the inverse of the standard deviation) to give it the same variance. PCA was used to visualize the inter-sample and inter-variable (sensory attribute intensities) relationships. For PLS, GC-O/GC-MS data were the predictor variables (X) and sensory attributes were the response variables (Y).
Results and discussion
Quantitative descriptive analysis
Sixteen attributes were used to describe the aroma and flavor of the chocolate samples These included four attributes for aroma and twelve attributes for flavor (Table 1). Judge—replicate interaction was not significant (p > 0.05 for all attributes). This means that replications were not a source of error in any of the evaluated attributes. Sample-judge interaction was not significant for any attribute except fruity and astringent, meaning that the judges did not agree on the order of intensities of these two attributes in the samples. Misnawi et al. 2004 has reported that individuals often confuse astringency with bitterness because they do not understand its nature and according to Clifford 1985, many tannins and polyphenols exhibit both astringent and bitter sensations. This might be the reason for the disagreement on this attribute. Eight attributes—yoghurt a, fruit a, banana, musty, prune/raisins, sweet, smoked and astringent flavors were significantly different (p < 0.05) in intensities across the samples. Table 2 shows the levels of differences across the samples for these attributes.
Table 2.
Analysis of variance on flavor attributes with significantly different intensities for chocolate samples
| Attribute | hr0c2 | tr0c2 | hr2c0 | tr2c0 | hr3c1 | tr3c1 |
|---|---|---|---|---|---|---|
| Yoghurt a | 9.5a* | 6.0ab | 4.7b | 5.8ab | 7.8ab | 6.7ab |
| Fruit a | 3.6bc | 3.1c | 6.6ab | 6.9a | 4.8abc | 4.0abc |
| Banana | 3.7b | 4.2b | 8.6a | 6.1a | 3.4b | 3.6b |
| Musty f | 3.8b | 8.2a | 4.4ab | 5.1ab | 2.8b | 5.7ab |
| Prune/raisin | 7.8ab | 9.6a | 7.1ab | 5.7ab | 9.5a | 4.4b |
| Sweet | 6.6ab | 6.5ab | 8.5ab | 5.3b | 10.3a | 5.5b |
| Smoked f | 5.8bc | 8.5b | 4.6bc | 12.8a | 2.6c | 8.3b |
| Astringent | 10.9a | 11.2a | 7.9b | 9.5ab | 5.6c | 9.8ab |
*Values with different letters across a row are significantly different (p < 0.05)
The unconched tray sample (tr2c0) had a significantly higher value for fruit attribute than the unroasted conched tray and heap samples. Banana attribute was also significantly higher in the two unconched samples than in the other four which indicate that conching might have reduced the perception of this flavor attribute in the chocolates. The unconched tray sample (tr2c0) was rated significantly higher in smoked flavor than all the other samples whilst the roasted conched tray sample (tr3c1) had a significantly higher value than the corresponding heap sample (hr3c1). Since the unroasted tray sample (tr0c2) had a high value for this attribute than even the heap sample roasted at a high temperature of 50 °C (hr3c1), it is reasonable to assume that this off-flavor might have come from tray cocoa bean samples used for the chocolates rather than from the roasting process.
The unroasted tray sample was rated higher in musty flavor than the unroasted heap sample and the roasted conched heap sample. There was however no difference in rating between the two unconched samples as far as this attribute is concerned. This off-flavor is likely to be a result of mold contamination of the cocoa beans used (Dimick and Hoskin 1999; Misnawi et al. 2003). Obviously the tray fermented beans used in this investigation were of a poorer quality than those reported on by earlier authors (Allison and Kenten 1963; Owusu et al. 2008). Tray-fermented cocoa beans used in an earlier investigation (Owusu et al. 2008) were experimental samples obtained from the Cocoa Research Institute of Ghana whilst the former were obtained from cocoa farmers. This is an indication that if tray fermentation is properly carried out, it will result in cocoa beans of very good flavor quality, but if not the opposite may well be the result.
The unroasted heap sample was scored significantly higher (p < 0.05) in astringent mouth-feel than the roasted heap samples, an indication that roasting reduced the perception of this attribute in the heap samples. Although astringency was reduced in the roasted tray samples, the difference was not significant. Cocoa polyphenols and flavanoids have been identified as responsible for bitterness and astringency in cocoa but fermentation, drying and roasting reduces the levels of these cocoa components thereby reducing bitterness and astringency (Porter et al. 1991; Bonvehí and Coll 1997; Wollgast and Anklam 2000a). Heinzler and Eichner 1991; Ziegleder 1991; Kattenberg and Kemmink 1993 have all reported that roasting oxidizes residual polyphenols to quinones which are known to be very reactive agents (Kattenberg and Kemmink 1993). The possibility of polyphenols reacting with amino acids and proteins or polymerizing with each other to form tannins (Misnawi et al. 2004) have also been reported. According to Misnawi et al. 2005, roasting reduces the ability of polyphenols to interact with proteins thereby causing a decrease in astringency. Moreover, the authors mentioned the possible alteration of polyphenols during chocolate manufacturing processes that involve high temperatures and the presence of oxygen such as conching. In the present study, there was no significant difference between the rated value of the unconched tray sample (tr2c0) and the roasted conched tray sample (tr3c1) as far astringency is concerned. The observed difference between the two samples for the attribute may be due to the higher roasting temperature of the latter.
PCA of sensory data
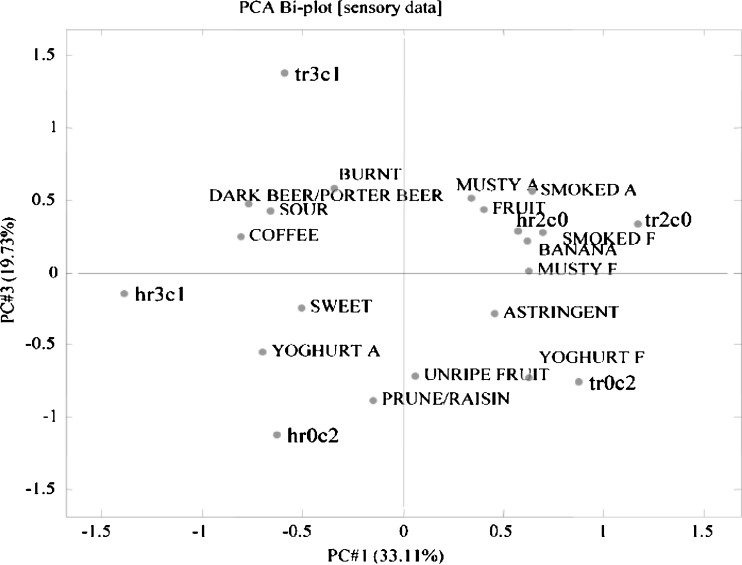
A PCA bi-plot (Fig. 1) was done to visualize and summarize the relationships within the samples and the sensory attributes and how variations in the intensity of the attributes explain variations in the samples. PC1 and PC2 explained 60% of the variation (plot not shown) whilst PC1 and PC3 explained 53% of the variation. PC1 with PC3 was however used because it separated the samples better than PC1and PC2. PC1 explained most of the variation in the samples, accounting for 33% of it. The two unconched samples (hr2c0 and tr2c0) and the unroasted tray sample had positive values of PC1 whilst the two roasted, conched samples (hr3c1 and tr3c1) and the unroasted heap sample had negative values. The two unconched samples were identified by a musty, smoked, fruit and banana aroma and a musty, smoked flavor. This is an indication that conching reduced the musty and smoky off-flavor as well as the fruit flavor in the chocolates.
Fig. 1.
Prinicipal Component Analysis (PCA) biplot of sensory data
Burnt, sour, coffee and dark/porter beer attributes were closely correlated whilst astringent mouthfeel, yoghurt flavor and unripe fruit aroma were also correlated. The latter were related to the unroasted tray sample, a confirmation that astringency in cocoa beans after fermentation and drying can be reduced with roasting of the beans during chocolate production.
Sweetness and astringency were on opposite sides of the PC1 axis, which means that the more astringent a sample, the less sweet it was perceived to be. Lopez 1986 as well as Misnawi et al., (2004) found an inverse correlation between astringency and sweetness in cocoa. High astringency may tend to mask perception of sweetness in cocoa and cocoa products including chocolate.
GC-Olfactometry (GC-O) data
Forty-six odorants were detected by at least three judges in the GC-O analyses and identified by GC-MS. These included mainly pyrazines, aldehydes, ketones, furans and esters (results not shown). In the present study the GC-O data were used for selecting the 16 most important aroma compounds. The latter were determined by selecting compounds detected by all eight judges in at least one sample. These were considered to be the compounds of highest sensory importance to the samples.
Relationship of sensory attributes with important aroma compounds
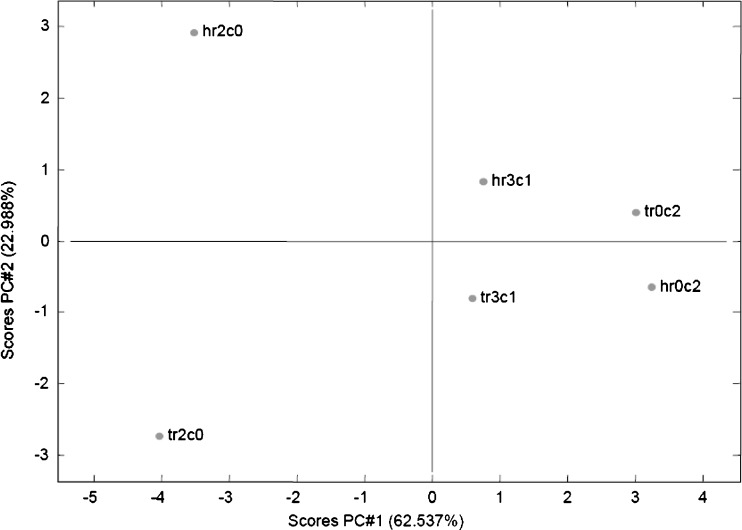
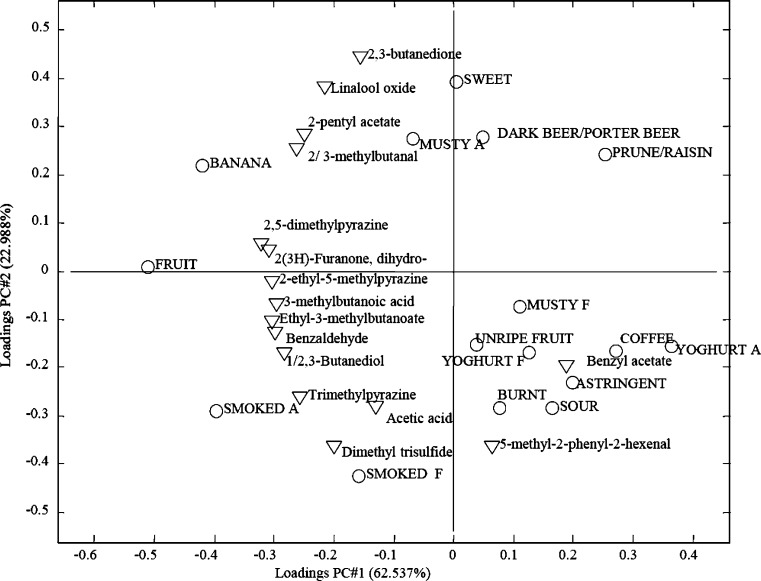
Partial Least Squares (PLS) regression models were used to correlate sensory data and instrumental data of the chocolate samples. A PLS2 model with full cross validation involving the sixteen important aroma compounds (selected based from GC-O data) as X variables and all sensory attributes as Y variables was calculated. Figures 2 and 3 respectively show the scores and loading plots based on this model.
Fig. 2.
Partial Least Squares (PLS) scores plot of data from sensory and important compounds detected by GC-O and identified by GC-MS
Fig. 3.
Partial Least Squares (PLS) loadings plot of data from sensory and important compounds detected by GC-O and identified by GC-MS
PLS components 1 and 2 explained 86% of the variation. PLS component1 separated samples based on a combination of roasting and conching conditions with conched samples having positive values and unconched samples with negative values for this component (Fig. 2). The component PLS2 mainly separated the unconched samples due to fermentation method. There was no clear separation of the other samples based on fermentation method.
Most important compounds identified had highest concentrations in the unconched samples (Fig. 3) indicating that conching reduced the concentrations of most of these compounds although the concentrations of a number of them including 2,5-dimethylpyrazine, 2-ethyl-5-methylpyrazine and 2/3-methylbutanal were expected to increase with higher roasting temperature of 150 °C. Unroasted samples conched for 8 h had the lowest concentrations of most of these compounds. Two compounds, benzyl actetate and 5-methyl-2-phenyl-2-hexenal however, had higher concentrations in conched than in unconched samples, which indicates that their concentration might have increased during conching at 80 °C for 6–8 h.
Fruit and banana flavors were positively correlated with 2,3-butandione (sweet, buttery), linalool oxide, pentyl acetate (green, cucumber), 2/3-methylbutanal (cocoa, roasted), 2,5-dimethylpyrazine (popcorn) and dihydro-2(3H)-furanone. These were negatively correlated with benzyl acetate (flowery) and 5-methyl-2-phenyl-2-hexenal (sweet, roasted cocoa). Smoked aroma and smoked taste had positive correlations with 2,3,5-trimethylpyrazine (fried potato), 2-ethyl-5-methylpyrazine (roasted, coffee), and dimethyl trisulfide (rubbery, onion), among others.
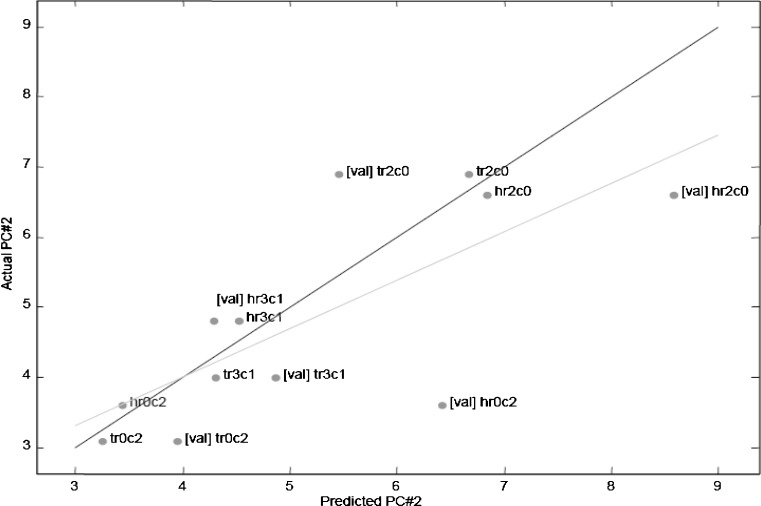
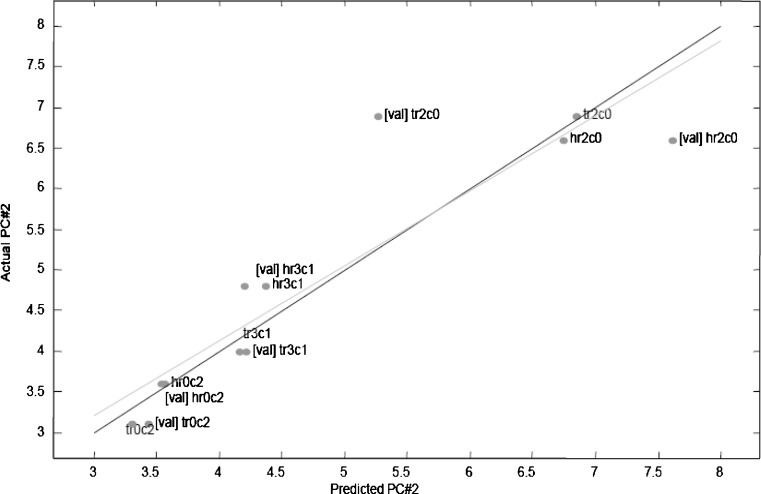
To improve on the performance of the model, a PLS1 model was calculated based on all sixteen important aroma compounds and a single flavor attribute as the Y variable. The flavor attribute that was best explained by the aroma compounds was fruit and this was used as the Y variable. The first two PLS components (with the lowest error) of this model explained 80% of the variation due to fermentation method as well as roasting and conching conditions. Figure 4 shows the actual versus predicted plot of this model with a correlation coefficient (r) of 0.55 and an error (Root Mean Square Error of Cross Validation, RMSECV) of 1.62.
Fig. 4.
Actual compared with predicted plot of Partial Least Squares (PLS) model based on sixteen important aroma compounds and the sensory attribute which is best explained by the instrumental data (fruit)
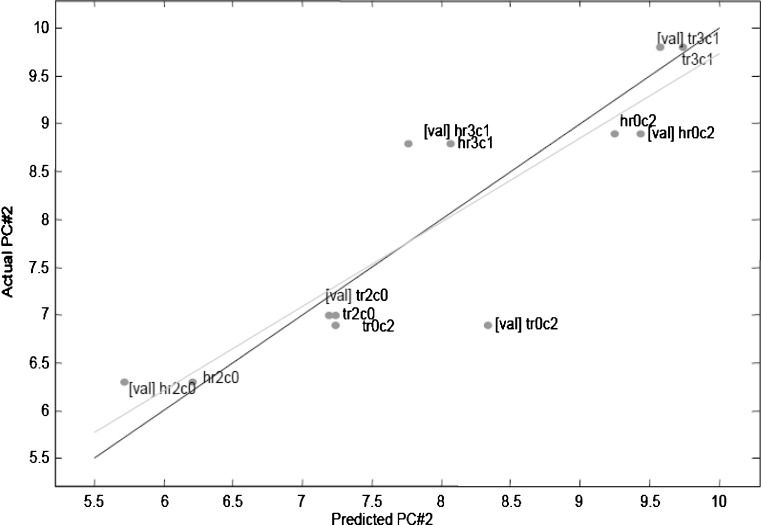
Fruit attribute was highly correlated with ethyl-3-methylbutanoate (fruity, flowery); 2,5-dimethylpyrazine (popcorn), dihydro-2(3H)-furanone (sweet); linalool oxide (sweet, flowery); benzaldehyde (earthy, nutty) and 2/3-methylbutanal (cocoa, roasted). Another PLS1 model was therefore made on these compounds with high correlation with respect to fruit. This gave a model with improved predictability for this attribute (Fig. 5). The new model had a correlation coefficient of 0.83 and a reduced error (RMSECV) of 0.84, an indication that these compounds can be used to predict fruitiness in the chocolate samples.
Fig. 5.
Actual compared with predicted plot of Partial Least Squares (PLS) model based on six important aroma compounds with high correlation with respect to the sensory attribute, fruit
Three important compounds had high correlation coefficients with respect to astringent mouth-feel; 5-methyl-2-phenyl-2-hexenal was positively correlated whilst ethyl-3-methylbutanoate and pentylacetate were negatively correlated with astringent. A model (Fig. 6) based on these compounds gave a correlation coefficient of 0.81 and an error (RMSECV) of 0.80 for two components. A high concentration of 5-methyl-2-phenyl-2-hexenal can therefore be predicted to also mean a high perception of astringent mouthfeel. On the other hand, high concentrations of ethyl-3-methylbutanoate and pentyl acetate can be predicted to mean a low intensity of astringent mouthfeel and vice versa. Although astringent mouthfeel in chocolate is a taste perception caused by polyphenols which are not aroma compounds, it may be possible to predict this taste sensory attribute from the concentrations of these three aroma compounds. This is especially important since the concentration of polyphenols in cocoa and chocolate is known to be related to fermentation and roasting processes (Porter et al. 1991; Clapperton et al., 1992; Bonvehí and Coll 1997).
Fig. 6.
Actual compared with predicted plot of Partial Least Squares (PLS) model based on three important aroma compounds with high correlation with respect to the sensory attribute, astringent
Conclusion
Correlation of sensory and aroma data using multivariate tools enabled a healthy model which can be used as an indicator of fruit attribute in the dark chocolate samples processed differently. Since this attribute was higher in unconched samples, it may be possible to use the concentrations of the important compounds with high correlation coefficients with respect to this attribute to indicate whether a sample is conched or unconched in dark chocolate. Additionally, it was possible to model the attribute astringent which was higher in unroasted samples from three important aroma compounds. The latter can also therefore be used as indicators to determine whether a sample is roasted or not.
Acknowledgements
The authors wish to express their gratitude to the Danish International Development Agency (DANIDA) and Toms Confectionery Group A/S for financial assistance. We also wish to thank Mehdi D. Farahani and Francisca Lystov-Saabye for their technical assistance.
Contributor Information
Margaret Owusu, Phone: +45-35-333435, FAX: +45-35-333245, Email: magoa2000@yahoo.com.
Hanne Heimdal, Phone: +45-44-891164, FAX: +45-44-891599.
References
- Andrae-Nightingale LM, Lee S-Y, Engeseth NJ. Textural changes in chocolate characterized by instrumental and sensory techniques. J Texture Studies. 2009;40:427–444. doi: 10.1111/j.1745-4603.2009.00190.x. [DOI] [Google Scholar]
- Allison HWS, Kenten RH. Tray Fermentation of Cocoa. Tropical Agriculture (St.Augustine) 1963;40:15–24. [Google Scholar]
- Berna AZ, Buysens S, Di Natale C, Grün IU, Lammertyne J, Nicolaï BM. Relating sensory analysis with electronic nose and headspace fingerprint MS for tomato aroma profiling. Post Harvest Biol and Technol. 2005;36:143–155. doi: 10.1016/j.postharvbio.2004.12.006. [DOI] [Google Scholar]
- Bonvehí JS, Coll FV. Evaluation of bitterness and astringency of polyphenolic compounds in cocoa powder. Food Chem. 1997;60:365–370. doi: 10.1016/S0308-8146(96)00353-6. [DOI] [Google Scholar]
- Clifford MN. Phenol–protein interaction and their possible significance for astringency. In: Birch GC, Lindley MG, editors. Interaction of food components. London: Elsevier; 1985. pp. 143–164. [Google Scholar]
- Counet C, Callemien D, Ouwerx C, Collin S. Use of Gas Chromatography-Olfactometry to identify key odorant compounds in dark chocolate. Comparison of samples before and after conching. J Agric Food Chem. 2002;5:2385–2391. doi: 10.1021/jf0114177. [DOI] [PubMed] [Google Scholar]
- Dimick PS, Hoskin JC. The chemistry of flavour development in chocolate. In: Beckett ST, editor. Industrial chocolate manufacture and use. 3. Oxford: Blackwell Science; 1999. pp. 137–152. [Google Scholar]
- Drake MA, Gerard VD. Relationship between instrumental and sensory measurements of cheese texture. J Texture Studies. 1999;30:451–476. doi: 10.1111/j.1745-4603.1999.tb00230.x. [DOI] [Google Scholar]
- Drake MA, Miracle RE, Caudle AD, Cadwallader KR. Relating sensory and instrumental analysis. In: Marsili R, editor. Sensory-directed flavor analysis. Fl: CRC Press Taylor & Francis Group; 2007. [Google Scholar]
- Gambaro A, Varela P, Gimenez A. Textural quality of white pan bread by sensory and instrumental measurements. J Texture Studies. 2002;33:401–413. doi: 10.1111/j.1745-4603.2002.tb01356.x. [DOI] [Google Scholar]
- Heinzler M, Eichner K. The role of amodori compounds during cocoa processing – formation of aroma compounds under roasting conditions. Z. Lebensm.-Unters.-Forsch. 1991;21:445–450. doi: 10.1007/BF01193145. [DOI] [Google Scholar]
- Kattenberg HR, Kemmink A. The flavor of cocoa in relation to the origin and processing of the cocoa beans. In: Charalambous G, editor. Food flavor, ingredients and composition. New York: Elsevier; 1993. pp. 1–22. [Google Scholar]
- Krysiak W. Influence of roasting conditions on coloration of roasted cocoa beans. J Food Eng. 2006;77:449–453. doi: 10.1016/j.jfoodeng.2005.07.013. [DOI] [Google Scholar]
- Lee S-Y, Luna-Guzman I, Chang S, Barret DM, Guinard J-X. Relating descriptive analysis and instrumental texture data of processed diced tomatoes. Food Qual Prefer. 1999;10:447–455. doi: 10.1016/S0950-3293(99)00035-X. [DOI] [Google Scholar]
- Lopez AS. Chemical changes occurring during the processing of cacao. In: Dimick PS, editor. Proceeding of the cacao biotechnology symposium. USA: Penn State University; 1986. p. 19E52. [Google Scholar]
- Martinez CS, Ribotta PD, Leon AE, Anon MC. Physical, sensory and chemical evaluation of cooked spaghetti. J Texture Studies. 2007;38:666–683. doi: 10.1111/j.1745-4603.2007.00119.x. [DOI] [Google Scholar]
- Misnawi JS, Jamilah B, Nazamid S. Effects of incubation and polyphenol oxidase enrichment on colour, fermentation index, procyanidins and astringency of unfermented and partly fermented cocoa beans. Int J Food Sci Technol. 2003;38:385–395. [Google Scholar]
- Misnawi JS, Jamilah B, Nazamid S. Sensory properties of cocoa liquor as affected by polyphenol concentration and duration of roasting. Food Qual Prefer. 2004;15:203–409. doi: 10.1016/S0950-3293(03)00097-1. [DOI] [Google Scholar]
- Misnawi JS, Jamilah B, Nazamid S. Changes in polyphenol ability to produce astringency during roasting of cocoa liquor. J Sci Food Agric. 2005;85:917–925. doi: 10.1002/jsfa.1954. [DOI] [Google Scholar]
- Nobel AC, Ebeler SE. Use of multivariate statistics in understanding wine flavor. Food Reviews Int. 2002;18:1–20. doi: 10.1081/FRI-120003414. [DOI] [Google Scholar]
- Owusu M, Petersen MA, Heimdal H (2008) Assessment of aroma of chocolate produced from two cocoa fermentation types. In: Expression of Multidisciplinary Flavour Science Proceedings of the 12th Wuerman Symposium. Interlarken, Switzerland, p 363–366.
- Petersen, RG (1985) Completely randomized design. In design and Analysis of Exxperiments, Marcel Dekker, NY, pp 7–33
- Porter LJ, Ma Z, Chan G. Cacao procyanidins: major flavonoids and identification of some minor metabolites. Phytochem. 1991;5:1657–1663. doi: 10.1016/0031-9422(91)84228-K. [DOI] [Google Scholar]
- Ramli N, Hassan O, Said M, Samsudin W, Idris NA. Influence of roasting conditions on volatile flavor of roasted Malaysian cocoa beans. J Food Process Preserv. 2006;30:280–298. doi: 10.1111/j.1745-4549.2006.00065.x. [DOI] [Google Scholar]
- Sabanis D, Soukoulis C, Tzia C. Effect of raisin juice addition on bread produced from different wheat cultivars. Food Sci Technol Int. 2009;15:325–336. doi: 10.1177/1082013209346581. [DOI] [Google Scholar]
- Steinberg FM, Bearden MM, Keen CL. Cocoa and chocolate flavanoids: implications for cardiovascular health. J Am Dietetic Assoc. 2003;103:215–223. doi: 10.1053/jada.2003.50028. [DOI] [PubMed] [Google Scholar]
- Wollgast J, Anklam E. Review of polyphenols in Theobroma cacao: changes in composition during the manufacture of chocolate and methodology for identification and quantification. Food Res Int. 2000;33:42–447. [Google Scholar]
- Wollgast J, Anklam E. Polyphenols in chocolate: is there a contribution to human health? Food Res Int. 2000;33:449–459. doi: 10.1016/S0963-9969(00)00069-7. [DOI] [Google Scholar]
- Ziegleder G. Composition of flavor extracts of raw and roasted cocoas. Z. Lebensm. Unters. Forsch. 1991;192:521–525. doi: 10.1007/BF01202506. [DOI] [Google Scholar]


