Abstract
This paper describes the application of the electronic tongue (E-tongue) in the Discrimination of different white chrysanthemum. Three grade samples, two brands of samples and the samples adulterated were measured by the E-tongue. It was found the samples with different grades or brands could be clearly discriminated and the samples adulterated were separated from the authentic samples using PCA. The results of DFA and BPNN showed the total predicted accuracy of three grades samples were 86.7% and 93.3%. A strong positive correlation was observed between the sensory score and the predicted score (correlation coefficient is 0.9768) using PLS, and the samples were correctly classified. These results suggest the E-tongue may be useful for quality control of white chrysanthemum.
Keywords: Electronic tongue, Chrysanthemum, Quality
Introduction
White chrysanthemum (Chrysanthemum Morifolium Ramat), one of the eight famous folk herbs in zhejiang province of China, has been known to be a rich resource of bioactive constitutes and its medical value. Its flower is mainly used as a kind of traditional healthy drinks like Chinese tea. White chrysanthemum drink was brewed by infusing dried chrysanthemum into hot water. Now it has been found by scientific research that white chrysanthemum has antioxidant activities and can protect cardiovascular system, prevent the cancer (Fang et al. 2002; Huang et al. 2004; Jiang et al. 2005; Hu et al. 2006; Shen et al. 2006), resist fatigue, and lower the level of serum lipid (Hu et al. 1996). As a popular drink, its quality has become an increasingly concerned problem. It has been proved that there is a close relationship between the nutrition value of white chrysanthemum and its quality (Hu et al. 1996). The traditional ways to evaluate the white chrysanthemum quality depend on chemical methods and sensory panel analysis. Although the chemical methods are reliable, they need a series of complex and time-consuming procedures. Sensory analysis is an effective way to give a correct quality evaluation, but it is also limited by various factors such as taste saturation and fatigue, the need of trained experts and restricted procedures. So it is an urgent problem to find a rapid, simple, credible way to determine the quality of white chrysanthemum.
Electronic tongue (E-tongue) is a novel mimic human taste device and has been used to complex liquids analysis. With the development of chemometrics methods and sensor technology, E-tongue based on various principles have been successfully applied to discriminating different mineral water (Legin et al. 2000; Ciosek et al. 2004; Gallardo et al. 2005; Moreno et al. 2006), beers (Legin et al. 1997; Ciosek et al. 2006), wines (Legin et al. 2000; Parra et al. 2006a; b), fruit juices (Ciosek et al. 2004; Gallardo et al. 2005; Legin et al. 1997; Ciosek et al. 2006; Lvova et al. 2006; Schumacher et al. 2010; Raj et al. 2011), coffee (Legin et al. 1997), tea (Legin et al. 1997; Ivarsson et al. 2001; Lvova et al. 2003; Kumar et al. 2011), milk (Winquist et al. 2005; Ciosek et al. 2006), vinegar (Lvova et al. 2006), rice (Tran et al. 2004), alimentary vegetable oils (Apetrei et al. 2005), apples (Rudnitskaya et al. 2006), tomatoes (Beullens et al. 2006), etc… Prediction of some components content in the liquid could be made using E-tongue, such as the alcoholicity, organic acid in wines (Legin et al. 2000), the main components responsible for the taste of tea (Lvova et al. 2003), sugar and acid in the tomatoes (Beullens et al. 2006). All these show E-tongue is a useful tool for food analysis. However, as yet few literatures are reported about the evaluation of white chrysanthemum drink by E-tongue.
The purpose of this work is to evaluate the feasibility of discriminating different white chrysanthemum according to the different brand, grade (for the same brand) and adulteration by means of the E-tongue and pattern recognition methods.
Materials and methods
Samples and experiment procedure
Two brands of white chrysanthemum (brand A and B, Table 1) were purchased from white chrysanthemum special stores. The sample A was from Hangzhou and the sample B was from Tongxiang County. Both were processed by microwave drying technology. Grade is divided according to picking dates and appearance of fresh flower. The flowers picked at the first time and the good flowers picked at the second time are named grade I. The remaining flowers picked at the second time and the good flowers picked at the third time are named grade II. The rest picked at the third time are named grade III.
Table 1.
White chrysanthemum used in measurement
| Experiment No. | Brand | Sample name | Grade (Price ¥/kg) | Sample repetition |
|---|---|---|---|---|
| 1 | A | A1 | I (200) | 26 |
| A2 | II (98) | 26 | ||
| A3 | III (78) | 26 | ||
| 2 | A | A1 | I (200) | 5 |
| B | B1 | I (200) | 5 | |
| 3 | A | A1 | I (200) | 5 |
| C1 | – | 5 | ||
| C2 | – | 5 |
The samples in the experiment were divided into three categories. The first one was three grades of brand A white chrysanthemum (named A1, A2 and A3), the second one was two brands of white chrysanthemum belonged to the same grade (named A1 and B1), the third one was the adulterant samples (named C1 and C2), which comprised two grades of white chrysanthemum A (A1 and A3) with different proportions. The mass proportion of sample A1 and sample A3 in sample C1 was 1:1, and that in sample C2 was 2:1.
Classification experiments were first performed with samples from three different grade A1, A2 and A3 (Experiment No. 1); then with sample A1 and B1 (Experiment No. 2); finally with the sample A1, C1 and C2 (Experiment No. 3).
All sample 3 g was infused in 150 ml deionized water at 100 °C and brewed for 5 min, and then the chrysanthemum-flowers were removed. After the solution was cooled in an ice-bath until the temperature dropped to 22 °C and 80 ml solution of each sample was taken for the measurement. The aims of the experiment made the difference in the number of sample repetitions between exp.1 and exp. 2 and 3. In the experiment 1, the discriminating and predicting investigations were carried out. Predict models need a large number samples. The repetitions in the three experiments were 26, 5 and 5, respectively.
Each solution was analyzed three times in series. Then the data obtained from the E-tongue during the three times analysis were averaged one numerical value.
Sensory analysis
Sensory analysis was carried out using 10 well-trained volunteers (from 23 to 35 years old, 5 women, 5 men: 6 judges from department of food science and 4 judges from department of tea science). Subjects were provided with mineral water as palate cleanser between samples. Sensory evaluation was conducted in an air-conditioned room (22 °C), under white light in separate booths. They were asked to score three grade samples on the basis of the following items: aroma λ1, liquor color λ2, taste λ3. Each item is divided into three ranks according to its proper characteristic and the corresponding score criterion of three ranks is 94 ± 4, 84 ± 4, and 74 ± 4 (Table 2, GB/T 18862–2008). The impact factor: aroma is 40%, liquor color is 20%, taste is 40%. Total score is sensory evaluation value of white chrysanthemum.
 |
Table 2.
Standard of sensory evaluation of white chrysanthemum
| Item | Sensory descriptors | Score criterion |
|---|---|---|
| Liquor color | bright kelly | 94 ± 4a |
| Little bright kelly | 84 ± 4 | |
| Buff, little bright | 74 ± 4 | |
| Aroma | Heavy, pure, fresh and lovely, permanent | 94 ± 4 |
| Little heavy | 84 ± 4 | |
| Thin aroma with a little stale | 74 ± 4 | |
| Taste | Sweet and mellow, fresh and heavy, tender and brisk | 94 ± 4 |
| Sweet, little heavy | 84 ± 4 | |
| Pale, a little stale | 74 ± 4 |
aScore of each item deviation is ±4: +4 is good, −4 is poor
Electronic tongue
Experiments were performed by an α-Astree II electronic tongue (Alpha M.O.S company, France ) which consists of an array of seven different liquid cross-selective sensors (ZZ, BA, BB, CA, GA, HA, JB), a 16-position autosampler, and associated interface electronic module. The sensors are based on an innovative electrochemical potentiometric sensor technology: the CHEMFET (Chemical Modified Field-Effect-Transistor) technology. Each sensor is composed of an organic coating sensitive to the species to analyze in the samples and a transducer, which allows converting the response of the membrane into signals that will be analyzed. The detection method used is a measurement of the voltage difference between the CHEMFET sensor and the Ag/AgCl reference electrode. Therefore, an integral signal for each sample comprised a vector with 7 individual sensor determinations. The sensors and their attributes are shown in Table 3.
Table 3.
Sensors used and their thresholds in α-ASTREE electronic tongue
| Basic Taste | Taste Substance | Threshold of Sensors (mol/L) | ||||||
|---|---|---|---|---|---|---|---|---|
| ZZ | BA | BB | CA | GA | HA | JB | ||
| Sour | Citric acid | 10−7 | 10−6 | 10−7 | 10−7 | 10−7 | 10−6 | 10−6 |
| Salty | NaCl | 10−6 | 10−5 | 10−6 | 10−6 | 10−4 | 10−4 | 10−5 |
| Sweet | Glucose | 10−7 | 10−4 | 10−7 | 10−7 | 10−4 | 10−4 | 10−4 |
| Bitter | Caffeine | 10−5 | 10−4 | 10−4 | 10−5 | 10−4 | 10−4 | 10−4 |
| Savoury | MSG | 10−5 | 10−4 | 10−4 | 10−4 | 10−5 | 10−4 | 10−4 |
Data processing
Data obtained in the experiment was processed by pattern recognition methods such as Principal Component Analysis (PCA), Discriminant Factorial Analysis (DFA), Partial Least Squares (PLS), and Back Propagation Neural Networks BPNN. PCA is a useful and common statistical method, widely used in chemometrics to compress high-dimensional data into a lower-dimensional space, thus, making data more comprehensible by extracting essential information. PCA uncover combinations of the original variables (these combinations are known as latent variables or principal components—PCs) which describe the dominant patterns and the main trends in the data (Jackson 2003). The PCA method was used for sensors array output treatment as a mean to visualize different groups.
DFA is also termed Multiple Discriminant Analysis (MDA) and Canonical Discriminant Analysis. It adopts a perspective similar to PCA, but PCA and DFA are mathematically different in what they are maximizing. DFA maximizes the difference between values of the dependent, whereas PCA maximizes the variance in all the variables accounted for by the factor (http://www.statistics.com). DFA was used to classified cases into three or more categories using dummy categorical variables as predictors.
PLS is a bilinear modeling method where information in the original X-data is projected onto a small number of underlying (‘latent’) variables called PLS components. The Y-data are actively used in estimating the ‘latent’ variables to ensure that the first components are those that are most relevant for predicting the Y-variables. Interpretation of the relationship between X-data and Y-data is then simplified, as this relationship is concentrated on the smallest possible number of components (Marin et al. 2007). In this work, PLS was used to predict sensory score values, based on a calibration curve in correlation with sensory panel score, for unknown samples.
The BPNN is the most common learning rule for multi-layer perceptions. It involves two phases: a feed forward phase in which the external input information at the input nodes is propagated forward to compute the output information signal at the output unit and a backward phase in which modifications to the connection strengths are made based on the differences between the computed and observed information signals at the outputs units (Wu and Ye 2009). In the study, BPNN was used for the grade prediction of the samples.
One-way Analysis of variance was conducted to the sensory scores.
PCA, DFA and PLS were performed with the electronic tongue software version 3.0, as advised by the Alpha M.O.S. BPNN was performed by using MATLAB (version 6.5). Analysis of variance was performed with SPSS11 (Statisticalc Productcand Servicec Solution, Version 11).
Results and discussion
Response of E-tongue to white chrysanthemum taste
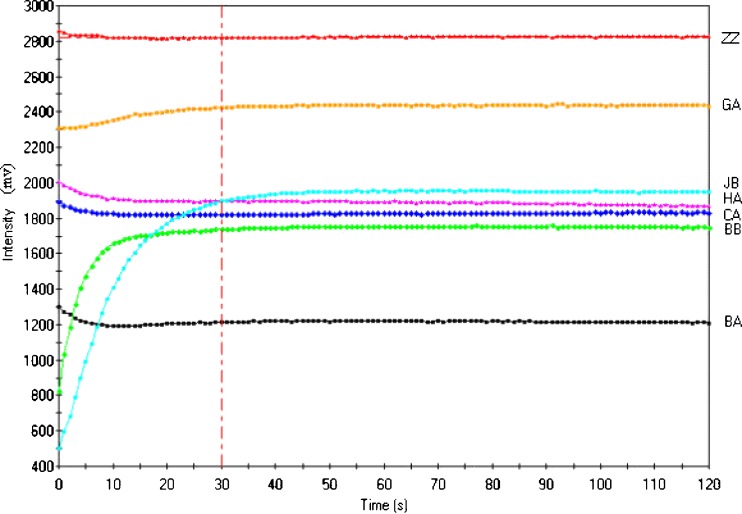
Figure 1 showed the response curve of seven sensors to the sample liquor. Y-axis represented the voltage difference between the sensor and the reference electrode, and X-axis was measurement time. It was shown that the initial conductivity vary, after 30s, the sensors response curves gradually became stable. So the 120th second signal values were collected for data analysis.
Fig. 1.
Response curves of seven sensors to the sample (Brand A)
Higher conductivity of chemical sensors ZZ and GA and low conductivity of BA were obtained from brand A sample after stabilization. The conductivity values of chemical sensors JB, HA, CA and BB were near. The similar results could be obtained from brand B and C, but the conductivity values of chemical sensors were different from values of the brand A (Figures were omitted).
Classification of white chrysanthemum of different grades and brands using PCA
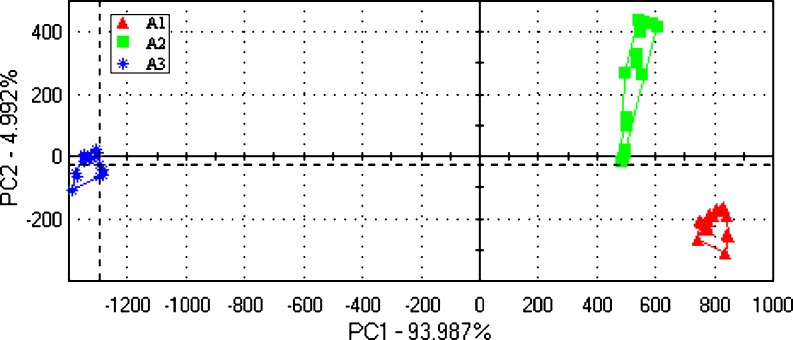
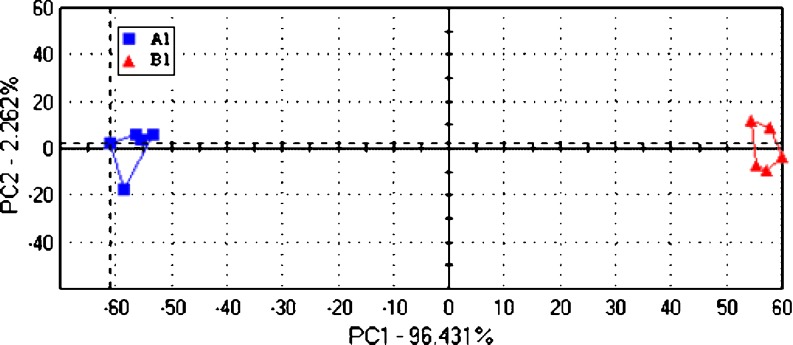
The PCA treatment of the E-tongue signals provided groups of samples according to their grades and brands (Figs. 2 and 3). Figure 2 showed a good discrimination of the three grades white chrysanthemum for the brand A. The axis of the first principal component expressed 93.987% of the whole variance and the second principal component explained 4.992%. There was a clear differentiation between the two brands samples in Fig. 3. These revealed that white chrysanthemum with different grades or brands could be classified by the E-tongue together with PCA.
Fig. 2.
PCA plots of three grades white chrysanthemum
Fig. 3.
PCA plots of two brands of white chrysanthemum
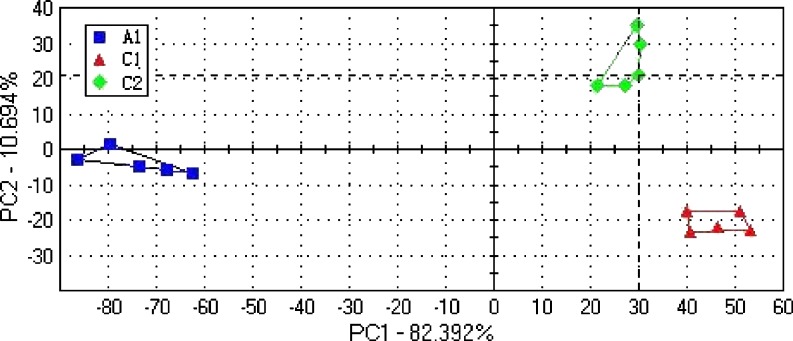
Figure 4 showed the discrimination of adulterated white chrysanthemum using the E-tongue. Three groups samples (A1, C1 and C2), were greatly differentiated by E-tongue. The first two principal components explained about 93% of the total variance. With the increase of the adulteration amount, the distance from the unadulterated group to the adulterated group was further. This indicated the electronic tongue as a promising tool for the recognition of the authentic white chrysanthemum.
Fig. 4.
The discrimination of the adulterated samples and the unadulterated sample using PCA
Prediction of white chrysanthemum grade using DFA, BPNN and PLS
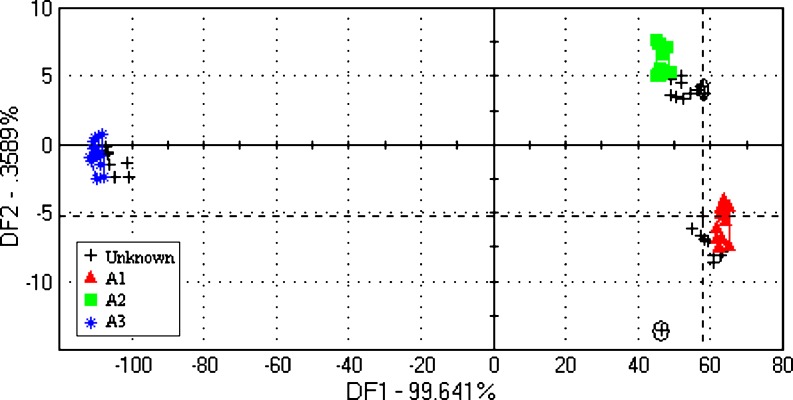
The discriminant factorial analysis for the three white chrysanthemum was shown in Fig. 5. The total 78 samples (26 duplicates for each group) were divided into two groups: 48 samples (16 samples for each group) for the training set and 30 (10 samples for each group) for the test set. The training set was clearly classified three clusters and most of the test samples were correctly ranged in the corresponding categories except for the samples marked with a circle. Prediction results and accuracy of white chrysanthemum grade using DFA were observed in Table 4. It was shown that the best prediction result was obtained for the sample A3 (100% accuracy) and the other two-sample accuracies were 90% and 70% respectively. The total predicted accuracy was 86.7%.
Fig. 5.
Results of three grades white chrysanthemum using DFA
Table 4.
Prediction of white chrysanthemum grade using DFA
| Sample | Correct recognition number | Error recognition number | Recognition accuracy (%) |
|---|---|---|---|
| A1 | 9 | 1 | 90 |
| A2 | 7 | 3 | 70 |
| A3 | 10 | 0 | 100 |
BPNN was applied to predicting the white chrysanthemum grade in the research. The total 78 samples were divided into a training set (48 samples) and a testing set (30 samples). The seven sensors measurements obtained from the E-tongue were used for inputs. The number of hidden layer neurons was determined by trial and error, and set at 5. The output layer had one neuron to represent the sample grade. According to the number of inputs and outputs, the network topology was designed 7-5-1. The training repeated 1000 times. The results were shown in Table 5. The predicted accuracy of the sample A1 and A3 was 100%. There were two A2 samples incorrectly classified and its accuracy was 80%. The total recognition accuracy was 93.3%. In contrast with DFA, the predicted accuracy of the samples by BPNN was better.
Table 5.
The prediction results of unknown samples by BPNN model
| Sample name | Predicted correct number | Results false number | Correct rate (%) |
|---|---|---|---|
| A1 | 10 | 0 | 100 |
| A2 | 8 | 2 | 80 |
| A3 | 10 | 0 | 100 |
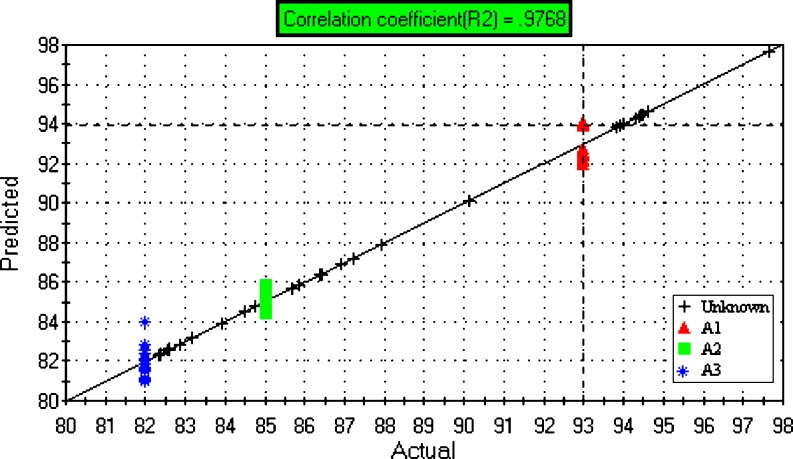
Figure 6 showed the relationship between the sensory scores obtained in gustatory sensation tests and the predicted scores calculated from the e-tongue measurement signals. The unknown samples were projected on the calibration curve. A strong positive correlation was found between the sensory score and the predicted score (correlation coefficient is 0.9768). Comparison results between the trained panelists and the E-tongue performance for discriminating white chrysanthemum grade were found in Table 6. The sensory scores of A1, A2 and A3 were 93, 85 and 82, respectively, while the predicted scores were 95, 87, 83. The predicted results were very close to the sensory results and the standard deviation of the former was smaller than that of the latter. Moreover, the test samples were correctly classified into the corresponding groups. So the e-tongue could be a useful tool for white chrysanthemum sensory evaluation.
Fig. 6.
Results of three grades white chrysanthemum using PLS
Table 6.
Evaluation of the white chrysanthemum grade made by the sensory panel and E-tongue
| Sample name | Sensory panel average score* | Std. Deviation | Predicted score | Std. Deviation |
|---|---|---|---|---|
| A1 | 93 a | 2.83 | 95 a | 1.12 |
| A2 | 85 b | 1.86 | 87 b | 1.49 |
| A3 | 82 c | 3.91 | 83 c | 1.42 |
*Score values within a column with different letters are significantly different (P ≤ 0.05)
Food quality has always been one of the most important issues in food industry. The E-tongue showed a good discriminating ability of different quality white chrysanthemum in this study and a potential application for identifying white chrysanthemum quality caused by other factors (such as processing technique, storage conditions, package materials, etc.).
At present, the pollutions from food surface packing materials have become an outstanding problem in the field of the controlling food quality safety. The European Commission is considering extension of the current legislation on plastics for food contact to surface coatings on cans. The chemical stability of surface package also have had sensorial effects on foods (Simal-Gandara et al. 1998). So it is very valuable to explore applying the E-tongue for the sensorial effects of package materials on white chrysanthemum in the further research.
Conclusion
The result of PCA showed the E-tongue could discriminate white chrysanthemum according to their grade, brand and adulteration without human experts and complex chemical analytical methods.
Most of the test samples were successfully classified into the corresponding categories using DFA and BPNN, and the recognition accuracy of BPNN was better than that of DFA. There was an adequate performance of the E-tongue for the sample sensory appraisement. A positive correlation was found between the sensory score and the predicted score (correlation coefficient is 0.9786) using PLS, and the samples were correctly classified.
Acknowledgement
The authors acknowledge the financial support of the Chinese National Foundation of Nature and Science through Project 30771246 and 31071548, the funded by Zhejiang Provincial Natural Science Foundation Z5100155 and the supported by Science Foundation of Chinese University.
References
- Apetrei C, Rodriguez-Mendez ML, De Saja JA. Modified carbon paste electrodes for discrimination of vegetable oils. Sensor Actuat B-Chem. 2005;111–112:403–409. doi: 10.1016/j.snb.2005.03.041. [DOI] [Google Scholar]
- Beullens K, Kirsanov D, Irudayaraj J, Rudnitskaya A, Legin A, Nicolai BM, Lammertyn J. The electronic tongue and ATR-FTIR for rapid detection of sugars and acids in tomatoes. Sensor Actuat B-Chem. 2006;116(1–2):107–115. doi: 10.1016/j.snb.2005.11.084. [DOI] [Google Scholar]
- Ciosek P, Brzozka Z, Wroblewski W. Classification of beverages using a reduced sensor array. Sensor Actuat B-Chem. 2004;103(1–2):76–83. doi: 10.1016/j.snb.2004.04.038. [DOI] [Google Scholar]
- Ciosek P, Brzozka Z, Wroblewski W. Electronic tongue for flow-through analysis of beverages. Sensor Actuat B-Chem. 2006;118(1–2):454–460. doi: 10.1016/j.snb.2006.04.051. [DOI] [Google Scholar]
- Fang XL, Wang XT, Huang SR, Li X. Effect of Chrysanthemum morifolium Ramat on apoptosis of bovine aortic smooth muscle cells. J Zhejiang Univ (Medical Sciences) (Chinese) 2002;31(5):347–350. doi: 10.3785/j.issn.1008-9292.2002.05.009. [DOI] [PubMed] [Google Scholar]
- Gallardo J, Alegret S, Valle M. Application of a potentiometric electronic tongue as a classification tool in food analysis. Talanta. 2005;66(5):1303–1309. doi: 10.1016/j.talanta.2005.01.049. [DOI] [PubMed] [Google Scholar]
- GB/T 18862–2008. National Standard of the People’s Republic of China (2008) Product quality-Hangzhou white chrysanthemum
- Hu CX, Ding L, Tang LL, Zhao JX. Effect of chrysanthemum extract on the resistance to fatigue and the level of serum lipid in mice. Food Sci (Chinese) 1996;17(10):58–62. [Google Scholar]
- Hu XW, Mao WF, He C, Zhang L, Huang XF, Du WD, Fang BL. Chrysanthemum morifolium Ramat sensitizesTNF-related apoptosis inducing ligand-induced apoptosis in human colon cancer cell line DLD-1. Chin J Pathophysiol. 2006;22(4):742–747. [Google Scholar]
- Huang SR, Zhang YT, Fang XL, Wang XT, Ling X. Effect of chrysanthemum extract on superoxide dismutase and malondialdehyde in cultural liquid of bovine vascular smooth muscle cells. Zhejiang Prev Med (Chinese) 2004;16(7):13–14. [Google Scholar]
- Ivarsson P, Holmin S, Hojer NE, Krantz-Rulcker C, Winquist F. Discrimination of tea by means of a voltammetric electronic tongue and different applied waveforms. Sensor Actuat B-Chem. 2001;76(1–3):449–454. doi: 10.1016/S0925-4005(01)00583-4. [DOI] [Google Scholar]
- Jackson JE. A user’s guide to principal components. New Jersey: Wiley; 2003. [Google Scholar]
- Jiang HD, Wang LF, Zhou XM, Xia Q. Vasorelaxant effect and underlying mechanism of EtOAc extract from Chrysanthemum morifolium in rat thoracic aorta. Chin J Pathophysiol. 2005;21(2):334–338. [Google Scholar]
- Kumar SPV, Basheer S, Ravi R, Thakur MS (2011) Comparative assessment of tea quality by various analytical and sensory methods with emphasis on tea polyphenols. J Food Sci Technol. doi:10.1007/s13197-010-0178-y [DOI] [PMC free article] [PubMed]
- Legin A, Rudnitskaya A, Vlasov Y, Di Natale C, Davide F, D’Amico A. Tasting of beverages using an electronic tongue. Sensor Actuat B-Chem. 1997;44(1–3):291–296. doi: 10.1016/S0925-4005(97)00167-6. [DOI] [Google Scholar]
- Legin A, Rudnitskaya A, Vlasov Yu, Di Natale C, Mazzone E, D’Amico A. Application of electronic tongue for qualitative and quantitive analysis of complex liquid media. Sensor Actuat B-Chem. 2000;65(1–3):232–234. doi: 10.1016/S0925-4005(99)00324-X. [DOI] [Google Scholar]
- Lvova L, Legin A, Vlasov Y, Cha GS, Nam H. Multicomponent analysis of Korean green tea by means of disposable all-solid-state potentiometric electronic tongue microsystem. Sensor Actuat B-Chem. 2003;95(1–3):391–399. doi: 10.1016/S0925-4005(03)00445-3. [DOI] [Google Scholar]
- Lvova L, Martinelli E, Mazzone E, Pede A, Paolesse R, Di Natale C, D’Amico A. Electronic tongue based on an array of metallic potentiometric sensors. Talanta. 2006;76(4):833–839. doi: 10.1016/j.talanta.2006.02.014. [DOI] [PubMed] [Google Scholar]
- Marin S, Vinaixa M, Brezmes J, Llobet E, Vilanova X, Correig X, Ramos AJ, Sanchis V. Use of a MS-electronic nose for prediction of early fungal spoilage of bakery products. Int J Food Microbiol. 2007;114:10–16. doi: 10.1016/j.ijfoodmicro.2006.11.003. [DOI] [PubMed] [Google Scholar]
- Moreno L, Merlos A, Abramova N, Jimenez C, Bratov A. Multi-sensor array used as an “electronic tongue” for mineral water analysis. Sensor Actuator B Chem. 2006;116(1–2):130–134. doi: 10.1016/j.snb.2005.12.063. [DOI] [Google Scholar]
- Parra V, Arrieta AA, Fernandez-Escudero JA, Garcia H, Apetrei C, Rodriguez-Mendez ML, De Saja JA. E-tongue based on a hybrid array of voltammetric sensors based on phthalocyanines, perylene derivatives and conducting polymers: Discrimination capability towards red wines elaborated with different varieties of grapes. Sensor Actuat B-Chem. 2006;115(1):54–61. doi: 10.1016/j.snb.2005.08.040. [DOI] [Google Scholar]
- Parra V, Arrieta AA, Fernandez-Escudero JA, Iniguez M, De Saja JA, Rodriguez-Mendez ML. Monitoring of the ageing of red wines in oak barrels by means of an hybrid electronic tongue. Anal Chim Acta. 2006;563(1–2):229–237. doi: 10.1016/j.aca.2005.09.044. [DOI] [Google Scholar]
- Raj D, Sharma PC, Vaidya D. Effect of blending and storage on quality characteristics of blended sand pear-apple juice beverage. J Food Sci Technol. 2011;48(1):102–105. doi: 10.1007/s13197-010-0098-x. [DOI] [PMC free article] [PubMed] [Google Scholar]
- Rudnitskaya A, Kirsanov D, Legin A, Beullens K, Lammertyn J, Nicolai BM, Irudayaraj J. Analysis of apples varieties—comparison of electronic tongue with different analytical techniques. Sensor Actuat B-Chem. 2006;116(1–2):23–28. doi: 10.1016/j.snb.2005.11.069. [DOI] [Google Scholar]
- Schumacher AB, Brandelli A, Macedo FC, Pieta L, Klug TV. Chemical and sensory evaluation of dark chocolate with addition of quinoa (Chenopodium quinoa Willd.) J Food Sci Technol. 2010;47(2):202–206. doi: 10.1007/s13197-010-0029-x. [DOI] [PMC free article] [PubMed] [Google Scholar]
- Shen WQ, Sun HY, Wang QM, Ma SL. Advances in studies on bioactive constituents and pharmacological activities of chrysthemum morifolium Ramat. J Tea (Chinese) 2006;32(3):141–144. [Google Scholar]
- Simal-Gandara J, Paz-Abuin S, Ahrne L. A critical review of the quality and safety of BADGE-based epoxy coatings for cans: Implications for legislation on epoxy coatings for food contact. Crit Rev Food Sci Nutr. 1998;38:675–688. doi: 10.1080/10408699891274345. [DOI] [PubMed] [Google Scholar]
- Tran TU, Suzuki K, Okadome H, Homma S, Ohtsubo K. Analysis of different the tastes of brown rice and milled rice with milling yields using a taste sensing system. Food Chem. 2004;88(4):557–566. doi: 10.1016/j.foodchem.2004.02.007. [DOI] [PubMed] [Google Scholar]
- Winquist F, Bjorklund R, Krantz-Rulcker C, Lundstrom I, Ostergren K, Skoglund T. An electronic tongue in the dairy industry. Sensor Actuat B-Chem. 2005;111–112:299–304. doi: 10.1016/j.snb.2005.05.003. [DOI] [Google Scholar]
- Wu JD, Ye SH. Driver identification based on voice signal using continuous wavelet transform and artificial neural network techniques. Expert Syst Appl. 2009;36:1061–1069. doi: 10.1016/j.eswa.2007.11.003. [DOI] [Google Scholar]


