

Abstract
Most studies of the early stages of visual analysis (V1-V3) have focused on the properties of neurons that support processing of elemental features of a visual stimulus or scene, such as local contrast, orientation, or direction of motion. Recent evidence from electrophysiology and neuroimaging studies, however, suggests that early visual cortex may also play a role in retaining stimulus representations in memory for short periods. For example, fMRI responses obtained during the delay period between two presentations of an oriented visual stimulus can be used to decode the remembered stimulus orientation with multivariate pattern analysis. Here, we investigated whether orientation is a special case or if this phenomenon generalizes to working memory traces of other visual features. We found that multivariate classification of fMRI signals from human visual cortex could be used to decode the contrast of a perceived stimulus even when the mean response changes were accounted for, suggesting some consistent spatial signal for contrast in these areas. Strikingly, we found that fMRI responses also supported decoding of contrast when the stimulus had to be remembered. Furthermore, classification generalized from perceived to remembered stimuli and vice versa, implying that the corresponding pattern of responses in early visual cortex were highly consistent. In additional analyses, we show that stimulus decoding here is driven by biases depending on stimulus eccentricity. This places important constraints on the interpretation for decoding stimulus properties for which cortical processing is known to vary with eccentricity, such as contrast, color, spatial frequency, and temporal frequency.
Introduction
Several lines of research suggest that the human brain has a specific cognitive system for holding information to be manipulated and executed: working memory. Visual short-term memory (VSTM) is a specific subtype that allows the robust maintenance of stimulus attributes such as contrast, orientation, spatial frequency, and speed with high fidelity (Luck and Vogel, 1997; Pasternak and Greenlee, 2005). Functional brain imaging has enabled the exploration of the anatomical and functional correlates underlying VSTM first discovered by neurophysiological techniques (Fuster, 1995; Braver et al., 1997; Pessoa et al., 2002; Curtis and D'Esposito, 2003). Although studies largely agree on the involvement of higher-level cortical areas in this cognitive process (Postle and D'Esposito, 1999; Haxby et al., 2000), there is still some controversy about the role of early visual cortex in working memory. Recent fMRI evidence suggests that early sensory areas may be involved in retaining stimulus representations, for example, of orientation (Pessoa et al., 2002; Serences et al., 2009) and spatial frequency (Greenlee et al., 2000; Baumann et al., 2008; Sneve et al., 2011). However, the sustained responses in early visual cortex may be related to visual attention rather than VSTM (Offen et al., 2009, 2010; Pooresmaeili et al., 2010). Harrison and Tong (2009) used multivariate pattern analysis (MVPA) to search for potential signatures of working memory for orientation in the pattern of fMRI responses in early visual areas. They found that remembered orientation could be decoded and that the same neural circuitry that mediates early visual processing (and perception) of orientation is also recruited during the working memory period.
The aim of our experiments was to determine whether a different stimulus property—the contrast of a stimulus—could be decoded using multivariate classification and if its representation was similar when subjects perceived and remembered stimuli. Most neurons in visual cortex show tight tuning for a preferred orientation and are distributed in discrete orientation columns. However, it is not known whether there is an orderly map or clustered spatial representation for contrast (Albrecht and Hamilton, 1982; Boynton et al., 1999; Heeger et al., 2000; Kastner et al., 2004). It is also unclear whether multivariate analyses can be used to decode this stimulus parameter and if its cortical representation is similar when subjects perceive and remember such stimuli.
The first experiment in this study shows that the stimulus contrast, as well as the orientation, of a perceived image can be decoded from event-related BOLD signals in early visual cortex. The second experiment demonstrates that the contrast of a remembered grating (during periods when no stimulus is displayed) can be also decoded from the BOLD responses in visual cortex. We further show that classifiers generalize between the two experiments and that classification accuracies were significantly higher for behaviorally correct than incorrect trials, indicating that signals from early visual cortex contribute significantly to VSTM of stimulus contrast. Our results also suggest that responses from incorrect trials add substantial noise to the contrast VSTM signals used in decoding.
Materials and Methods
Subjects.
Six observers (n = 5 male, n = 1 female) who were experienced in psychophysics and fMRI experiments and had normal or corrected-to-normal vision took part in this study. All gave written consent. The procedures were approved by the Medical School Research Ethics Committee at the University of Nottingham.
Functional MRI acquisition.
Each subject participated in at least two scanning sessions. In session one, a set of 10–12 functional scans was obtained to measure the retinotopic organization in early visual cortex, allowing us to functionally define V1, V2, and V3 with standard methods; in the same session, we also acquired high-resolution anatomical T1-weighted MPRAGE images of the whole brain for segmentation and cortical flattening. In the second (and later) sessions, we obtained fMRI data to perform decoding in the working memory and stimulus contrast paradigms.
MR imaging was performed at 3 T (Achieva; Philips Healthcare) using an eight-channel SENSE head coil. Foam padding was used to minimize head movements. During each session, we acquired several functional scans, including a scan for localizing regions of early visual cortex representing the stimuli and six to eight scans for the main tasks, alternating between scans in which we measured responses to perceived stimuli and scans using the working memory task. For BOLD fMRI, we used a standard T2* (gradient-echo) echo planar imaging pulse sequence (voxel size 3 × 3 × 3 mm3, TE = 35 ms, TR = 1500 ms, flip angle = 75°, FOV = 192 × 192 mm2). Thirty-two slices were oriented approximately perpendicularly to the calcarine sulcus. We used parallel imaging with an acceleration (SENSE) factor 2.
Registration, cortical segmentation, and flattening.
For flat mapping and visualization, we segmented T1-weighted anatomical images into gray matter, white matter, and CSF. Inflated and flattened parts of each hemisphere corresponding to early visual cortex were obtained using a combination of tools (FreeSurfer, Martinos Center for Biomedical Imaging, Massachusetts General Hospital, Harvard Medical School, Boston, MA; mrTools, Heeger lab, Department of Psychology and Center for Neuroscience, New York University, New York, NY; mrVISTA, Wandell lab, Department of Psychology, Stanford University, Stanford, CA) and programs included in the FSL distribution (FMRIB Software Library; Smith et al., 2004).
To register data from each session to the subject-specific, high-resolution, T1-weighted image, a set of low-resolution anatomical images covering the same volume as the functional images was acquired at either the beginning or the end of each scanning session (MPRAGE, 1.5 mm inplane, 3 mm slice thickness). These anatomical images and the functional images were then registered to the high-resolution anatomical whole-head volume (T1-weighted, 3D MPRAGE, 1 mm isotropic, TE = 3.7 ms, TR = 8.13 ms, FA = 8°, TI = 960 ms, and linear phase encoding order) using a robust image registration algorithm (Nestares and Heeger, 2000).
Visual stimuli.
In all experiments, the stimuli were generated on an Apple MacBook Pro running MATLAB (MathWorks) and the MGL toolbox (http://gru.brain.riken.jp/doku.php/mgl/overview). In the fMRI experiments, stimuli on a homogenous gray background were projected from an LCD projector onto a display screen at the feet of our subjects. The display resolution was 1024 × 768 pixels, covering 20.4° (width) × 15.4° (height) of visual angle. Subjects were in the supine position in the scanner bore and viewed the display through an angled mirror. They were asked to maintain fixation at a red cross at the center of the screen during functional MRI scans and performed a task in all scans to control attention (see below). All of the stimuli in the two experiments were moving sinusoidal gratings (spatial frequency, 0.75 cycles/°; temporal frequency, 2 Hz) presented in a circular aperture with a radius of 5°, centered at fixation.
Retinotopic mapping session.
Early visual areas (V1, V2, and V3) for each subject were identified in a retinotopic mapping session based on the standard traveling-wave method using rotating wedges and expanding rings (Engel et al., 1994; DeYoe et al., 1996; Engel et al., 1997; for review, see Wandell et al., 2007). The responses to the rings and wedges were used to estimate the eccentricity and polar angle of the visual field representation, respectively. Following standard methods, areas V1, V2, and V3 were defined in our subjects using the phase reversals in the polar angle maps to locate the upper, lower, and horizontal meridian representations.
Localizer scans.
During each functional imaging session of the main experiment, we obtained two brief localizer scans (at the beginning and end of each session) to identify voxels within V1-V3 corresponding to the retinotopic stimulus locations. We used these to restrict the V1-V3 regions of interest (ROIs). Each localizer scan lasted 4 min (160 time points) and consisted of grating stimuli and gray background alternating in a simple block design between 12 s “on” and 12 s “off” (fixation). During the on period, we presented 8 1.5 s epochs of moving gratings each with a random direction of motion and at 1 of 5 contrast levels (Michelson contrasts of 10%, 30%, 50%, 70%, and 90%). For gamma correction, we used a psychophysical motion-nulling procedure (Ledgeway and Smith, 1994; Ledgeway and Hess, 2002) to make sure that contrast stimuli would be faithfully reproduced on the LCD projector display at the MRI scanner and on a CRT display in the psychophysics laboratory.
Experiment 1: contrast response measurements.
To measure the responses in early visual cortex to the stimuli, we presented moving gratings (orientation 45° or 135°; spatial frequency, 0.75 cycles/°; temporal frequency, 2 Hz, same 5 contrast levels used in the localizer scan) in an event-related design. Stimuli were presented in random order (preceded by 1.5 s of fixation to equate for conditions in the working memory scans). Each stimulus lasted 1.5 s and subjects were asked to respond as quickly as possible to their offset by pressing a button to maintain a constant attentional state.
Experiment 2: working memory scans.
Consistent with the experimental paradigm used by Harrison and Tong (2009), we used an event-related design in which each trial comprised visual stimuli presentation, a retention period, and a test interval (Fig. 1). The same stimulus parameters were used as before except that there were only two levels of contrast in this experiment. During the stimulus presentation at the beginning of each trial, two gratings with different contrasts (30% and 70%) were presented sequentially. Each grating presentation (in a circular aperture of radius 5° centered at fixation) was accompanied by a small text label (“1” or “2”) rendered in red and displayed with a small offset from the fixation cross; the assignment of the label to the higher or lower contrast grating was randomized on each trial. The orientation of both gratings in each trial was chosen to be either 45° or 135°, but remained constant throughout the trial. After the presentation of the two sample stimuli, the numeric cue indicated which of the two contrast stimuli the subjects should remember and retain in memory for the delay period (fixed, 8.4 s). Finally, at the end of each trial, a matching grating (contrast ± 20% of the to-be-remembered grating) was displayed and the subjects were asked to indicate with a press of a button whether the remembered (sample) or matching grating had the higher contrast.
Figure 1.

Visual working memory task performed by subjects in the scanner. On each trial, two grating stimuli of different contrasts were presented for 1.5 s each, separated by 300 ms. Each stimulus was labeled by a number (“1” or “2,” close to the fixation cross, order randomized). There followed a 300 ms period during which subjects were cued to remember the grating/contrast corresponding to the given text label. The delay period during which subjects had to retain information in working memory was 8.4 s and was followed by a comparison stimulus, which differed in terms of contrast from the grating to be remembered by up to 20%. In a two-interval forced choice setting, subjects had to respond by pressing a button whether the remembered stimulus or the comparison stimulus had higher contrast. The next trial started after an intertrial interval of 4.5–7.5 s.
fMRI response time courses.
Imaging data were analyzed using a combination of custom-written software (mrTools, Heeger lab, Department of Psychology and Center for Neuroscience, New York University, New York, NY; mrVISTA, Department of Psychology, Stanford University, Stanford, CA) running in MATLAB 7.4. fMRI data were motion corrected using a robust motion correction algorithm (Nestares and Heeger, 2000), high-pass filtered (cutoff, 0.01 Hz) to remove slow signal drift, and converted to percent signal change.
Standard event-related analysis methods (Burock et al., 1998; Dale, 1999; Burock and Dale, 2000) were used to reconstruct the time course of fMRI response for each trial type at each voxel with no predefined assumption of the hemodynamic response function. Details of the methodology have been reported in detail previously (Gardner et al., 2005; Brouwer and Heeger, 2009; Sanchez-Panchuelo et al., 2010). Briefly, we estimated—voxelwise—the best-fitting (least-squares) event-related time course for each stimulus condition. To estimate the goodness-of-fit of the linear model prediction, we calculated the amount of variance explained in the original time course for each voxel by our model (r2). The average fMRI time series was then computed over all voxels within an ROI (Fig. 2A) that met a threshold r2 of 0.2. This average time series (calculated from a fixed number of voxels per ROI) was then used for further analyses.
Figure 2.

Retinotopic mapping and event-related responses in early visual cortex. A, Example retinotopic maps from one subject. Information from visual angle and eccentricity measurements were used to define V1, V2 (ventral + dorsal), and V3 (ventral + dorsal). B, Event-related fMRI responses as a function of visual stimulus contrast in V1 of one subject. Gray lines indicate the estimated event-related responses for low (light-gray) to high (dark gray) contrast. Error bars indicate SEM across trials. Inset: fMRI contrast-response curves in V1 (red), V2 (green), and V3 (blue) for this subject; symbols, amplitude of measured fMRI response; lines, nonlinear least-squares fit to data (Naka-Rushton). C, Event-related responses from the working memory experiment. Plot shows average responses in V1 during trials in which the remembered contrasts were 0.3 and 0.7, respectively (mean ± SEM across subjects). The curves show a typical pattern of response with a large transient after the presentation of the two stimuli and cue at fixation at the beginning of each trial, followed by a reduced response during the delay period and another transient increase in response after the presentation of the comparison stimulus.
For Experiment 1 (contrast response measurements), we used the maximum values (± 1 time point) of the average event-related fMRI response for each trial type (Fig. 2B, inset) to plot contrast-response curves to estimate the increase in fMRI responses in each ROI with stimulus contrast. For Experiment 2 (the VSTM-for-contrast experiment), we ascertained that there were no systematic response amplitude differences in the average event-related fMRI response between the two trial types in the ROIs because this could be a potential confound for the multivariate classification analysis (Fig. 2C).
MVPA.
MVPA was used to analyze data from both experiments. Classification was performed with a linear support vector machine (SVM) implemented in custom-written MATLAB functions.
Each measurement (trial) of fMRI response for a different stimulus condition (class) at different voxels corresponds to a point in a high-dimensional pattern space. We obtained each point (which could also be considered a spatial pattern of response) by averaging several time points of the fMRI responses in a single trial taking into account the sluggishness of the hemodynamic response. For the remembered-contrast experiment, we also took care to avoid possible temporal overlap of the BOLD response during the memory period with that evoked by the second (comparison) interval in each trial. For the contrast response measurements, data were sampled and averaged across three time points (TRs) centered on the peak response in each trial to account for with variability in the hemodynamic delay for each subject. For the working memory task, the time points corresponding to the retention period after the stimulus presentation (TRs 5–7, which were 7.5–10.5 s after stimulus onset) for each subject were selected and averaged to maximize the coverage of the memory period (Harrison and Tong, 2009). Therefore, an m × n matrix served as the input for the classification analysis, where m is the number of trials and n is the number of voxels included in the analysis.
A linear SVM provides optimal parameter values (weights and bias) for a hyperplane to categorize two classes of data (collected under two different stimulus conditions) within such an N-dimensional space. To access how generalizable the classification was, we tested our analysis with a 10-fold (or 5-fold) cross-validation scheme with the two classes approximately matched in each fold: 90% (80%) of data were used to train a classifier and the remaining, hold-out 10% (20%) of data to test. To maximize the number of samples, we did not average trials before classification. We report the mean classification accuracy across these 10 (5) folds.
For classification of the contrast response data (which had five stimulus classes), we trained the model on pairs of stimulus classes using part of the data and then used it to predict one of the two contrast levels with the rest of data. The best-predicted label for each class was chosen by a winner-take-all rule. Trials in which the stimulus type was mislabeled were considered as errors in this particular analysis.
The statistical significance of the observed classification accuracies for each subject was assessed by a binomial test, considering the probability of correctly labeled test examples of all the independent testing data points is given by the binomial distribution (p < 0.05; null hypothesis: stimulus class cannot be predicted because the classifier was performing at chance, 50%). Statistical significance across subjects was assessed with a t test (two-tailed, p < 0.05).
Results
Contrast-response functions
We first performed a control experiment to determine how reliable the information in the human early visual areas was for decoding the contrast of visually presented stimuli in a task that did not involve a VSTM component. The responses to stimuli with different contrasts were measured and the time courses for these different stimulus conditions (averaged across all voxels in V1, V2, and V3 that met a threshold r2 of 0.2, respectively) were examined. Figure 2B shows the response time courses in V1 of one subject for gratings at five different contrast levels with a systematic increase in the overall fMRI response with increasing contrast. The same pattern of response was found across all the other observers. We obtained contrast-response functions (Fig. 2B, inset; curve fit: standard Naka-Rushton function) by averaging the peak response amplitude for each contrast level in a time window around the peak response (±1 time point). The aim of this control experiment was primarily to confirm that, for the stimuli we used, the measured fMRI responses were not at floor or ceiling levels.
Experiment 1: multivariate classification of stimulus contrast
To establish whether the fMRI responses in V1-V3 contain consistent information about the contrast of the stimuli beyond that conveyed in the mean time course across all voxels in the ROI, we studied the pattern of responses using multivariate classification analysis. Classification accuracies in V1 and V2 ROIs were all significantly above chance across our group of subjects (Fig. 3A). To ensure that the pattern of results in the classification accuracies obtained did not depend critically on our choice of voxel number, we performed the following analysis. We randomly selected a range of 2–210 voxels (in increments of 15) from the 210 candidate voxels in each V1, V2, and V3 and performed the classification analysis with this subset of features. We then repeated this analysis in 100 bootstrapped replications for each subject and plotted classification accuracy as a function of the number of voxels included. The inset in Figure 3A shows the mean (±1 SEM) for data in V1 across six subjects, indicating that there were small differences in classification accuracy that depend on voxel number but that, importantly, the overall pattern of results remained consistent. (The dashed line indicates the classification accuracy for n = 180 voxels, the lowest common number of voxels available across ROIs and subjects rounded down to a multiple of 10).
Figure 3.

A, Five-way classification for perceived contrast data across different ROIs. Plots show mean ± 1 SEM across subjects. The dashed line indicates the classification accuracy for n = 180 voxels, the lowest common number of voxels available across ROIs and subjects rounded down to a multiple of 10. B, Pairwise classification based on the difference of contrast levels in V1 averaged across subjects. Error bars indicate SEM across subjects. Colors indicate various contrast differences. C, Illustration of ROC and measured area under curve (AUC) for pairwise classification. Top left: Distributions for fMRI response to 10% (red curve) and 90% (black curve) contrast. Vertical line corresponds to the criterion used for classification of trials of two contrast levels. Trials on the right of this line were labeled as 90% contrast, within which trials classified as high contrast was referred as hits (gray area). Because the curves overlap, some trials corresponding to 10% contrast were also greater than the criterion and labeled incorrectly as 90% contrast, thus contributing to the proportion of false positives (red area). Bottom right: ROC curve is plotted with the false-positive rates on the x-axis and the hit rates on the y-axis with different criteria. Black dot corresponds to the criterion shown in the upper graph. Red line indicates the chance performance of classification for 10% and 90% contrast. Gray area indicates the area under ROC curve. D, Comparison between proportion correct for pairwise discrimination using only the mean response (area under ROC curve obtained using signal detection theory with the method illustrated in Fig. 3C) and classification accuracy from multivariate analysis in different ROIs. Size of symbols indicates all pairwise comparisons of trials with a given difference in contrast. Color of symbols indicates the ROI used in the analysis. Diagonal line illustrates equivalence of multivariate classification and classification on the mean response in the ROI. Shaded area indicates the cutoff for chance level (50%) performance.
We expected that correctly classifying trials with large contrast differences should be easier than for small contrast differences. To test this, we performed a finer grained analysis of the pairwise classifications that contributed to the five-way classification. In four separate analyses, we split trials into groups according to their differences in linear contrast (Δ = 0.2, 0.4, 0.6, 0.8). Note that the number of trials that could be included in the analysis therefore differed, ranging from all trials for the pairwise analysis of trials with small contrast differences (Δ = 0.2) to only the lowest and highest contrast trials for the pairwise analysis with a contrast difference of 0.8. The pattern of prediction accuracies for V1 is shown in Figure 3B. Classification accuracies between trials increased with the difference in contrast between the grating patterns regardless of the stimulus orientation. V2 and V3 showed the same dependence on the difference in stimulus contrast.
Because the classification analysis could potentially have been driven mainly by differences in the mean response level across different stimulus conditions, we also performed a control analysis in which we classified trials only using the mean response level across the ROI. Figure 3C illustrates how we calculated the receiver operating characteristic (ROC) and measured the area under curve for each of the possible pairwise comparisons. We constructed histograms of the mean fMRI response in the ROI for two classes of trials, which we expected to have a different mean across trials. For example, the top panel in Figure 3C shows the distribution of response amplitudes for trials with 10% contrast (class 1, red line) and 90% contrast (class 2, gray curves). Following the logic of a standard signal-detection theory analysis, we set a criterion level and estimated the proportion of trials from the two distributions that fell above that criterion level. This corresponds to the proportion of “hits” (or correct labelings) and “false alarms” (or incorrect labelings), respectively. Considering the proportion of hits and false alarms at different criterion levels, we could construct the ROC curve. The area under the ROC curve is equivalent to the proportion correct that could be achieved in two-way categorization given the distribution of fMRI responses for the two classes of stimuli (Macmillan and Creelman, 2005).
Interestingly, although the classification performance improved as the contrast difference between the two gratings increased, those obtained by only considering the mean response were consistently worse than those obtained by multivariate classification. This indicates that there is significant categorical information present in the pattern of responses that is not captured in the ROI mean, which can be exploited by using multivariate methods.
The scatter plot in Figure 3D summarizes the data for the four different levels of contrast difference and four different ROIs. For all pairwise comparisons of trials with a given difference in contrast (size of symbols) in all of the ROIs we considered (color of symbols), multivariate classification outperformed classification based solely on the mean response in the ROI.
Experiment 2: multivariate classification of remembered contrast
In the second part of the study, we addressed whether BOLD responses in early visual cortex could be used to classify the remembered stimulus contrast of a pattern. We recorded the BOLD responses when two levels of contrasts (“low,” 30% or “high,” 70%) were remembered. Average time courses in V1 for the two types of trials across six subjects showed no apparent differences between the responses during trials when subjects had to remember the low or high contrast pattern (Fig. 2C). All subjects' responses across V1, V2, and V3 in this task showed a similar profile.
The first transient increase in the event-related responses follows the presentation of the sample gratings and cue at the beginning of each trial. The second transient response corresponds to the presentation of the test grating. The period in between corresponds to the interval during which subjects had to remember the contrast of the grating to allow them to perform the task. We averaged the four time points in this time window (see Materials and Methods) and used these data as input for our classification analysis.
Using multivariate classification, we could successfully categorize the remembered contrast trials with accuracies significantly above chance level, as shown in Figure 4A. This result was consistent across data from early visual areas V1 and V2. Results for V3 showed a similar trend, but failed to reach significance.
Figure 4.

A, Proportion correct classification (30% contrast vs 70% contrast) from delayed periods in the working memory task. Error bars indicate SEM across subjects. B, Predictions of remembered contrast levels using correct versus incorrect trials. Data were combined across (n = 4) subjects. Error bars indicate SEM across subjects. Colors and dark bars indicate the use of only correct trials; lighter bars, only incorrect trials. C, Generalization performance. Dark gray bars show performance when the classifier from Experiment 1 (perceived contrast) was used to decode which contrast was remembered in Experiment 2 (remembered contrast). Light gray bars show performance generalization by a classifier from Experiment 2 (remembered contrast) to Experiment 1 (perceived contrast). Error bars indicate SEM across subjects. D, Generalization from perceived to remembered stimuli is most consistent when contrast for training and test data are matched (black bars). Error bars indicate SEM across subjects. *p < 0.05, two-tailed t test.
Analysis of correct/incorrect trials
We also split the fMRI data according to behavioral performance on each trial and considered classification accuracies separately for correct and incorrect trials, respectively. This analysis revealed that decoding remembered contrast levels from early visual cortex was significantly better when subjects had correctly remembered the stimuli (Fig. 4B, n = 4 subjects for whom there was a sufficient number of incorrect trials to perform the analysis). This suggests that the pattern of fMRI responses was more consistent and reproducible across “correct” trials than “incorrect” trials, indicating an increased consistency of response patterns that leads to higher classification accuracies. The behavioral performance of our subjects in the working memory task for contrast indicated that the participants performed the task reliably. There was no significant difference in performance for maintaining in memory a pattern with a contrast of 30% compared with a grating with a contrast of 70% (74.1% correct vs 73.8% correct; t(6) = 0.471), implying that task difficulty was nearly matched across the two conditions. This may indicate that errors are more related to memory lapses or the inability to respond in time rather than difficulties with encoding the contrast level during the presentation of the sample pattern.
Generalization analysis
To further examine the role of early visual areas in maintaining a working memory representation for contrast, we tried to predict the remembered contrast during the memory task (30% and 70% contrast) using the SVM classifier trained with the data collected during (control) Experiment 1. If the response patterns of perceived stimuli could be generalized to those of remembered stimuli successfully, this could provide additional evidence to implicate the function of early visual cortex in short-term memory for contrast.
To match the amount of data used in training and test of classification, the following 10-fold cross-validation procedure was used: 90% of data samples from Experiment 1 were used to train an SVM classifier, whose ability to classify was tested with 10% of data from Experiment 2 (working memory). Classification accuracies in this analysis were above chance for V1 and V2, with a similar trend for V3 (Fig. 4C).
In the converse analysis, training on memory trials and then testing on data from perceived stimuli, performance also exceeded chance level for V1. We also found that generalization from perceived to remembered stimuli was most consistent when the contrast for training and test data were matched (Fig. 4D, black bars) and were reduced to chance for increasingly dissimilar training stimuli. These results provide compelling evidence that the patterns of response in early visual cortex associated with subjects performing the VSTM task and perceiving stimuli are highly similar, although it does not imply a causal role of these responses in visual working memory.
Spatial pattern of responses underlying contrast decoding
To characterize the spatial pattern of responses that underlie decoding in our experiment, we subdivided the visual areas into two sets of ROIs: one set based on the eccentricity measurements from retinotopic mapping into a central (0.5°–2.5° eccentricity) and an eccentric ROI (2.5°–5°). Figure 5 shows results from V1. As a control, we also defined a second set of ROIs corresponding to the upper and lower visual field, which subdivided V1 orthogonally to the central/eccentric split. We compared the responses in these ROIs in two ways. First, we plotted the contrast-response functions for the two sets of ROIs (Fig. 5C,D) and, second, we used the mean time course from the two respective ROIs to create two supervoxels (Freeman et al., 2011), which could then be used in the classification analyses.
Figure 5.
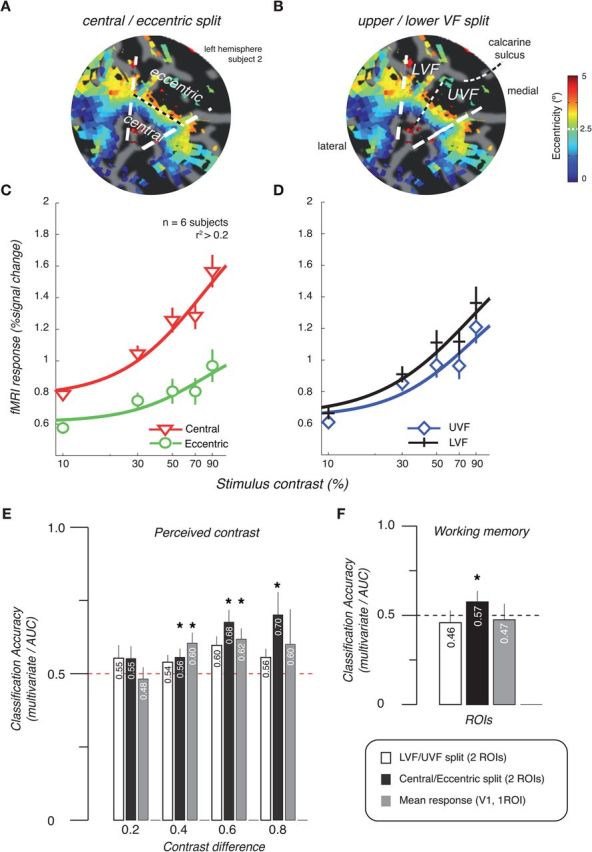
Spatial pattern of fMRI responses that drive classification. A, B, Flat map of visual cortex from one subject showing definition of central/eccentric and lower/upper visual field ROIs for V1. White dashed lines indicate borders between V1 and V2v/V2d. C, D, FMRI response as a function of stimulus contrast. Contrast response curves from the central/eccentric split ROIs (C) and the upper/lower visual field split ROIs (D). Symbols indicate the mean across six subjects. Error bars indicate the SEM across subjects. E, Classification accuracies by contrast difference in stimuli for the perceived contrast experiment using lower/upper visual field (LVF/UVF) split ROIs (white), central/eccentric split ROIs (black), and the mean response across all voxels included in the V1 ROI (gray) (Fig. 3B). Mean across subjects is shown. Error bars indicate the SEM across subjects. F, Classification accuracies for decoding of remembered contrast. For multivariate classification, accuracies represent cross-validated values obtained with linear SVM. For classification on mean time course across ROI, accuracies represent area under ROC curve (Fig. 3C). *p < 0.05, two-tailed t test.
The contrast-response curves are clearly different for the two splits (Fig. 5C,D), showing a consistent response difference for central/eccentric but not the upper/lower visual fields. (Note that increasing the number of supervoxels to four had no appreciable effect on the pattern of results as seen in Fig. 6). Next, we used the responses in the two sets of supervoxels to show that the differences at this large scale can drive classification of perceived contrast, even when only two features are considered. If the supervoxels are constructed from a central/eccentric split, classification is possible; if, however, data are reduced to two supervoxels corresponding to the upper and lower visual fields, classification accuracies drop to chance (Fig. 5E).
Figure 6.

Robustness of spatial patterns that drive classification (controls). A, B, Classification accuracies by contrast difference in stimuli for the perceived contrast experiment. FMRI responses were averaged in two (A) or four (B) partitions of voxels split according to their eccentricity (black lines, symbols), visual field segment (dark gray), or by random sampling from all voxels in the V1 ROI (light gray). Averaging data into two or four supervoxels within restricted eccentricity bands (dark gray lines) clearly preserves classification accuracies, whereas averaging within visual field (angle) segments or randomly across voxels in V1 does not. C, Classification accuracies for the working memory trials obtained with fMRI responses averaged as in A and B. Symbols indicate the mean across n = 6 subjects. Error bars indicate ± 1 SEM.
The corresponding analysis for data from the visual working memory experiment shows that an eccentricity bias also drives the classification in the working memory experiment (Fig. 5F), suggesting that inhomogeneity in the spatial pattern of visual cortex responses—potentially driven by a feedback signal or attention—underlies the memory “decoding.”
Discussion
A wealth of studies have confirmed that multivariate classification can be used to decode basic features of visual stimuli and even to predict attended stimulus features, in particular the orientation of gratings (Haynes and Rees, 2005; Kamitani and Tong, 2005, 2006; Mannion et al., 2009; Sapountzis et al., 2010; Swisher et al., 2010). However, there is substantial debate concerning the source of the underlying signal supporting this decoding both for stimulus orientation (Freeman et al., 2011) and other stimulus parameters (Kriegeskorte, 2009).
Here we show that fMRI responses in early visual cortex can also be used to reliably decode the stimulus contrasts presented to the subject. The ability to classify trials with different contrast levels is in itself unsurprising because there is a well known shift in mean response level with increasing contrast, which has previously been well characterized in early visual cortex (Albrecht and Hamilton, 1982; Ohzawa et al., 1985; Boynton et al., 1999; Reich et al., 2001; Gardner et al., 2005). Most neurons in early visual cortex exhibit a monotonic increase in response as a function of contrast, but some cells show very different patterns of response saturation (and even supersaturation) with contrast (Ledgeway et al., 2005; Peirce, 2007; Hu and Wang, 2011). However, unlike stimulus orientation, there is no known columnar organization for neurons with similar contrast-response functions. Nonetheless, despite the lack of orderly clustering in structure, there may still be spatially local inhomogeneous changes in the fMRI responses to contrast. Using a multivariate classification analysis that does not take into account shifts in the mean response in the ROI therefore cannot untangle whether the ability to classify is simply due to a global shift in the neuronal response or to redistribution of a differential signal.
In a more fine-grained analysis, we therefore evaluated multivariate classification between stimuli at pairwise contrast levels and the predicted performance using a univariate (signal detection type) analysis using only the average response in each ROI. We found that multivariate classification became increasingly accurate with larger contrast differences in the stimuli (Fig. 3B; Smith et al., 2011). Even trials close in contrast could be discriminated using SVM, where just considering the mean response in the ROI failed to classify trials correctly. This further supports MVPA's increased sensitivity compared with univariate methods (Kriegeskorte et al., 2006).
These results suggest that a spatially specific response pattern to different contrasts can drive improved classification performance. To characterize the spatial pattern (and scale) of responses underlying this multivariate contrast decoding, we subdivided the visual areas into two sets of ROIs: one based on eccentricity measurements from retinotopic mapping corresponding to a central and an eccentric portion of our stimuli, because contrast sensitivity is known to change as a function of eccentricity (Legge and Kersten, 1987). As a control, we also defined another set of ROIs corresponding to the upper and lower visual fields, where such asymmetries might be less pronounced. We found that even when we reduced the multivariate fMRI responses to only two features, responses in a central and eccentric ROI, classification was possible. Our results do not, however, address directly whether information is present only at the level of a coarser scale (eccentricity) map or also at fine columnar architecture, an issue currently the subject of much debate (Gardner et al., 2008; Op de Beeck et al., 2008; Gardner, 2010; Swisher et al., 2010; Freeman et al., 2011; Beckett et al., 2012).
To determine whether MVPA could also be used to probe the mechanisms underlying working memory of stimulus contrast, we analyzed fMRI responses during a delay period in a visual working memory task. Given previous findings (Ester et al., 2009; Harrison and Tong, 2009) that a significant working memory trace exists for specific orientations in early visual cortex, we investigated whether a similar result holds for contrast.
We found that information in the fMRI responses during working memory trials could be used to decode whether a low-contrast or high-contrast visual pattern was retained in memory.a Interestingly, there was no significant difference in mean response in early visual cortex when subjects remembered a low-contrast versus a high-contrast stimulus, suggesting that overall response level is not the representation used for remembering contrast. The pattern of fMRI responses in early visual cortex, however, contained sufficient information to decode trials into the two categories. This result is consistent with Offen et al. (2009), who proposed an explanation for the absence of (mean) delay period activity in early visual areas during working memory tasks: opposing excitatory and inhibitory responses from different subpopulations of neurons in these regions may effectively cancel each other in the average BOLD signal. Any delay period activity in early visual cortex may therefore be obscured in individual voxels or the mean responses across ROIs.
To address the key issue of whether the pattern of fMRI responses obtained when subjects perceived a given stimulus contrast is similar to when they remembered it, we assessed the ability of our classifiers to generalize across the different tasks (Kamitani and Tong, 2005, 2006; Dinstein et al., 2008; Kay et al., 2008; Brouwer and Heeger, 2009; Harrison and Tong, 2009). In Harrison and Tong's (2009) study, they predicted which of two orientations were retained in memory with a classifier trained on data from visual activity patterns induced by unattended gratings. In the present study, generalization was tested by comparing classification with perceived versus remembered stimulus contrasts. We found that classification generalized both from perceived to remembered and vice versa, strongly suggesting that the representation of information in early visual cortex (specifically V1) is similar for both tasks.
Intriguingly, when we reduced the multivariate responses into those of two supervoxels corresponding to a central and an eccentric portion of our stimuli, classification of remembered contrasts was still possible. This suggests that a large-scale bias with eccentricity can drive classification for remembered as well as perceived stimuli.
Moreover, we observed a strong dependence of classification performance on the behavioral performance of our subjects, which is consistent with previous reports (Williams et al., 2007; Scolari and Serences, 2010). When trials were split according to correct and incorrect behavioral performance, we found that classification accuracies for correct trials were significantly higher than for incorrect trials. This suggests that the pattern of responses in early visual cortex is more consistent and repeatable across correct trials than incorrect trials. If multivariate classification analysis relies on signals directly related to neural activity supporting working memory function, then this increased consistency in fMRI responses may correspond to decreased noise and a more reliable neural signal. Activity in early visual cortex during incorrect trials may be more inconsistent, because there are several different reasons for making errors, causing more variability across trials: lapses in attention, eye blinks, failure to encode or retain the matching stimulus, and finger (response) errors.
Some studies suggest that both task-relevant and task-irrelevant features may be encoded together in VSTM (O'Craven et al., 1999; Wheeler and Treisman, 2002), whereas others have argued for a task-selective activity pattern in primary visual cortex (Woodman and Vogel, 2008; Serences et al., 2009). One previous fMRI experiment used color or orientation as selected features to evaluate prediction accuracy of MVPA in a working memory task (Serences et al., 2009). That study found a significant change of performance when subjects' attention was switched between the alternate features in different runs. Here, we did not test directly whether the information from two orientations that were task irrelevant were retained in memory (subjects only judged stimulus contrast), but, like others (Serences et al., 2009), we used two primary stimulus attributes (orientation and stimulus contrast) to reduce adaptation effects across trials.
Our study shows that fMRI responses in early visual cortex could be used to decode the contrast of a perceived stimulus (Experiment 1) and that responses in these areas also supported the classification of contrast when the stimulus only had to be remembered (Experiment 2). Classifiers trained on data from each experiment generalized to the other, suggesting that signals in early visual cortex are significantly modulated during working memory for stimulus contrast on the timescale of seconds and that the same signals are present during perception and memory for this stimulus property. We found that a large-scale bias in the responses with eccentricity can drive classification for remembered as well as perceived stimuli, raising the possibility that a consistent attentional or feedback signal, rather than activity related to working memory per se, may underlie the significant (but modest) classification accuracies reported.
Finally, we found substantially improved pattern classification when we compared data from correct and incorrect trials. When we considered only data from correct trials for classification, accuracies approximately matched subjects' behavioral performance. This highlights the fact that fMRI responses from incorrect trials add substantial noise to the contrast VSTM signals used in decoding, an important consideration for future studies.
Footnotes
The work was supported by the Wing Yip Charitable Trust, the Fund for Women graduates, and a Chinese Student Award from The Great Britain-China Educational Trust. Y.X. was supported by a studentship from the School of Psychology and the International Office of The University of Nottingham. We thank the members of the Visual Neuroscience Group for helpful discussions on the experiments and three referees for their insightful comments and suggestions.
aIt should be noted that the experimental design used here (consistent with Harrison and Tong's paradigm) is not ideally suited to estimate sustained delay period activity because the delay duration is fixed (see Schluppeck et al., 2006 for discussion) and by necessity always follows a cue directly. Exact estimation of delay period activity in such a paradigm is therefore ill posed. However, to the extent that sustained delay period activity can be estimated, there was variability across our six subjects in the amount of sustained response, which is in agreement with previous reports (Harrison and Tong, 2009).
References
- Albrecht DG, Hamilton DB. Striate cortex of monkey and cat: contrast response function. J Neurophysiol. 1982;48:217–237. doi: 10.1152/jn.1982.48.1.217. [DOI] [PubMed] [Google Scholar]
- Baumann O, Endestad T, Magnussen S, Greenlee MW. Delayed discrimination of spatial frequency for gratings of different orientation: behavioral and fMRI evidence for low-level perceptual memory stores in early visual cortex. Exp Brain Res. 2008;188:363–369. doi: 10.1007/s00221-008-1366-0. [DOI] [PubMed] [Google Scholar]
- Beckett A, Peirce JW, Sanchez-Panchuelo RM, Francis S, Schluppeck D. Contribution of large scale biases in decoding of direction-of-motion from high-resolution fMRI data in human early visual cortex. Neuroimage. 2012;63:1623–1632. doi: 10.1016/j.neuroimage.2012.07.066. [DOI] [PubMed] [Google Scholar]
- Boynton GM, Demb JB, Glover GH, Heeger DJ. Neuronal basis of contrast discrimination. Vision Res. 1999;39:257–269. doi: 10.1016/S0042-6989(98)00113-8. [DOI] [PubMed] [Google Scholar]
- Braver TS, Cohen JD, Nystrom LE, Jonides J, Smith EE, Noll DC. A parametric study of prefrontal cortex involvement in human working memory. Neuroimage. 1997;5:49–62. doi: 10.1006/nimg.1996.0247. [DOI] [PubMed] [Google Scholar]
- Brouwer GJ, Heeger DJ. Decoding and reconstructing color from responses in human visual cortex. J Neurosci. 2009;29:13992–14003. doi: 10.1523/JNEUROSCI.3577-09.2009. [DOI] [PMC free article] [PubMed] [Google Scholar]
- Burock MA, Dale AM. Estimation and detection of event-related fMRI signals with temporally correlated noise: a statistically efficient and unbiased approach. Hum Brain Mapp. 2000;11:249–260. doi: 10.1002/1097-0193(200012)11:4<249::AID-HBM20>3.0.CO;2-5. [DOI] [PMC free article] [PubMed] [Google Scholar]
- Burock MA, Buckner RL, Woldorff MG, Rosen BR, Dale AM. Randomized event-related experimental designs allow for extremely rapid presentation rates using functional MRI. Neuroreport. 1998;9:3735–3739. doi: 10.1097/00001756-199811160-00030. [DOI] [PubMed] [Google Scholar]
- Curtis CE, D'Esposito M. Persistent activity in the prefrontal cortex during working memory. Trends Cogn Sci. 2003;7:415–423. doi: 10.1016/S1364-6613(03)00197-9. [DOI] [PubMed] [Google Scholar]
- Dale AM. Optimal experimental design for event-related fMRI. Hum Brain Mapp. 1999;8:109–114. doi: 10.1002/(SICI)1097-0193(1999)8:2/3<109::AID-HBM7>3.0.CO%3B2-W. [DOI] [PMC free article] [PubMed] [Google Scholar]
- DeYoe EA, Carman GJ, Bandettini P, Glickman S, Wieser J, Cox R, Miller D, Neitz J. Mapping striate and extrastriate visual areas in human cerebral cortex. Proc Natl Acad Sci U S A. 1996;93:2382–2386. doi: 10.1073/pnas.93.6.2382. [DOI] [PMC free article] [PubMed] [Google Scholar]
- Dinstein I, Thomas C, Behrmann M, Heeger DJ. A mirror up to nature. Curr Biol. 2008;18:R13–R18. doi: 10.1016/j.cub.2007.11.004. [DOI] [PMC free article] [PubMed] [Google Scholar]
- Engel SA, Rumelhart DE, Wandell BA, Lee AT, Glover GH, Chichilnisky EJ, Shadlen MN. fMRI of human visual cortex. Nature. 1994;369:525. doi: 10.1038/369525a0. [DOI] [PubMed] [Google Scholar]
- Engel SA, Glover GH, Wandell BA. Retinotopic organization in human visual cortex and the spatial precision of functional MRI. Cereb Cortex. 1997;7:181–192. doi: 10.1093/cercor/7.2.181. [DOI] [PubMed] [Google Scholar]
- Ester EF, Serences JT, Awh E. Spatially global representations in human primary visual cortex during working memory maintenance. J Neurosci. 2009;29:15258–15265. doi: 10.1523/JNEUROSCI.4388-09.2009. [DOI] [PMC free article] [PubMed] [Google Scholar]
- Freeman J, Brouwer GJ, Heeger DJ, Merriam EP. Orientation decoding depends on maps, not columns. J Neurosci. 2011;31:4792–4804. doi: 10.1523/JNEUROSCI.5160-10.2011. [DOI] [PMC free article] [PubMed] [Google Scholar]
- Fuster JM. Memory in the cortex of the primate. Biol Res. 1995;28:59–72. [PubMed] [Google Scholar]
- Gardner JL. Is cortical vasculature functionally organized? Neuroimage. 2010;49:1953–1956. doi: 10.1016/j.neuroimage.2009.07.004. [DOI] [PubMed] [Google Scholar]
- Gardner JL, Sun P, Waggoner RA, Ueno K, Tanaka K, Cheng K. Contrast adaptation and representation in human early visual cortex. Neuron. 2005;47:607–620. doi: 10.1016/j.neuron.2005.07.016. [DOI] [PMC free article] [PubMed] [Google Scholar]
- Gardner JL, Merriam EP, Movshon JA, Heeger DJ. Maps of visual space in human occipital cortex are retinotopic, not spatiotopic. J Neurosci. 2008;28:3988–3999. doi: 10.1523/JNEUROSCI.5476-07.2008. [DOI] [PMC free article] [PubMed] [Google Scholar]
- Greenlee MW, Magnussen S, Reinvang I. Brain regions involved in spatial frequency discrimination: evidence from fMRI. Exp Brain Res. 2000;132:399–403. doi: 10.1007/s002210000385. [DOI] [PubMed] [Google Scholar]
- Harrison SA, Tong F. Decoding reveals the contents of visual working memory in early visual areas. Nature. 2009;458:632–635. doi: 10.1038/nature07832. [DOI] [PMC free article] [PubMed] [Google Scholar]
- Haxby JV, Petit L, Ungerleider LG, Courtney SM. Distinguishing the functional roles of multiple regions in distributed neural systems for visual working memory. Neuroimage. 2000;11:380–391. doi: 10.1006/nimg.2000.0592. [DOI] [PubMed] [Google Scholar]
- Haynes JD, Rees G. Predicting the orientation of invisible stimuli from activity in human primary visual cortex. Nat Neurosci. 2005;8:686–691. doi: 10.1038/nn1445. [DOI] [PubMed] [Google Scholar]
- Heeger DJ, Huk AC, Geisler WS, Albrecht DG. Spikes versus BOLD: what does neuroimaging tell us about neuronal activity? Nat Neurosci. 2000;3:631–633. doi: 10.1038/76572. [DOI] [PubMed] [Google Scholar]
- Hu M, Wang Y, Wang Y. Rapid dynamics of contrast responses in the cat primary visual cortex. PLoS One. 2011;6:e25410. doi: 10.1371/journal.pone.0025410. [DOI] [PMC free article] [PubMed] [Google Scholar]
- Kamitani Y, Tong F. Decoding the visual and subjective contents of the human brain. Nat Neurosci. 2005;8:679–685. doi: 10.1038/nn1444. [DOI] [PMC free article] [PubMed] [Google Scholar]
- Kamitani Y, Tong F. Decoding seen and attended motion directions from activity in the human visual cortex. Curr Biol. 2006;16:1096–1102. doi: 10.1016/j.cub.2006.04.003. [DOI] [PMC free article] [PubMed] [Google Scholar]
- Kastner S, O'Connor DH, Fukui MM, Fehd HM, Herwig U, Pinsk MA. Functional imaging of the human lateral geniculate nucleus and pulvinar. J Neurophysiol. 2004;91:438–448. doi: 10.1152/jn.00553.2003. [DOI] [PubMed] [Google Scholar]
- Kay KN, Naselaris T, Prenger RJ, Gallant JL. Identifying natural images from human brain activity. Nature. 2008;452:352–355. doi: 10.1038/nature06713. [DOI] [PMC free article] [PubMed] [Google Scholar]
- Kriegeskorte N. Relating population-code representations between man, monkey, and computational models. Front Neurosci. 2009;3:363–373. doi: 10.3389/neuro.01.035.2009. [DOI] [PMC free article] [PubMed] [Google Scholar]
- Kriegeskorte N, Goebel R, Bandettini P. Information-based functional brain mapping. Proc Natl Acad Sci U S A. 2006;103:3863–3868. doi: 10.1073/pnas.0600244103. [DOI] [PMC free article] [PubMed] [Google Scholar]
- Ledgeway T, Hess RF. Failure of direction identification for briefly presented second-order motion stimuli: evidence for weak direction selectivity of the mechanisms encoding motion. Vision Res. 2002;42:1739–1758. doi: 10.1016/S0042-6989(02)00106-2. [DOI] [PubMed] [Google Scholar]
- Ledgeway T, Smith AT. Evidence for separate motion-detecting mechanisms for first- and second-order motion in human vision. Vision Res. 1994;34:2727–2740. doi: 10.1016/0042-6989(94)90229-1. [DOI] [PubMed] [Google Scholar]
- Ledgeway T, Zhan C, Johnson AP, Song Y, Baker CL., Jr The direction-selective contrast response of area 18 neurons is different for first- and second-order motion. Vis Neurosci. 2005;22:87–99. doi: 10.1017/S0952523805221120. [DOI] [PubMed] [Google Scholar]
- Legge GE, Kersten D. Contrast discrimination in peripheral vision. J Opt Soc Am A. 1987;4(8):1594–1598. doi: 10.1364/JOSAA.4.001594. [DOI] [PubMed] [Google Scholar]
- Luck SJ, Vogel EK. The capacity of visual working memory for features and conjunctions. Nature. 1997;390:279–281. doi: 10.1038/36846. [DOI] [PubMed] [Google Scholar]
- Macmillan NA, Creelman CD. Detection theory: a user's guide. Ed 2. Mahwah, NJ: Erlbaum; 2005. [Google Scholar]
- Mannion DJ, McDonald JS, Clifford CW. Discrimination of the local orientation structure of spiral Glass patterns early in human visual cortex. Neuroimage. 2009;46:511–515. doi: 10.1016/j.neuroimage.2009.01.052. [DOI] [PubMed] [Google Scholar]
- Nestares O, Heeger DJ. Robust multiresolution alignment of MRI brain volumes. Magn Reson Med. 2000;43:705–715. doi: 10.1002/(SICI)1522-2594(200005)43:5<705::AID-MRM13>3.0.CO%3B2-R. [DOI] [PubMed] [Google Scholar]
- O'Craven KM, Downing PE, Kanwisher N. fMRI evidence for objects as the units of attentional selection. Nature. 1999;401:584–587. doi: 10.1038/44134. [DOI] [PubMed] [Google Scholar]
- Offen S, Schluppeck D, Heeger DJ. The role of early visual cortex in visual short-term memory and visual attention. Vision Res. 2009;49:1352–1362. doi: 10.1016/j.visres.2007.12.022. [DOI] [PMC free article] [PubMed] [Google Scholar]
- Offen S, Gardner JL, Schluppeck D, Heeger DJ. Differential roles for frontal eye fields (FEFs) and intraparietal sulcus (IPS) in visual working memory and visual attention. J Vis. 2010;10:28. doi: 10.1167/10.11.28. [DOI] [PMC free article] [PubMed] [Google Scholar]
- Ohzawa I, Sclar G, Freeman RD. Contrast gain control in the cat's visual system. J Neurophysiol. 1985;54:651–667. doi: 10.1152/jn.1985.54.3.651. [DOI] [PubMed] [Google Scholar]
- Op de Beeck HP, Dicarlo JJ, Goense JB, Grill-Spector K, Papanastassiou A, Tanifuji M, Tsao DY. Fine-scale spatial organization of face and object selectivity in the temporal lobe: do functional magnetic resonance imaging, optical imaging, and electrophysiology agree? J Neurosci. 2008;28:11796–11801. doi: 10.1523/JNEUROSCI.3799-08.2008. [DOI] [PMC free article] [PubMed] [Google Scholar]
- Pasternak T, Greenlee MW. Working memory in primate sensory systems. Nat Rev Neurosci. 2005;6:97–107. doi: 10.1038/nrn1603. [DOI] [PubMed] [Google Scholar]
- Peirce JW. The potential importance of saturating and supersaturating contrast response functions in visual cortex. J Vis. 2007;7:13. doi: 10.1167/7.6.13. [DOI] [PMC free article] [PubMed] [Google Scholar]
- Pessoa L, Gutierrez E, Bandettini P, Ungerleider L. Neural correlates of visual working memory: fMRI amplitude predicts task performance. Neuron. 2002;35:975–987. doi: 10.1016/S0896-6273(02)00817-6. [DOI] [PubMed] [Google Scholar]
- Pooresmaeili A, Poort J, Thiele A, Roelfsema PR. Separable codes for attention and luminance contrast in the primary visual cortex. J Neurosci. 2010;30:12701–12711. doi: 10.1523/JNEUROSCI.1388-10.2010. [DOI] [PMC free article] [PubMed] [Google Scholar]
- Postle BR, D'Esposito M. Dissociation of human caudate nucleus activity in spatial and nonspatial working memory: an event-related fMRI study. Brain Res Cogn Brain Res. 1999;8:107–115. doi: 10.1016/S0926-6410(99)00010-5. [DOI] [PubMed] [Google Scholar]
- Reich DS, Mechler F, Victor JD. Temporal coding of contrast in primary visual cortex: when, what, and why. J Neurophysiol. 2001;85:1039–1050. doi: 10.1152/jn.2001.85.3.1039. [DOI] [PubMed] [Google Scholar]
- Sanchez-Panchuelo RM, Francis S, Bowtell R, Schluppeck D. Mapping human somatosensory cortex in individual subjects with 7T functional MRI. J Neurophysiol. 2010;103:2544–2556. doi: 10.1152/jn.01017.2009. [DOI] [PMC free article] [PubMed] [Google Scholar]
- Sapountzis P, Schluppeck D, Bowtell R, Peirce JW. A comparison of fMRI adaptation and multivariate pattern classification analysis in visual cortex. Neuroimage. 2010;49:1632–1640. doi: 10.1016/j.neuroimage.2009.09.066. [DOI] [PMC free article] [PubMed] [Google Scholar]
- Schluppeck D, Curtis CE, Glimcher PW, Heeger DJ. Sustained activity in topographic areas of human posterior parietal cortex during memory-guided saccades. J Neurosci. 2006;26:5098–5108. doi: 10.1523/JNEUROSCI.5330-05.2006. [DOI] [PMC free article] [PubMed] [Google Scholar]
- Scolari M, Serences JT. Basing perceptual decisions on the most informative sensory neurons. J Neurophysiol. 2010;104:2266–2273. doi: 10.1152/jn.00273.2010. [DOI] [PMC free article] [PubMed] [Google Scholar]
- Serences JT, Ester EF, Vogel EK, Awh E. Stimulus-specific delay activity in human primary visual cortex. Psychol Sci. 2009;20:207–214. doi: 10.1111/j.1467-9280.2009.02276.x. [DOI] [PMC free article] [PubMed] [Google Scholar]
- Smith A, Kosillo P, Williams AL. The confounding effect of response amplitude on MVPA performance measures. Neuroimage. 2011;56:525–530. doi: 10.1016/j.neuroimage.2010.05.079. [DOI] [PubMed] [Google Scholar]
- Smith SM, Jenkinson M, Woolrich MW, Beckmann CF, Behrens TE, Johansen-Berg H, Bannister PR, De Luca M, Drobnjak I, Flitney DE, Niazy RK, Saunders J, Vickers J, Zhang Y, De Stefano N, Brady JM, Matthews PM. Advances in functional and structural MR image analysis and implementation as FSL. Neuroimage. 2004;23:S208–S219. doi: 10.1016/j.neuroimage.2004.07.051. [DOI] [PubMed] [Google Scholar]
- Sneve MH, Alnæs D, Endestad T, Greenlee MW, Magnussen S. Modulation of activity in human visual area V1 during memory masking. PLoS One. 2011;6:e18651. doi: 10.1371/journal.pone.0018651. [DOI] [PMC free article] [PubMed] [Google Scholar]
- Swisher JD, Gatenby JC, Gore JC, Wolfe BA, Moon CH, Kim SG, Tong F. Multiscale pattern analysis of orientation-selective activity in the primary visual cortex. J Neurosci. 2010;30:325–330. doi: 10.1523/JNEUROSCI.4811-09.2010. [DOI] [PMC free article] [PubMed] [Google Scholar]
- Wandell BA, Dumoulin SO, Brewer AA. Visual field maps in human cortex. Neuron. 2007;56:366–383. doi: 10.1016/j.neuron.2007.10.012. [DOI] [PubMed] [Google Scholar]
- Wheeler ME, Treisman AM. Binding in short-term visual memory. J Exp Psychol Gen. 2002;131:48–64. doi: 10.1037/0096-3445.131.1.48. [DOI] [PubMed] [Google Scholar]
- Williams MA, Dang S, Kanwisher NG. Only some spatial patterns of fMRI response are read out in task performance. Nat Neurosci. 2007;10:685–686. doi: 10.1038/nn1900. [DOI] [PMC free article] [PubMed] [Google Scholar]
- Woodman GF, Vogel EK. Selective storage and maintenance of an object's features in visual working memory. Psychon Bull Rev. 2008;15:223–229. doi: 10.3758/PBR.15.1.223. [DOI] [PubMed] [Google Scholar]