

Abstract
Systemic sclerosis (SSc) is a chronic disease, with early activation of the immune system. The aim of our work was to address how SSc–mesenchymal stem cells (MSCs), although senescent, might preserve specific immunomodulatory abilities during SSc. MSCs were obtained from 10 SSc patients and 10 healthy controls (HC). Senescence was evaluated by assessing cell cycle, β-galactosidase (β-Gal) activity, p21 and p53 expression; doxorubicin was used as acute senescence stimulus to evaluate their ability to react in stressed conditions. Immunomodulatory abilities were studied co-culturing MSCs with peripheral blood mononuclear cells (PBMCs) and CD4+ cells, in order to establish both their ability to block proliferation in mixed lymphocyte reaction and in regulatory T cells (Tregs) induction. SSc–MSC showed an increase of senescence biomarkers. Eighty per cent of MSCs were in G0–G1 phase, without significant differences between SSc and HC. SSc–MSCs showed an increased positive β-Gal staining and higher p21 transcript level compared to HC cells. After doxorubicin, β-Gal staining increased significantly in SSc–MSCs. On the contrary, doxorubicin abolished p21 activation and elicited p53 induction both in SSc– and HC–MSCs. Interleukin (IL)-6 and transforming growth factor (TGF)-β-related transcripts and their protein levels were significantly higher in SSc–MSCs. The latter maintained their immunosuppressive effect on lymphocyte proliferation and induced a functionally regulatory phenotype on T cells, increasing surface expression of CD69 and restoring the regulatory function which is impaired in SSc. Increased activation of the IL-6 pathway observed in our cells might represent an adaptive mechanism to senescence, but preserving some specific cellular functions, including immunosuppression.
Keywords: immunomodulatory abilities, mesenchymal stem cells, systemic sclerosis, senescence
Introduction
Several studies have shown that mesenchymal stem cells (MSCs) represent an attractive option for new therapeutic biological approaches of autoimmune diseases, due to their plasticity, multi-differentiative potential and immunosuppressive function 1–3. According to the Mesenchymal and Tissue Stem Cell Committee, these cells must: (i) be plastic-adherent; (ii) express CD105, CD73 and CD90 lacking expression of CD45, CD34, CD14 or CD11b, CD79a or CD19 and human leucocyte antigen (HLA) class II; and (iii) be able to differentiate into osteoblasts, adipocytes and chondroblasts under standard in-vitro differentiating conditions 4. In-vitro differentiative potential of MSCs is not restricted to mesodermal lineages, but their transdifferentiation into other lineages, such as endothelia, could be realized both in vitro and in vivo 5.
In addition, MSCs exhibit immunoregulatory activities, inhibiting the function of different immune cells of innate and adaptive immunity 6, blocking the division of stimulated T cells, preventing irreversible G0/G1 phase arrest and stopping T cell division in mixed lymphocyte reactions (MLRs) 7. However, the immunomodulatory activity of the MSCs does not rely solely upon T cells, but also upon the first step of the immune response through the inhibition of dendritic cell differentiation and maturation in antigen-presenting cells 8. Furthermore, their regulatory activity may be amplified by modulating immune responses via the de-novo induction and expansion of CD4+CD25+forkhead box protein 3 (FoxP3)+ regulatory T cells (Tregs). Tregs play a critical role in peripheral self-tolerance, as well as in the regulation of acquired immunity, by inhibition of lymphocyte proliferation 9,10. As well as Tregs developing in the thymus (natural Tregs), a Treg population can be induced from peripheral naive T cell (inducible Tregs), and these inducible Tregs can be recruited directly by MSC from CD4+ T cells 11,12. In recent decades many studies have been published addressing the role of Treg number and function in human autoimmunity 13, suggesting that their possible defective function plays a role in many autoimmune diseases. On this basis, both the regenerative and the immunomodulatory properties of MSCs make them an attractive candidate for cellular therapy in autoimmune diseases.
Systemic sclerosis (SSc) is an autoimmune disease in which alteration of cellular immunity, including T and B lymphocytes, has been largely studied both in the skin and in internal organs 14,15. Furthermore, recent evidence has shown an aberrant dendritic cell function in SSc, contributing to the molecular milieu of the disease 16.
We have shown previously that MSCs obtained from SSc patients (SSc–MSC) were normal with respect to clonogenicity and differentiative capacity, although they displayed early senescence and were defective in acquiring some differentiative functions 17. Senescent MSC generally show a flattened morphology, over-expression of senescence-associated β-galactosidase (β-Gal) activity, reduced telomerase activity and increased expression of both p53 and p21, which are negative regulators of cell proliferation 18.
At present, only few papers have investigated the immunoregulatory activity in SSc. It has been reported that SSc–MSCs, although senescent, might display the same immunosuppressive properties as their healthy counterparts in a cell number-dependent fashion 19, although the pathways involved in this activity have not yet been investigated and no data have been shown regarding their possibility of inducing Treg subsets. MSC-mediated immunomodulation requires both cell–cell contact and release of soluble factors, although there is great controversy concerning the molecules involved both in the direct immunosuppressive effect of MSCs and in Treg induction 20. Many possible candidates are currently under investigation, including transforming growth factor (TGF)-β and interleukin (IL)-6 21. It is well known that TGF-β is involved in MSC immunosuppression via a significant increase of its production 22–24; as far as IL-6 is concerned, it has been proposed that its increased production is associated directly with ageing 25, and probably playing a role in triggering the immunosuppressive effect of MSCs 26. Furthermore, a recent report suggests that, although the number of natural Tregs is increased significantly during SSc, an impairment in their ability to suppress CD4+ effector T cells has been shown and their defective function correlates strongly with lower expression of surface CD69 27. Taken together, these few data do not address completely the immunoregulatory status during SSc, and might suggest a possible defect in effector cell immunosuppression.
In this paper we have gained insight into the multi-step immunosuppressive function of MSCs in SSc, permitting these cells, although senescent, to save their specific ability by exploring some pathways involved in this function, with a special interest in IL-6 and TGF-β production, which are considered pivotal cytokines in the pathology of SSc, and finally addressing the potential role of SSC–MSC in generating inducible Tregs.
Materials and methods
Isolation and culture of MSCs
After ethics committee approval and written informed consent (Helsinki Declaration), human MSCs were obtained by aspiration from the iliac crest from 10 SSc patients (four with diffuse and six with a limited form of the disease) and 10 healthy bone marrow (BM) donors [nine women and one man; mean age 35 years (age range 23–45 years)] undergoing BM harvest. The demographic features of our SSc patients are shown in Table 1. Due to the possible effects of immunosuppressive and cytotoxic agents on MSCs, SSc patients treated with high doses of both corticosteroids and cyclophosphamide were not included into this study.
Table 1.
Demographic features of systemic sclerosis (SSc) patients
| Sex/age (years) | Years of SSc onset | MRSS | Autoantibodies | Lung involvment HRTC/PFT | Heart–kidney involvement | Digital ulcers |
|---|---|---|---|---|---|---|
| F/46 | 2007 | 12 | ANA/Scl-70 | Normal/normal | Normal/normal | No |
| F/30 | 2000 | 9 | ANA/ACA | Fibrosis/normal | Normal/normal | Yes |
| F/40 | 1999 | 15 | ANA/Scl-70 | Fibrosis/normal | Normal/normal | Yes |
| F/22 | 2009 | 14 | ANA/ACA | Normal/normal | PAH/normal | Yes |
| F/45 | 1998 | 13 | ANA/ACA | Normal/normal | Normal/normal | Yes |
| F/31 | 2000 | 27 | ANA/Scl70 | Normal/normal | Normal/normal | Yes |
| M/43 | 1985 | 18 | ANA/ACA | Normal/normal | PAH/normal | Yes |
| F/26 | 2003 | 8 | ANA/ACA | Normal/normal | Normal/normal | Yes |
| F/36 | 1999 | 38 | ANA/Scl-70 | Normal/normal | PAH/normal | Yes |
| F/39 | 1980 | 15 | ANA/ACA | Normal/normal | PAH/normal | Yes |
MRSS: modified Rodnan skin thickness score (maximum possible score 51); HRTC: high-resolution computed tomography; PFT: pulmonary function test; ANA: anti-nuclear antibodies; ACA: anti-centromere antibodies; PAH: pulmonary arterial hypertension; F: female; M: male.
Samples were placed into tubes containing ethylenediamine tetraacetic acid (EDTA) and the BM cells were obtained by density gradient sedimentation on 12% hydroxyethyl amide. The upper phase was harvested, centrifuged at 700 g for 10 min and plated at a concentration of 5 × 10³ cells/cm2 in Dulbecco's modified Eagle's medium (DMEM; Gibco, Carlsbad, CA, USA) supplemented with 10% fetal bovine serum (FBS; Gibco), 2 mmol/l L-glutamine (EuroClone, Milan, Italy) and 100 U penicillin, 1000 U streptomycin (Biochrom AG, Berlin, Germany).
Both SSc and healthy control (HC) cultures were grown and expanded in flasks at 37°C, 5% CO2 in a humidified thermostat for 2 weeks until confluence and used for the following experiments at third passage (P3).
Analysis of proliferation of MSCs
At confluence, the cells were trypsinized and the cellular expansion growth rate of both HC– and SSc–MSCs was evaluated by cell count in a Burker chamber at each passage and expressed in terms of population-doubling (PD) using the formula: log n/log 2, where n is the cell number of the confluent monolayer divided by the initial number of cells seeded. We further assessed Ki67 gene expression, which is associated strictly with cell proliferation 28. A more detailed description of this assay is discussed in the section regarding quantitative polymerase chain reaction (qPCR).
Phenotypic characterization of MSCs by flow cytometric analysis
To confirm the human MSC phenotype, plastic adherent cells were analysed for the expression of surface-specific antigens by flow cytometry, as established elsewhere 4. The cells were stained with the following conjugated monoclonal antibodies: fluorescein isothiocyanate (FITC)-conjugated or phycoerythrin (PE)-conjugated monoclonal antibodies, including CD14, CD34, CD45, CD105, CD90 and CD73. FITC- and PE-conjugated isotypes were used as negative controls. Analysis was performed using Cytomics FC500 (Beckman-Coulter, Brea, CA, USA).
Osteogenic and adipogenic differentiation of MSCs
The capacity of MSCs to differentiate along osteogenic and adipogenic lineages was assessed as described elsewhere 4. Briefly, for osteogenic differentiation cells were plated at 104 cells/cm2 in MSC medium supplemented with 10% FBS, 10 nM dexamethasone, 100 μg/ml ascorbic acid and 10 mM β-glycerophosphate (all from Sigma, St Louis, MO, USA). After 21 days, the osteogenic differentiation was demonstrated by deposition of mineral nodules detected by alizarin red S staining. Adipogenic differentiation was induced by adding culture medium supplemented with 10% FBS, 0·5 mM isobutyl methylxanthine, 1 μM dexamethasone, 10 μg/ml insulin and 70 μM indomethacin (all from Sigma) to MSCs. After 21 days' culture, adipogenesis was measured by the accumulation of lipid-containing vacuoles stained with Oil red O.
Senescence evaluation
Cell cycle analysis
Cultured MSCs were collected by trypsinization, washed three times and resuspended 1 × 10⁶/300 μl with phosphate-buffered saline (PBS; Euro Clone). Cells were fixed in 700 μl of ice-cold 100% ethanol at 4°C for a minimum of 30 min. The cell suspension was centrifuged at 1700 g for 5 min and washed twice with PBS+0·1% BSA (Kedrion, Lucca, Italy). Finally, the cell pellets were incubated with propidium iodide (PI; Sigma) (50 μg/ml)/RNase (Sigma, St Louis, MO, USA) (250 ug/ml)/0·1% Triton X (Sigma) solution for 1 h and analysed with Cytomics FC500 (Beckman-Coulter).
Senescence-associated β-Gal staining
The senescence-associated β-Gal assay was performed as described previously using a commercial kit (senescence detection kit; Calbiochem, Merck KGaA, Darmstadt, Germany). Briefly, MSCs were detected, fixed for 10 min in the fixative solution, then washed and incubated overnight at 37°C with fresh β-Gal staining solution. Cells were washed with PBS and counted using a light microscope (Eclipse Ti-S, Nikon, Florence, Italy). Values represent the percentage of β-Gal-positive cells (blue-stained cells) of at least 100 counted cells.
Western blot
In order to perform Western blot assays, HC– and SSc–MSC cells were pelleted, washed twice with PBS, lysed on ice in lysis buffer (1% Triton X-100, 0·5% NP-40, 50 mM Tris–Cl, pH 7·5, 150 mM NaCl, 1 mM EDTA, supplemented with 1 mM phenylmethylsulfonyl fluoride, 1 mM NaF, 1 mM Na3VO4, 5 μg/ml aprotinin, 5 μg/ml leupeptin) for 30 min and cleared by centrifugation. The protein concentration was calculated by Bradford protein assay reagent (Bio-Rad, Hercules, CA, USA). A 12% sodium dodecyl sulphate (SDS)-polyacrylamide gel electrophoresis (PAGE), under reducing conditions, was loaded with equal amount of proteins. All the loaded proteins were electrophoresed and then transferred to nitrocellulose membranes (Amersham Pharmacia Biotechnology, Piscataway, NJ, USA).
After 1 h blocking at room temperature in blocking buffer [5% non-fat milk in Tris-buffered saline/1% Tween 20 (TBS/T)] and after washing three times for 5 min each in TBS/T, the membranes were incubated overnight at 4°C with the primary antibodies: p53 [DO-1-mouse monoclonal antibody (mAb); Santa Cruz Biotechnology, Santa Cruz, CA, USA], p21 (Waf1/Cip1-DCS60-mouse mAb; Cell Signaling, Danvers, MA, USA), diluted in 5% bovine serum albumin in TBS/T. Following three washes with TBS/T, horseradish peroxidase-conjugated secondary antibody (Santa Cruz Biotechnology) diluted in blocking buffer was added for 30 min at room temperature and washed three times with TBS/T. The detection was performed by enhanced chemiluminescence detection (ECL) reaction (Amersham Pharmacia Biotechnology).
All the signals were quantified by normalizing to the tubulin signal (CP06 anti-α-tubulin mouse mAb-DM1A).
qRT–PCR analysis
Total RNA was extracted from normally cultured, doxorubicin-treated and MSC co-cultured with peripheral blood mononuclear cells (PBMC) using Trizol (Sigma) reagent and reverse-transcribed into complementary DNA (cDNA) using ThermoScript reverse transcription–PCR kit (Invitrogen, San Diego, CA, USA). The qRT–PCR was performed using SYBR green kits (Applied Biosystems, Life Technologies distributors, Paisley, UK).
Primers were designed on the basis of the reported sequences (PrimerBank NCBI; p21: 5′-TGGAGACTCTCAGGGTCGAAA-3′ (forward) and 5′- TCTACCACTCCAAACGCCG-3′ (reverse); p53: 5′-CCAGGGCAGCTACGGTTTC-3′ (forward) and 5′-CTCCGTCATGTGCTGTGACTG-3′ (reverse); β-actin: 5′- CCTGGCACCCAGCACAAT-3′ (forward) and 5′-AGTACTCCGTGTGGATCGGC-3′ (reverse); TGFβ: 5′-CTAATGGTGGAAACCCACAACG-3′ (forward) and 5′-TATCGCCAGGAATTGTTGCTG-3′ (reverse); and IL-6: 5′-AATTCGGTACATCCTCGAGGG-3′ (forward) and 5′-TTGGAAGGTTCAGGTTGTTTTCT-3′ (reverse).
Ki67 and GAPDH gene expressions were assessed by commercial Taqman gene expression assay (assay ID: Hs01032443_m1; Hs02758991_g1, respectively). The RT–PCR was run in triplicate.
Results were analysed after 40 cycles of amplification using the ABI 7500 Fast Real-Time PCR system.
Immunosuppressive activity
CD4+ T cell isolation
HC and SSc human PBMC preparations were used in these studies. The heparinized blood was layered carefully onto Ficoll (density 1·077 g/ml; Fresenius Kabi Norge AS for Axis-Shield PoC AS, Oslo, Norway) and centrifuged at 800 g for 30 min without brake to obtain a density gradient separation. After centrifugation, the mononuclear cell layer was recovered and washed twice with PBS; Sigma).
Human CD4+ T cells were isolated from the PBMCs by positive selection using the Midi MACS CD4+ T cells magnetic isolation kit (Milteny Biotec), according to the manufacturer's instructions.
PBMC proliferation assay
In order to evaluate the immunosuppressive activity of MSCs, these cells were isolated from both HC and SSc and plated in triplicate into 12-well plates. HC–PBMCs resuspended in 2 ml of RPMI-1640 (Invitrogen, Cergy, France) supplemented with 10% inactivated human serum (from human male AB plasma; Sigma) were added to wells in a 1:1 ratio with BM–MSCs and cultured in the presence of 4 ug/ml phytohaemagglutinin (PHA) for 5 days, as described previously 20. After PHA stimulation, PBMCs were pulsed with 1 uCi/well of [3H]-thymidine ([3H]-TdR) (Amersham Pharmacia) for 18 h. Cells were harvested and thymidine incorporated in DNA was recovered on filters. [3H]-TdR incorporation was measured using a scintillation counter (KLB Wallac, Gaithersburg, MD, USA). Lymphocyte proliferation was quantified by means of an 18-h pulse with 1 mCi/well ([3H]-TdR) (Amersham, Bucks, UK) and expressed as counts per minute (cpm).
CD4+ induction of CD25+ FoxP3 expression
CD4+ T cells were isolated from SSc and HC PBMCs, resuspended in 2 ml RPMI-1640 (Invitrogen) supplemented with 10% inactivated FBS (Gibco) and co-cultured with HC– and SSc–MSCs at a 1:5 ratio. To evaluate the role of MSCs and CD4+ T cells in our system, we planned a set of experiments in autologous and heterologous conditions: (i) HC–MSCs+HC–CD4; (ii) SSc–MSCs+SSc–CD4; (iii) HC–MSCs+SSc–CD4; and (iv) SSc–MSCs+HC–CD4, to assess the specific activity of each cell subset.
After 5 days, CD4+ cells were harvested and analysed for the expression of specific surface antigens by monoclonal antibody directed against CD3, CD4, CD25 (Beckman-Coulter), FoxP3 (BioLegend) and CD69 (Miltenyi Biotec, Ltd, Bisley, Surrey, UK). CD4+CD25brightFoxP3+ and CD4+CD25brightFoxP3+CD69+ cells were quantified by cytofluorimetric analysis (Cytomics FC500; Beckman-Coulter) within an initial fraction of 1 × 10⁶ CD4+ cells.
Treg suppressive effect on healthy CD4+ cells after MSC co-cultures
Tregs were isolated further from each experimental culture by CD25 microbeads (Miltenyi Biotec). The suppressive capacity was established as follows: CD4+ cells were cultured in 96-well plates with PHA (4 μg/ml) alone and in the presence of enriched Tregs (the CD4+ T cell/Treg cell ratio was 10:1). After 4 days of co-culture, [3H]-TdR was added for a further 24 h. Cells were harvested into glass fibre filters and [3H]-TdR incorporation was assessed by a beta scintillation counter.
Detection of cytokine secretion using enzyme-linked immunosorbent assay (ELISA) in PBMC/MSC co-cultures
The concentrations of both IL-6 and TGF-β released in the culture supernatants were measured by a specific ELISA. Briefly, according to the manufacturer's instructions (BD Pharmingen, BD Biosciences, Bedford, MA, USA), TGF-β and IL-6 were assessed in the supernatants following co-culture using two replicates of each sample.
Statistical methods
GraphPad Prism version 5·0 software was used for statistical analyses. Results are expressed as mean ± standard deviation (s.d.). Relationships between different values were examined by Pearson's correlation coefficient. A proportion of cell subsets were compared using Student's t-test for normally or non-normally distributed subsets as appropriate. Statistical significance was expressed by a P-value of < 0·05.
Results
Immunophenotype and multi-lineage differentiative ability of MSCs isolated from SSc patients
MSCs isolated from SSc patients were characterized by expressing the surface molecules CD90, CD105 and CD73. They did not express CD45, CD34 and CD14, as assessed by flow cytometry analysis. Moreover, MSCs showed normal ability in differentiating into osteoblast, adipocytes and chondroblast in vitro (data not shown).
MSCs isolated from SSc patients showed reduced proliferative ability
The cumulative population doublings for MSCs isolated from SSc patients, as markers of the replication rate, was consistently lower than that of HC cells (HC–MSCs 3·07 ± 0·38 versus SSc–MSCs 2·42 ± 0·16, P < 0·0070; Fig. 1a).
Fig. 1.
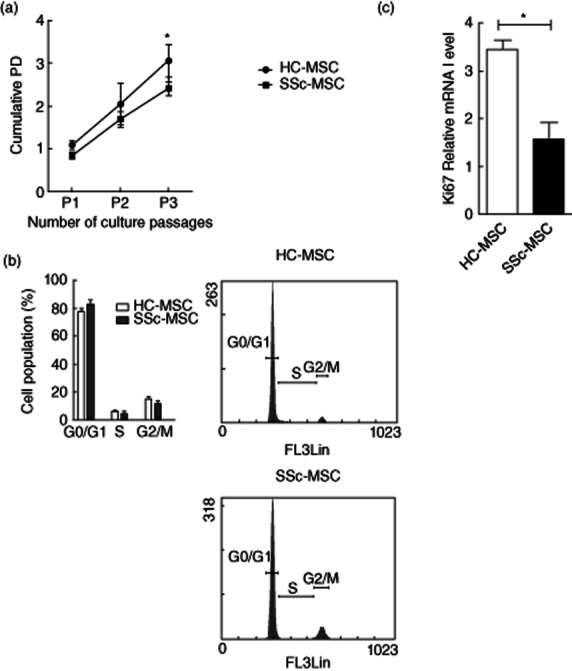
Cell proliferation and cell cycle. (a) Growth kinetic curves of cultured healthy controls (HC)– and systemic sclerosis (SSc)–mesenchymal stem cells (MSCs) during in-vitro expansion from the first to the third passages. The growth rate was expressed as the mean value of cumulative population-doubling (PD) levels and calculated according the formula: log2 [(the number of collected cells)/(the number of seeded cells)]. HC–MSCs showed a significant higher PD than SSc–MSCs. (b) Flow cytometric assessment of the MSC cell-cycle, using propidium iodide (PI). No significant difference was observed in the percentage of cells in G0/G1, S and G2/M phases, between HC– and SSc–MSCs. Histograms are representative of cell cycle analysis of three different experiments. (c) mRNA level of Ki67 proliferation marker of HC– and SSc–MSCs. The values are expressed as mean ± standard deviation (s.d.) (*P < 0·05).
In order to assess whether this reduced proliferation of SSc–MSCs was due to a growth-arrested status and the different cell cycle distributions with respect to HC cells, both SSc and HC–MSCs were analysed by flow cytometry after DNA staining with PI. Of note, no significant differences were observed between HC– and SSc–MSC, as cell cycle analysis revealed that the large percentage of MSCs obtained from both HC and SSc were in G0/G1 phases [HC–MSCs 80·23 ± 1·79 versus SSc–MSCs 83·00 ± 3·33%, P = not significant (n.s.)]; on the contrary, only a small population of cells were engaged in active proliferation (S+G2/M phases: HC–MSCs 18·75 ± 2·09 versus SSc–MSCs 15·65 ± 3·41%, P = n.s., Fig. 1b), although not significantly.
Because the above method does not distinguish between actively growing (G1) and growth-arrested (G0) cells, to distinguish more effectively between proliferative and resting cells we assessed Ki67 gene expression by qPCR analysis.
We found that MSCs isolated from SSc patients showed a lower expression of Ki67 gene when compared to HC cells (HC–MSCs 3·44 ± 0·20 versus SSc–MSCs 1·57 ± 0·53 mRNA levels, P = 0·019), confirming that the majority of cells was in G0 phase (Fig. 1c). No differences were observed in the proliferative ability of SSc–MSCs between the two disease subsets.
During SSc, MSCs acquired a senescent attitude and showed high sensitivity to genotoxic stress
Given the functional implications of the in-vitro senescence of MSCs, we employed β-Gal as a senescence marker. We observed that the percentage of β-Gal-positive stained cells was significantly higher in SSc when compared to HC (HC–MSCs 7·67 ± 4·41% versus SSc–MSCs 26·00 ± 4·34%, P = 0·03, Fig. 2a). Furthermore, we cultured both HC and SSc cells for 24 h in the presence of 5 μg/ml of doxorubicin, which represents a well-accepted in-vitro model to recreate the premature ageing of stem cells 29. In this setting, we observed that MSCs isolated from SSc patients showed a more remarkable increase in the percentage of β-Gal-positive cells when compared to HC (HC–MSCs 15·33 ± 4·37% versus SSc–MSCs 56·88 ± 9·83, P = 0·04, Fig. 2b).
Fig. 2.
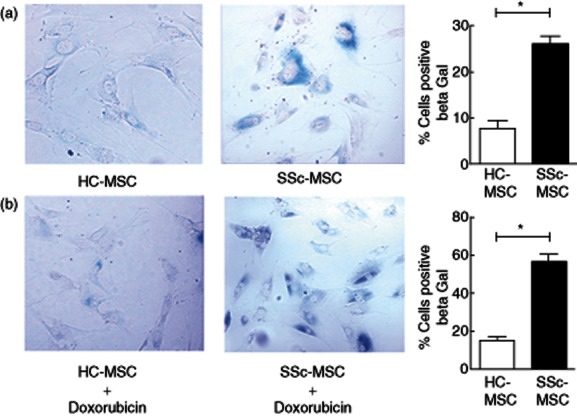
β-Galactosidase (β-Gal) activity. (a) Systemic sclerosis (SSc)–mesenchymal stem cells (MSCs) showed a significant increase in the percentage of β-Gal-positive cells in respect to healthy controls (HC) cells. β-Gal-stained cells showed flat and enlarged morphology. (b) Doxorubicin (5 μg/ml) treatment increased the percentage of β-Gal-positive cells in both HC and SSc cells. β-Gal-positive cells in SSc–MSCs were increased significantly when compared to HC–MSC. Percentage of β-Gal-positive cells were quantified and showed in histograms. The values are expressed as mean ± standard deviation (s.d.) (*P < 0·05).
P21 gene expression is increased during SSc
To analyse further the MSC senescence during SSc, we assessed two specific markers associated with the senescent phenotype: p53 and p21.
We observed that both HC– and SSc–MSCs showed the same basal expression of p53 protein, without significant differences. Of note, p21 protein expression was increased strongly in MSCs isolated from SSc compared to HC cells, suggesting a sustained activation of the p53/p21 pathway during SSc.
After doxorubicin, MSCs from HC and SSc showed a relevant increase in p53 protein level without differences, showing that instead of the disease, acute genotoxic stress normally induces p53 accumulation (Fig. 3a). Despite p53 activation, we did not find a clear increase of p21 protein level in either HC– or SSc–MSCs, although SSc cells showed a slightly increased expression of p21 after doxorubicin with respect to HC.
Fig. 3.
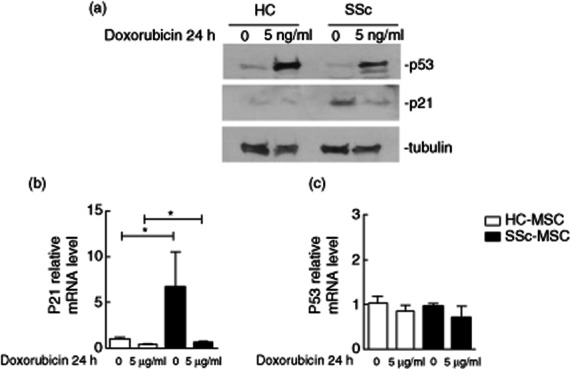
p21 and p53 expression in mesenchymal stem cells (MSCs). (a) The expression levels of senescence-associated proteins were analysed by Western blotting. At basal state, no difference was observed in p53 expression between healthy controls (HC)– and systemic sclerosis (SSc)–MSCs; p21 showed increased expression in SSc–MSCs with respect to HC cells. After doxorubicin, p53 protein levels increased in both HC– and SSc–MSCs; HC–MSCs did not show an increase in p21 expression level; a slight increase of p21 protein level was found in SSc–MSCs. Anti-tubulin antibody was used as a control for equal loading of proteins. The pictures are representative of three independent experiments. (b) p21 and (c) p53 mRNA relative quantification before and after doxorubicin treatment. The values are expressed as mean ± standard deviation (s.d.) (*P < 0·05).
The relative qRT–PCR confirmed the results obtained by Western blot analysis. In normal culture conditions, mRNA transcripts of p53 were no different in HC– and SSc–MSCs (HC–MSCs 0·97 ± 0·05 versus SSc–MSCs 1·04 ± 0·15 mRNA levels, P = 0·75). P21 mRNA expression was increased significantly in SSc–MSCs when compared to HC (HC–MSCs 1·07 ± 0·13 versus SSc–MSCs 6·70 ± 3·84 mRNA levels, P = 0·01). (Fig. 3b,c). After treating MSCs with doxorubicin, we did not observe any change in the p53 mRNA levels compared to non-treated cells, both in HC and SSc (HC–MSCs 0·86 ± 0·14 versus SSc–MSCs 0·72 ± 0·24 mRNA levels, P = 0·50). Of note, p21 mRNA levels were increased significantly in respect to HC cells (HC–MSCs 0·39 ± 0·06 mRNA levels versus SSc–MSCs 0·67 ± 0·09, P = 0·01, Fig. 3b,c).
Senescent SSc–MSCs maintain normal immunomodulatory activities
The immunosuppressive activity of MSCs, derived from both HC donors and SSc patients, was assessed by co-culture with PHA-stimulated healthy PBMCs. MSCs from HC and SSc patients suppressed PHA-induced proliferation without significant differences (HC PBMCs 12120 ± 1144 cpm versus HC PBMCs/HC–MSCs co-culture 5814 ± 867 cpm, P < 0·0001, and HC PBMCs 12120 ± 1144 cpm versus HC–PBMCs/SSc–MSCs co-culture 4678 ± 1283 cpm, P < 0·0001, Fig. 4a).
Fig. 4.

The immunomodulatory properties and cytokine profile of mesenchymal stem cells (MSCs). (a) Effect of MSCs on healthy controls (HC)–peripheral blood monuclear cell (PBMC) proliferation. Both HC– and systemic sclerosis (SSc)–MSCs suppressed significantly the phytohaemagglutinin (PHA)-induced proliferation of PBMCs without significant differences. (b) Number of CD4+CD25+brightforkhead box protein 3 (FoxP3) cells within CD4+ lymphocytes. The number of regulatory T cells (Tregs) was increased significantly in circulating SSc–CD4+ cells when compared to HC. After co-culture with MSCs the number of Tregs was increased significantly in both autologous and heterologous co-cultures. (c) Number of CD4+CD25+brightFoxP3CD69+ cells within CD4+ lymphocytes. The number of circulating CD69+ cells was significantly lower in SSc when compared to HC. After co-cultures with MSCs, CD69 surface expression was increased in both autologous and heterologous co-cultures. (d) Immunosuppressive function of Tregs. Circulating SSc–Treg inhibition of healthy CD4+ cell proliferation was impaired. After co-culture with HC– and SSc–MSCs, the induced SSc–Tregs inhibited CD4+ cell proliferation significantly. (e) Interleukin (IL)-6 and (f) transforming growth factor (TGF)-β mRNA expression. IL-6 gene expression was increased in SSc–MSCs before and after co-culture with PBMCs. Before co-culturing with PBMCs, HC– and SSc–MSCs did not show any difference in TGF-β expression. TGF-β expression increased in SSc–MSCs co-cultured with PBMCs when compared with HC cells. (g) IL-6 and (h) TGF-β enzyme-linked immunosorbent assay (ELISA). IL-6 production is increased in the supernatants of SSc–MSCs cultured alone and co-cultured with PBMCs when compared to HC–MSCs. At basal state HC– and SSc–MSCs showed no difference in TGF-β supernatant protein levels; after co-culture with PBMCs, SSc–MSCs displayed a significantly greater TFG-β protein level. The values are expressed as mean ± standard deviation (s.d.) (*P < 0·05; **P < 0·005; ***P < 0·0005).
Moreover, we assessed the capacity of MSCs to induce the regulatory phenotype (CD25brightFoxP3) in SSc lymphocytes. CD4+ T cells from healthy controls (HC–CD4+) and from SSc patients (SSc–CD4+) were co-cultured for 5 days with MSCs in both autologous and heterologous conditions. In circulating SSc–CD4+, we observed a significantly higher number of CD4+CD25brightFoxP3+ cells when compared with HC–CD4+ cells (11 216 ± 2088 versus 4547 ± 2182 cells, respectively; P = 0·02). Treg numbers, after MSC induction, increased significantly in each experimental condition without any difference between SSc patients and HC, as shown in Fig. 4b.
We next investigated Treg activation, examining the surface expression of CD69 on these cells. We found that CD69 was significantly lower in SSc–Tregs when compared to HC cells (494 ± 99 versus 3256 ± 830 cells, respectively; P = 0·002). After 5 days of co-culture with MSCs, the number of SSc–CD4+CD25brightFoxP3+CD69+ cells increased significantly in each experimental condition, as shown in Fig. 4c.
Furthermore, Tregs purified via CD25 cell enrichment, before or after MSC co-culture, were evaluated for their immunosuppressive activity.
The spontaneous circulating Treg immunosuppressive activity in SSc patients was impaired significantly when compared to controls (35 226 ± 4409 cpm versus 12 658 ± 2663 cpm, respectively, P = 0·005). SSc Tregs regained their suppressive activity when co-cultured with both HC– and SSc–MSCs. In fact, no statistically significant difference was observed in proliferation assays when compared to controls (SSc–Tregs + HC–MSCs 12 655 ± 2047; SSc–Tregs + SSc–MSCs 12 939 ± 2728; HC–Tregs + HC–MSCs 13 108 ± 1633; HC–Tregs + SSc–MSCs 14 242 ± 2025, P = n.s., Fig. 4d).
Detection of cytokine production
We evaluated IL-6 and TGF-β gene expression profiles in MSCs. With regard to IL-6, we observed a significant increase of mRNA level in SSc–MSCs when compared to HC–MSCs (2·88 ± 0·18 versus 1·00 ± 0·19 mRNA levels, respectively; P = 0·003). The IL-6 gene expression was further increased significantly after co-culture both in patients and controls, although the higher levels were observed in SSc–MSCs when co-cultured with PBMCs (SSc–MSCs 7·83 ± 0·90 versus HC-MSCs 4·36 ± 0·41 mRNA levels, P < 0·05; Fig. 4e). TGF-β expression did not show any difference between HC– and SSc–MSCs before co-culturing with PBMCs. Of note, after co-culturing MSCs with PBMCs, we found a significant up-regulation of TGF-β expression in SSc–MSCs when compared with HC cells (4·23 ± 0·25 versus 1·20 ± 0·10 mRNA levels, respectively, P = 0·003, Fig. 4f). We did not observe any difference in IL-6 and TGF-β expression stratifying SSc patients in the two forms of the disease.
In view of the pronounced changes in both TGF-β and IL-6 mRNA production, both TGF-β and IL-6 were also studied at the supernatant protein level by ELISA. The results concerning TGF-β and IL-6 protein secretion mirrored the changes observed by qPCR results (Fig. 4g,h).
Discussion
Different mechanisms of MSCs-mediated immunosuppression might occur: the first mediated by several soluble factors, including TGF-β and IL-6 30, although the requirement of cell–cell contact cannot be excluded 31 and the second depending upon Treg generation 32–35. Tregs employ a variety of mechanisms to suppress immune responses, such as contact-dependent mechanisms between Treg and T effector cells, as well as the secretion of soluble factors. The suppressive function of Treg is known to be regulated by inhibitory cytokines, including TGF-β, IL-10 and the newly described IL-12 family member, IL-35. The importance of TGF-β and IL-10 on Treg suppressive function has been established clearly in mouse models lacking these cytokines, developing severe autoimmune disease at 4–5 weeks of age, associated with a reduced number of CD4+CD25+ Treg cells 36.
During human autoimmune diseases an impairment of Tregs has been observed, as well as the finding that these cells showed the capacity to block or reverse autoimmunity in a large number of experimental settings 37–41.
The evidence that Tregs can be induced when T cells are co-cultured in vitro with MSCs 6,11 suggested this interaction as a further potential therapeutic target during autoimmune diseases. At present, given that MSCs are already being utilized for the treatment of patients in clinical trials, a better understanding of the mechanisms mediating their effects in different autoimmune diseases is imperative.
We have shown previously that MSCs isolated from SSc patients displayed an early senescent status, as shown by their reduced telomerase activity 17. Senescence is characterized generally by both a decline in the cumulative number of cell population doublings and a limited lifespan, which are generally considered as age-related mechanisms 42. In this study we showed a significantly decreased proliferation rate in SSc–MSCs already within the early passages when compared to HC, and this result was confirmed by the lower Ki67 gene expression, which is associated strictly with cell proliferation 28. The decreased Ki67 gene expression found in SSc cells confirms that a large proportion of SSc–MSCs are in growth-arrested status (G0 phase of the cell cycle). The specific unreplicative phenotype within SSc–MSCs was strengthened by the observed increase of β-Gal activity when compared to HC, showing that these cells acquire a premature senescence habit.
It should be considered that the local microenvironment in which these cells normally live could induce a senescent phenotype, and to understand this mechanism we exposed our cells to sublethal doses of doxorubicin, a chemotherapeutic drug, which is able to induce premature ageing, inducing DNA strand-breaking 18. Furthermore, doxorubicin drives p53 protein accumulation 43, allowing time for faithful repair of DNA damage or, alternatively, eliminating cells with excessive DNA damage 44,45. P53 acts as transcriptional factor and activates directly the transcription of many genes, including p21. P21 is the first described downstream target of p53 and is an essential mediator of p53-dependent cell cycle arrest 46. Paradoxically, several studies showed that these well-established DNA damage response systems, distinctive of somatic cells, appear to be lacking in stem cells 47. The lack of p21 downstream activation after p53 accumulation permits bypassing the cellular quiescence induced specifically by p21, thus escaping senescence and acting as a sort of tolerance mechanism to genotoxic stresses 48,49. Using Western blot analysis we observed, after doxorubicin-induced damage, a normal increase of p53 protein stabilization without differences between HC– and SSc–MSCs. On the contrary, no increase of p21 protein level after doxorubicin injury was observed in HC cells despite a higher p53 level, confirming this specific tolerogenic mechanism in stem cells. We did not observe this mechanism operating within SSc–MSCs, the latter already expressing a higher p21 level in the absence of doxorubicin stress, which persisted after drug injury. These results confirmed premature ageing of these cells in SSc and suggested, at molecular level, their inability to escape to any additional stress.
Of interest, a recent report showed that SSc–MSCs, although senescent, maintained their ability to suppress in-vitro lymphocyte proliferation in mixed lymphocyte reactions 19, but the molecular pathways involved in this process were not investigated.
To understand the possible mechanisms involved in this process, we studied the cytokine profile produced by MSCs both from HC and SSc when co-cultured with PHA-conditioned T lymphocytes. Our results confirmed the inhibitory effect of SSc–MSCs on T cell proliferation, and this activity was associated with a higher IL-6 level in SSc–MSCs when compared to cells from HC. Enhanced IL-6 levels are believed to play a role in triggering the immunosuppressive effect of MSC on T cells 26. Furthermore, IL-6 production has been associated frequently with ageing 25, and this production might play a role in preserving the suppressive effect of aged MSCs on T lymphocytes via production of the anti-proliferative prostaglandin E2 (PGE2) in these cells 30.
It is intriguing to speculate that the higher IL-6 production, observed in SSc–MSCs, might potentially cover the progressive loss of function of aged cells, preserving their immunosuppressive ability.
MSCs immunomodulation takes place over a multi-stage process involving not only their constitutive ability to suppress T lymphocyte proliferation, but also involving the generation of inducted Tregs 33–35. This induction requires the presence of TGF-β 50, which is considered the major soluble factor associated with MSC promotion of Tregs in vivo 24,32,33,51–54. It is of interest that, in our setting, a recent report 32 identified a specific role for TGF-β-induced Tregs in MSCs protection against fibrillin-mutated systemic sclerosis, an animal model of the disease. In this regard, in our experiments the higher levels of TGF-β shown in SSc–MSCs, when co-cultured with CD4+CD25– lymphocytes, might allow normal induction and expansion of fully functioning Tregs. Therefore, MSCs from scleroderma patients displayed not only a specific anti-proliferative activity, but also normal ability in promoting the generation of CD4+CD25brightFoxP3+ cells.
Notably, we observed a reduced activity of circulating Tregs in our patients and, as already reported, this impaired activity was associated with a decreased surface expression of CD69 on these cells. CD69 is an early membrane receptor, expressed transiently on activated lymphocytes. Although early in-vitro data suggested that CD69 exerts a proinflammatory function, recent in-vivo results indicate that this receptor might act as a regulatory molecule, modulating the inflammatory response 55. In addition, CD69 might act specifically on the Treg cell subset, directly suppressing the activity of effector T cells 56. After MSC/CD4+CD25– co-cultures, we observed that SSc cells were able to induce normally functioning Tregs from the T lymphocytes of HC and SSc patients. As CD69 expression by Tregs has been associated with the production of TGF-β 55, we analysed the surface expression of this molecule in induced Tregs. Interestingly, although the CD69 surface expression was decreased in circulating SSc Tregs, an increased expression of this molecule was observed in induced cells without differences between patients and controls. Consistent with this evidence, induced SSc Tregs showed a normal ability to inhibit immunoproliferation of CD4+ T cells. We observed an increase of TGF-β production in the supernatants of SSc–MSC co-cultures, and this production was associated with an increase of TGF-β gene expression in the SSc–MSCs. During SSc, IL-6 and TGF-β are involved not only in immunoregulatory mechanisms but also in the pathogenesis of the fibrotic process, which is the main feature of the disease. Further experiments are ongoing in our laboratory in order to evaluate the role of these cytokines, produced by MSCs, on collagen production as well as on modulation of the myofibroblast phenotype.
These findings might suggest that, during SSc, an adaptive cytokine profile with an increase in both TGF-β and IL-6 expression avoids senescence interfering with MSC activity, thus maintaining their role in inducing fully functional Tregs.
In this work we did not investigate the immunosuppressive role of senescent SSc–MSCs on dendritic cell functions, already shown in other conditions. It is well known that these cells produce higher levels of IL-10 and might contribute to the specific cytokine milieu in the disease 57. Furthermore, recent reports showed that dendritic cells might express TGF-β and support fibrogenesis 58. In this setting, the possible modulation of dendritic cells might offer a new future target for MSC therapeutic application.
The in-vitro immunosuppressive activity of MSCs is mediated by direct interaction with lymphocytes at a MSC : PBMC ratio of 1:1 59. This raises a question: are these MSC : PBMC ratios achieved normally in vivo, when MSC are utilized clinically in the clinical setting? Indeed, according to the immunosuppression observed in vivo 60, relatively high numbers of MSC should be injected to obtain this effect. This may be of great relevance in planning the dose of MSC to administer. However, some difficulties in obtaining a sufficient number of MSCs for clinical purposes have been described previously 61. In this light, the MSC ability demonstrated in recruiting, modulating and maintaining Tregs functions over time might provide a feasible strategy to enhance their immunosuppressive activity. This finding might explain the therapeutic effect observed following the injection of relatively low numbers of MSC compared to the number of lymphocytes present in a given patient and confirming their potential applications, not only in haematological clinical settings, but possibly also in autoimmunity.
In conclusion, although senescent, the SSc–MSCs maintain considerable immunosuppressive properties and a normal ability to generate functional Tregs. Therefore, the evidence of their senescence does not represent a limitation for their potential use, both in cellular and regenerative medicine, to target scleroderma.
Acknowledgments
The authors thank Dr Maria Paola NanniCosta and Dr Samuele Di Giovanni for their contribution in BM aspiration.
Funding
This work was supported by PRIN (Project of National Interest) 200884K784_005 2008, FIRA (Italian Foundation for Research in Arthritis) 2009.
Disclosure
The authors declare that there are no conflicts of interest.
References
- 1.Caplan AI. Why are MSCs therapeutic? New data: new insight. J Pathol. 2009;217:318–324. doi: 10.1002/path.2469. [DOI] [PMC free article] [PubMed] [Google Scholar]
- 2.Pittenger MF, Mackay AM, Beck SC, et al. Multilineage potential of adult human mesenchymal stem cells. Science. 1999;284:143–147. doi: 10.1126/science.284.5411.143. [DOI] [PubMed] [Google Scholar]
- 3.Le Blanc K, Frassoni F, Ball L, et al. Developmental Committee of the European Group for Blood and Marrow transplantation. Mesenchymal stem cells for treatment of steroid-resistant, severe, acute graft-versus-host disease: a Phase II study. Lancet. 2008;371:1579–1586. doi: 10.1016/S0140-6736(08)60690-X. [DOI] [PubMed] [Google Scholar]
- 4.Dominici M, Le Blanc K, Mueller I, et al. Minimal criteria for defining multipotent mesenchymal stromal cells. The International Society for Cellular Therapy position statement. Cytotherapy. 2006;8:315–317. doi: 10.1080/14653240600855905. [DOI] [PubMed] [Google Scholar]
- 5.Oswald J, Boxberger S, Jørgensen B, et al. Mesenchymal stem cells can be differentiated into endothelial cells in vitro. Stem Cells. 2004;22:377–384. doi: 10.1634/stemcells.22-3-377. [DOI] [PubMed] [Google Scholar]
- 6.Aggarwal S, Pittenger MF. Human mesenchymal stem cells modulate allogeneic immune cell responses. Blood. 2005;105:1815–1822. doi: 10.1182/blood-2004-04-1559. [DOI] [PubMed] [Google Scholar]
- 7.Yi T, Song SU. Immunomodulatory properties of mesenchymal stem cells and their therapeutic applications. Arch Pharm Res. 2012;35:213–221. doi: 10.1007/s12272-012-0202-z. [DOI] [PubMed] [Google Scholar]
- 8.Jiang X, Zhang Y, Liu B, et al. Human mesenchymal stem cells inhibit differentiation and function of monocyte-derived dendritic cells. Blood. 2005;105:4120–4126. doi: 10.1182/blood-2004-02-0586. [DOI] [PubMed] [Google Scholar]
- 9.Shi M, Liu ZW, Wang FS. Immunomodulatory properties and therapeutic application of mesenchymal stem cells. Clin Exp Immunol. 2011;164:1–8. doi: 10.1111/j.1365-2249.2011.04327.x. [DOI] [PMC free article] [PubMed] [Google Scholar]
- 10.Burr SP, Dazzi F, Garden OA. Mesenchymal stromal cells and regulatory T cells: the Yin and Yang of peripheral tolerance? Immunol Cell Biol. 2013;91:12–18. doi: 10.1038/icb.2012.60. [DOI] [PubMed] [Google Scholar]
- 11.Prevosto C, Zancolli M, Canevali P, et al. Generation of CD4+ or CD8+ regulatory T cells upon mesenchymal stem cell–lymphocyte interaction. Haematologica. 2007;92:881–888. doi: 10.3324/haematol.11240. [DOI] [PubMed] [Google Scholar]
- 12.Nauta AJ, Fibbe WE. Immunomodulatory properties of mesenchymal stromal cells. Blood. 2007;110:3499–3506. doi: 10.1182/blood-2007-02-069716. [DOI] [PubMed] [Google Scholar]
- 13.Long SA, Buckner JH. CD4+FOXP3+ T regulatory cells in human autoimmunity: more than a numbers game. J Immunol. 2011;187:2061–2066. doi: 10.4049/jimmunol.1003224. [DOI] [PMC free article] [PubMed] [Google Scholar]
- 14.Cipriani P, Fulminis A, Pingiotti E, et al. Resistance to apoptosis in circulating alpha/beta and gamma/delta T lymphocytes from patients with systemic sclerosis. J Rheumatol. 2006;33:2003–2014. [PubMed] [Google Scholar]
- 15.Bosello S, De Luca G, Tolusso B, et al. B cells in systemic sclerosis: a possible target for therapy. Autoimmun Rev. 2011;10:624–630. doi: 10.1016/j.autrev.2011.04.013. [DOI] [PubMed] [Google Scholar]
- 16.van Lieshout AW, Vonk MC, Bredie SJ, et al. Enhanced interleukin-10 production by dendritic cells upon stimulation with Toll-like receptor 4 agonists in systemic sclerosis that is possibly implicated in CCL18 secretion. Scand J Rheumatol. 2009;38:282–290. doi: 10.1080/03009740802572467. [DOI] [PubMed] [Google Scholar]
- 17.Cipriani P, Guiducci S, Miniati I, et al. Impaired endothelial cell differentiation from bone marrow-derived mesenchymal stem cells: new insight into pathogenesis of systemic sclerosis. Arthritis Rheum. 2007;56:1994–2004. doi: 10.1002/art.22698. [DOI] [PubMed] [Google Scholar]
- 18.Campisi J. Senescent cells, tumor suppression, and organismal aging: good citizens, bad neighbors. Cell. 2005;120:513–522. doi: 10.1016/j.cell.2005.02.003. [DOI] [PubMed] [Google Scholar]
- 19.Larghero J, Farge D, Braccini A, et al. Phenotypical and functional characteristics of in vitro expanded bone marrow mesenchymal stem cells from patients with systemic sclerosis. Ann Rheum Dis. 2008;67:443–449. doi: 10.1136/ard.2007.071233. [DOI] [PubMed] [Google Scholar]
- 20.English K, Ryan JM, Tobin L, et al. Cell contact, prostaglandin E(2) and transforming growth factor beta 1 play non-redundant roles in human mesenchymal stem cell induction of CD4+CD25high forkhead box P3+ regulatory T cells. Clin Exp Immunol. 2009;156:149–160. doi: 10.1111/j.1365-2249.2009.03874.x. [DOI] [PMC free article] [PubMed] [Google Scholar]
- 21.De Miguel MP, Fuentes-Julián S, Blázquez-Martínez A, et al. Immunosuppressive properties of mesenchymal stem cells: advances and applications. Curr Mol Med. 2012;12:574–591. doi: 10.2174/156652412800619950. [DOI] [PubMed] [Google Scholar]
- 22.Di Nicola M, Carlo-Stella C, Magni M, et al. Human bone marrow stromal cells suppress T-lymphocyte proliferation induced by cellular or nonspecific mitogenic stimuli. Blood. 2002;15:3838–3843. doi: 10.1182/blood.v99.10.3838. [DOI] [PubMed] [Google Scholar]
- 23.Deuse T, Stubbendorff M, Tang-Quan K, et al. Immunogenicity and immunomodulatory properties of umbilical cord lining mesenchymal stem cells. Cell Transplant. 2011;20:655–667. doi: 10.3727/096368910X536473. [DOI] [PubMed] [Google Scholar]
- 24.Nemeth K, Keane-Myers A, Brown JM, et al. Bone marrow stromal cells use TGF-beta to suppress allergic responses in a mouse model of ragweed-induced asthma. Proc Natl Acad Sci USA. 2010;107:5652–5657. doi: 10.1073/pnas.0910720107. [DOI] [PMC free article] [PubMed] [Google Scholar]
- 25.Singh T, Newman AB. Inflammatory markers in population studies of aging. Ageing Res Rev. 2010;10:319–329. doi: 10.1016/j.arr.2010.11.002. [DOI] [PMC free article] [PubMed] [Google Scholar]
- 26.Djouad F, Charbonnier LM, Bouffi C, et al. Mesenchymal stem cells inhibit the differentiation of dendritic cells through aninterleukin-6-dependent mechanism. Stem Cells. 2007;25:2025–2032. doi: 10.1634/stemcells.2006-0548. [DOI] [PubMed] [Google Scholar]
- 27.Radstake TRDJ, van Bon L, Broen J, et al. Increased frequency and compromised function of T regulatory cells in systemic sclerosis (SSc) is related to a diminished CD69 and TGFβ expression. PloS One. 2009;6:e5981–5992. doi: 10.1371/journal.pone.0005981. [DOI] [PMC free article] [PubMed] [Google Scholar]
- 28.Scholzen T, Gerdes J. The Ki-67 protein: from the known and the unknown. J Cell Physiol. 2000;182:311–322. doi: 10.1002/(SICI)1097-4652(200003)182:3<311::AID-JCP1>3.0.CO;2-9. [DOI] [PubMed] [Google Scholar]
- 29.Buttiglieri S, Ruella M, Risso A, et al. The aging effect of chemotherapy on cultured human mesenchymal stem cells. Exp Hematol. 2011;39:1171–1181. doi: 10.1016/j.exphem.2011.08.009. [DOI] [PubMed] [Google Scholar]
- 30.Landgraf K, Brunauer R, Lepperdinger G, et al. The suppressive effect of mesenchymal stromal cells on T cell proliferation is conserved in old age. Transpl Immunol. 2011;25:167–172. doi: 10.1016/j.trim.2011.06.007. [DOI] [PubMed] [Google Scholar]
- 31.Quaedackers ME, Baan C, Weimar W, et al. Cell contact interaction between adipose-derived stromal cells and allo-activated T lymphocytes. Eur J Immunol. 2009;39:3436–3446. doi: 10.1002/eji.200939584. [DOI] [PubMed] [Google Scholar]
- 32.Akiyama K, Chen C, Wang D, et al. Mesenchymal-stem-cell induced immunoregulation involves FAS-ligand-/FAS-mediated T cell apoptosis. Cell Stem Cell. 2012;10:544–545. doi: 10.1016/j.stem.2012.03.007. [DOI] [PMC free article] [PubMed] [Google Scholar]
- 33.Kong QF, Sun B, Bai SS, et al. Administration of bone marrow stromal cells ameliorates experimental autoimmune myasthenia gravis by altering the balance of Th1/Th2/Th17/Treg cell subsets through the secretion of TGFbeta. J Neuroimmunol. 2009;207:83–91. doi: 10.1016/j.jneuroim.2008.12.005. [DOI] [PubMed] [Google Scholar]
- 34.Ghannam S, Pene J, Torcy-Moquet G, et al. Mesenchymal stem cells inhibit human Th17 cell differentiation and function and induce a T regulatory cell phenotype. J Immunol. 2010;185:302–312. doi: 10.4049/jimmunol.0902007. [DOI] [PubMed] [Google Scholar]
- 35.Rafei M, Campeau PM, Aguilar-Mahecha A, et al. Mesenchymal stromal cells ameliorate experimental autoimmune encephalomyelitis by inhibiting CD4 Th17 T cells in a CC chemokine ligand 2-dependent manner. J Immunol. 2009;182:5994–6002. doi: 10.4049/jimmunol.0803962. [DOI] [PubMed] [Google Scholar]
- 36.Goodman WA, Cooper KD, McCormick TS. Regulation generation: the suppressive functions of human regulatory T cells. Crit Rev Immunol. 2012;32:65–79. doi: 10.1615/critrevimmunol.v32.i1.40. [DOI] [PMC free article] [PubMed] [Google Scholar]
- 37.Wright GP, Stauss HJ, Ehrenstein MR. Therapeutic potential of Tregs to treat rheumatoid arthritis. Semin Immunol. 2011;23:195–201. doi: 10.1016/j.smim.2011.07.004. [DOI] [PubMed] [Google Scholar]
- 38.Iikuni N, Lourenço EV, Hahn BH, et al. Regulatory T cells directly suppress B cells in systemic lupus erythematosus. J Immunol. 2009;183:1518–1522. doi: 10.4049/jimmunol.0901163. [DOI] [PMC free article] [PubMed] [Google Scholar]
- 39.Brusko TM, Putnam AL, Bluestone JA. Human regulatory T cells: role in autoimmune disease and therapeutic opportunities. Immunol Rev. 2008;223:371–390. doi: 10.1111/j.1600-065X.2008.00637.x. [DOI] [PubMed] [Google Scholar]
- 40.Hess AD. Modulation of graft-versus-host disease: role of regulatory T lymphocytes. Biol Blood Marrow Transplant. 2006;12(Suppl. 2):13–21. doi: 10.1016/j.bbmt.2005.11.002. [DOI] [PubMed] [Google Scholar]
- 41.Shin L, Peterson DA. Human mesenchymal stem cell grafts enhance normal and impaired wound healing by recruiting existing endogenous tissue stem/progenitor cells. Stem Cells Transl Med. 2013;2:33–42. doi: 10.5966/sctm.2012-0041. [DOI] [PMC free article] [PubMed] [Google Scholar]
- 42.Wagner W, Bork S, Horn P, et al. Aging and replicative senescence have related effects on human stem and progenitor cells. Open Access. 2009;4:1–13. doi: 10.1371/journal.pone.0005846. [DOI] [PMC free article] [PubMed] [Google Scholar]
- 43.Kurz EU, Douglas P, Lees-Miller SP. Doxorubicin activates ATM-dependent phosphorylation of multiple downstream targets in part through the generation of reactive oxygen species. J Biol Chem. 2004;17:53272–53281. doi: 10.1074/jbc.M406879200. [DOI] [PubMed] [Google Scholar]
- 44.Vousden KH, Prives C. Blinded by the SteLight: the growing complexity of p53. Cell. 2009;137:413–431. doi: 10.1016/j.cell.2009.04.037. [DOI] [PubMed] [Google Scholar]
- 45.Kruse J-P, Gu W. Modes of p53 regulation. Cell. 2009;137:609–622. doi: 10.1016/j.cell.2009.04.050. [DOI] [PMC free article] [PubMed] [Google Scholar]
- 46.Ju Z, Choudhury AR, Rudolph KL, et al. A dual role of p21 in stem cell aging. Acad Sci. 2007;1100:333–344. doi: 10.1196/annals.1395.036. [DOI] [PubMed] [Google Scholar]
- 47.Zhao T, Xu Y. p53 and stem cells: new developments and new concerns. Trends Cell Biol. 2010;20:170–175. doi: 10.1016/j.tcb.2009.12.004. [DOI] [PubMed] [Google Scholar]
- 48.Tsai CC, Chen YJ, Yew TL, et al. Hypoxia inhibits senescence and maintains mesenchymal stem cell properties through down-regulation of E2A-p21 by HIF-TWIST. Blood. 2011;117:459–469. doi: 10.1182/blood-2010-05-287508. [DOI] [PubMed] [Google Scholar]
- 49.Brandl A, Meyer M, Bechmann V, et al. Oxidative stress induces senescence in human mesenchymal stem cells. Exp Cell Res. 2011;317:1541–1547. doi: 10.1016/j.yexcr.2011.02.015. [DOI] [PubMed] [Google Scholar]
- 50.English K, Ryan JM, Tobin L, et al. Cell contact, prostaglandin E(2) and transforming growth factor beta 1 play non-redundant roles in human mesenchymal stem cell induction of CD4+CD25(high) forkhead box P3+ regulatory T cells. Clin Exp Immunol. 2009;156:149–160. doi: 10.1111/j.1365-2249.2009.03874.x. [DOI] [PMC free article] [PubMed] [Google Scholar]
- 51.Zhao W, Wang Y, Wang D, et al. TGF-beta expression by allogeneic bone marrow stromal cells ameliorates diabetes in NOD mice through modulating the distribution of CD4+ T cell subsets. Cell Immunol. 2008;253:23–30. doi: 10.1016/j.cellimm.2008.06.009. [DOI] [PubMed] [Google Scholar]
- 52.Fu S, Zhang N, Yopp AC, et al. TGF-beta induces Foxp3+ T regulatory cells from CD4+ CD25-precursors. Am J Transplant. 2004;4:1614–1627. doi: 10.1111/j.1600-6143.2004.00566.x. [DOI] [PubMed] [Google Scholar]
- 53.Yamagiwa S, Gray JD, Hashimoto S, et al. A role for TGFbeta in the generation and expansion of CD4+CD25+ regulatory T cells from human peripheral blood. J Immunol. 2001;166:7282–7289. doi: 10.4049/jimmunol.166.12.7282. [DOI] [PubMed] [Google Scholar]
- 54.Zheng SG, Gray JD, Ohtsuka K, et al. Generation ex vivo of TGFbeta-producing regulatory T cells from CD4+CD25– precursors. J Immunol. 2002;169:4183–18. doi: 10.4049/jimmunol.169.8.4183. [DOI] [PubMed] [Google Scholar]
- 55.Sancho D, Gómez M, Sánchez-Madrid F. CD69 is an immunoregulatory molecule induced following activation. Trends Immunol. 2005;26:136–140. doi: 10.1016/j.it.2004.12.006. [DOI] [PubMed] [Google Scholar]
- 56.Sekar D, Hahn C, Brüne B, et al. Apoptotic tumor cells induce IL-27 release from human DCs to activate Treg cells that express CD69 and attenuate cytotoxicity. Eur J Immunol. 2012;42:1585–1598. doi: 10.1002/eji.201142093. [DOI] [PMC free article] [PubMed] [Google Scholar]
- 57.Kucharz EJ, Brzezinska-Wcislo L, Kotulska A, et al. Elevated serum level of interleukin-10 in patients with systemic sclerosis. Clin Rheumatol. 1997;16:638–639. doi: 10.1007/BF02247812. [DOI] [PubMed] [Google Scholar]
- 58.Gruschwitz MS, Hornstein OP. Expression of transforming growth factor type beta on human epidermal dendritic cells. J Invest Dermatol. 1992;99:114–116. doi: 10.1111/1523-1747.ep12611890. [DOI] [PubMed] [Google Scholar]
- 59.Tse WT, Pendleton JD, Beyer WM, et al. Suppression of allogeneic T-cell proliferation by human marrow stromal cells: implications in transplantation. Transplantation. 2003;75:389–397. doi: 10.1097/01.TP.0000045055.63901.A9. [DOI] [PubMed] [Google Scholar]
- 60.Le Blanc K, Rasmusson I, Sundberg B, et al. Treatment of severe acute graft-versus-host disease with third party haploidentical mesenchymal stem cells. Lancet. 2004;363:1439–1441. doi: 10.1016/S0140-6736(04)16104-7. [DOI] [PubMed] [Google Scholar]
- 61.Di Ianni M, Del Papa B, Zei T, et al. T regulatory cell separation for clinical application. Transfus Apher Sci. 2012;47:213–216. doi: 10.1016/j.transci.2012.06.007. [DOI] [PubMed] [Google Scholar]