

Abstract
Following oxygenation of arachidonic acid by cyclooxygenase to form prostaglandin H2 (PGH2), a variety of prostanoids can be generated with diverse physiologic effects on pain, inflammation, allergy, cardiovascular system, cancer, etc. To facilitate the quantitative analysis of prostanoids in human serum of cell culture, an ultra-high pressure LC (UHPLC)/MS/MS method was developed and validated for the measurement of six eicosanoids belonging to the cyclooxygenase pathway: PGE2, PGD2, 8-iso-PGF2α, PGF2α, 6-keto-PGF1α, and thromboxane B2 (TXB2). Selectivity, matrix effects, calibration model, precision, and accuracy (intraday and interday), lower limit of quantitation (LLOQ), recovery, stability, and sample dilution were evaluated. Fast UHPLC separation was carried out in only 0.5 min with isocratic elution, and each prostanoid was measured using negative electrospray ionization MS with collision-induced dissociation and selected reaction monitoring. UHPLC/MS/MS provided high throughput with peak widths of approximately 3 s and an LLOQ of 0.020 ng/mL for PGE2, 0.027 ng/mL for PGD2, 0.152 ng/mL for 8-iso-PGF2α, 0.179 ng/mL for PGF2α and 6-keto-PGF1α, and 0.013 ng/mL for TXB2.
Cyclooxygenases (COXs) catalyze the oxygenation of arachidonic acid to prostaglandin H2 (PGH2), which serves as a common substrate for various distal isomerases that generate five distinct primary prostanoids, PGE2, PGD2, PGF2α, PGI2, and thromboxane A2 (TXA2), and two stable, nonenzymatic products of PGI2 and TXA2, 6-keto-PGF1α and TXB2 (1), respectively. These prostanoids function as extracellular and intracellular messengers that produce diverse physiologic or pathophysiologic responses depending on the relative amount of each (2). The prostanoids PGE2, PGD2, and PGF2α have inflammatory, vasodilatatory or effects (3). PGI2, a member of the prostacyclin family, has anti-aggregatory and vasodilatatory effects (4). In contrast, thromboxane TXA2 has pro-aggregatory, vasoconstrictory, or bronchoconstrictory activities (5). 8-Iso-PGF2α is formed through nonenzymatic oxidation of arachidonic acid and is often used as a marker of oxidative stress (6). Altogether, these structurally related prostanoids are important due to their diverse physiologic effects on pain (7), inflammation and fever (8), allergies (9), platelets (10), the cardiovascular system (11), cancer (12), renal function (13), reproduction (14), and Alzheimer’s disease (15).
A variety of analytical methods have been developed for the analysis of prostanoids. Although ELISAs and radioimmunoassays are often used to measure prostanoid levels (16, 17), they suffer from cross-reactivity and do not allow profiling of multiple prostanoids at the same time. HPLC with UV or fluorescence detection has been used to measure prostanoids (18), but this approach is limited to samples containing high prostanoid levels because of interference from unrelated compounds. Although GC/MS provides greater sensitivity and selectivity (19, 20), it is not suitable for thermally labile prostanoids and requires preliminary TLC purification and sample derivatization before analysis.
Like GC/MS, HPLC/MS and HPLC/MS/MS provide both chromatographic and mass spectrometric selectivity for the quantitative analysis of prostanoids (21–23). Unlike GC/MS, HPLC/MS and HPLC/MS/MS are suitable for thermally labile compounds and do not require multistep purification and derivatization of prostanoids prior to analysis. The performance of HPLC has recently been improved through the use of smaller diameter column packing materials (approximately 1.7 μm) and higher operating pressures in a system called ultra-high pressure LC (UHPLC). Compared with HPLC, UHPLC can provide higher sensitivity, better chromatographic resolution, and faster separations (24, 25). UHPLC is also compatible with MS/MS (UHPLC/MS/MS).
Previously, we reported a method based on HPLC/MS/MS for the quantitative analysis of PGE2 and PGD2 in biological fluids (21), which used deuterated surrogate standards for PGE 2 and PGD2. That paper established that a separate surrogate standard is required for PGD2 to correct for its exceptional instability during sample handling. Since our publication, there have been several UHPLC/MS/MS methods (26–28) for the quantitative analysis of prostanoid mixtures containing PGD2, but none has controlled for its instability. Also, these newer UHPLC/MS/MS methods require 5.5 to 14 min/analysis, which is not significantly different from our HPLC/MS/MS approach (13 min/analysis).
Therefore, we have developed and validated a robust and ultrafast UHPLC/MS/MS method for the simultaneous quantitative determination of six prostanoids including PGD2 in biological fluids. This method is 10-fold faster than any previous HPLC/MS/MS or UHPLC/MS/MS based assay and controls for the instability of PGD2 by including a combination of internal and surrogate standards. Dulbecco’s modified Eagle’s medium (DMEM) containing 10% pooled drug-free blank human serum was used as the biological fluid, since it is frequently used for the culture of many cell lines. The UHPLC/MS/MS assay was validated according to the U.S. Food and Drug Administration guidelines for validation of bioanalytical methods (29) with respect to selectivity, matrix effects, calibration model, precision and accuracy (intraday and interday), lower LOQ (LLOQ), recovery from spiked biological fluid samples, stability (benchtop, short and long term, autosampler, and freeze–thaw), and sample dilution. This new UHPLC/MS/MS method was shown to provide higher throughput and superior LLOQ values than our previous HPLC/MS/MS method without sacrificing other performance criteria.
Experimental
Chemicals and Reagents
Acetonitrile.—HPLC grade (Fisher, Rockford, IL).
Methanol.—HPLC grade (Fisher).
Hexane.—HPLC grade (Fisher).
Ethyl acetate.—HPLC grade (Fisher).
Water.—From a Milli-Q water purification system (Millipore, Billerica, MA).
Formic acid.—ACS reagent grade (Sigma-Aldrich, St. Louis, MO).
Citric acid.—ACS reagent grade (Sigma-Aldrich).
Butylated hydroxytoluene (BHT).—FCC grade, Sigma-Aldrich.
Lipopolysaccharide (LPS).—Sigma-Aldrich.
DMEM.—Mediatech (Manassas, VA).
Hanks’ balanced salt solution (HBSS).—Invitrogen (Carlsbad, CA).
Fetal bovine serum (FBS).—Invitrogen.
Penicillin and streptomycin.—Life Technology (Grand Island, NY).
CAY10526, 4-(benzo[b]thiophen-2-yl)-3-bromo-5-hydroxydihydrofuran-2(3H)-one.—Cayman Chemicals (Ann Arbor, MI).
HQL-79, 4-(diphenylmethoxy)-1-[3-(1H-tetrazol-5-yl) propyl-piperidine—Cayman Chemicals.
Reference Materials
Reference standards for PGE2, PGD2, 8-iso-PGF2α, PGF2α, 6-keto-PGF1α, TXB2, d4-PGE2, and d4-PGD2 were purchased from Cayman Chemicals.
Blank Serum
Six lots of pooled blank human serum were purchased from Bioreclamation (Hicksville, NY).
Apparatus
Vortex mixer.—Type 37600 mixer (Barnstead Thermolyne, Dubuque, IA)
Centrifuge.—5810R (Eppendorf, Hamburg, Germany).
UHPLC system.—Shimadzu (Kyoto, Japan) Nexera UHPLC system consisting of two pumps, degasser, autosampler, and column oven.
MS/MS system.—Shimadzu LCMS-8030 triple quadrupole mass spectrometer equipped with electrospray ionization (ESI).
Column.—Waters (Milford, MA) Acquity UPLC BEH C18 (50 × 2.1 mm id, 1.7 μm particle size) analytical column.
UHPLC/MS/MS and HPLC/MS/MS
UHPLC separations were carried out using a 0.5 min run with acetonitrile–aqueous 0.1% formic acid (40 + 60, v/v) mobile phase at a flow rate of 1.2 mL/min. The UHPLC column temperature was 50°C. The operating pressure was 0.690 mBar (10 000 psi), and the sample injection volume was 5 μL. Prostanoids were detected using negative ESI. The ion source conditions were optimized as follows: 350°C interface temperature; 3500 V interface voltage; 250°C desolvation line temperature; 400°C heat block temperature; 3 L/min nebulizer gas; and 15 L/min drying gas. The UHPLC/MS/MS system was controlled using Shimadzu LabSolutions 5.41.239 software. During MS/MS, argon was used for collision-induced dissociation (CID), and the Q1, Q3 pre-bias, and collision energies were optimized for each analyte. The selected reaction monitoring (SRM) dwell time was 15 ms, and the switching time between SRM transitions was 1 ms.
Preparation of Standard Solutions and QC Samples
Stock standard solutions of the six prostanoids (PGE2, PGD2, 8-iso-PGF2α, PGF2α, 6-keto-PGF1α, and TXB2) and two internal standards (d4-PGE2, and d4-PGD2) were prepared in methanol at a concentration of 100 μg/mL each. Chemical structures for these compounds are shown in Figure 1. Working standard mixture solutions of the six analytes and two internal standards at 10 μg/mL each were prepared by dilution of the stock solutions in methanol–water (50 + 50, v/v). All stock and working solutions were stored at −20°C in the dark. The cell culture medium DMEM containing 10% pooled blank human serum was spiked with calibration standards containing the six analytes at concentrations of 0.05, 0.1, 0.5, 1, 2, 5, 10, 20, 50, 100, 200, 500, 800, and 1000 ng/mL to make a final volume of 500 μL for each solution. Samples for QC were prepared by spiking appropriate aliquots of the working solution into DMEM at concentrations of 0.1, 4, 400, and 750 ng/mL. The spiked samples were treated as described in the Biological Sample Extraction section below.
Figure 1.
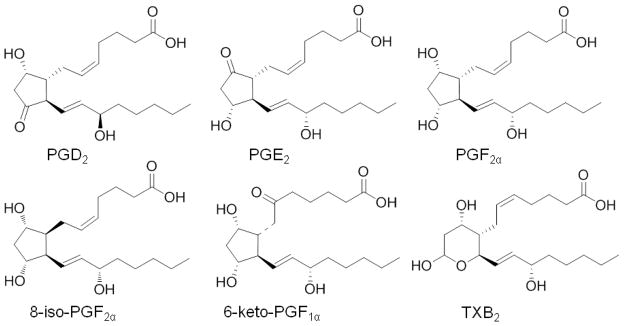
Chemical structures of PGE2, PGD2, PGF2α, 8-iso-PGF2α, 6-keto-PGF1α, and TXB2.
Cell Culture
Bone marrow-derived macrophage (BMDM) was isolated from the rear legs of sacrificed C57BL/6 mice as described previously (2). Briefly, the harvested rear legs were soaked in HBSS containing 2% heat-inactivated FBS under aseptic conditions. The bone marrow cells were obtained by flushing the tibias and femurs using HBSS followed by culturing in DMEM supplemented with 10% FBS, 10% L929 cell-conditioned (LCC) medium, 100 U/mL penicillin, and 100 μg/mL streptomycin. After 72 h, the nonadherent cells were removed by changing the medium. Adherent cells were subsequently propagated in culture. Cells were split at day 7 using 1 mM EDTA and plated at a density of 5 × 10⁵/mL into six-well plates with LCC medium. On day 8, the cell culture medium was changed to DMEM containing 1% FBS, penicillin, and streptomycin. After 1.5 h, the inhibitor CAY10526 or HQL-79 (5 or 10 μM, respectively) was added, and 1 μg/mL LPS was added 2 h later. Cells were incubated in 5% CO2 humidified air at 37°C. After 16 h of LPS treatment, the cell supernatants were collected and stored at 80°C until analysis. LPS was used to stimulate BMDM cells to activate COX-2 production and prostaglandin synthesis.
Biological Sample Extraction
To each sample (500 μL), d4-PGD2 was added as a surrogate standard for PGD2 analysis, and d4-PGE2 was added as an internal standard for all other prostanoids. Next, 80 μL of 1 M citric acid in water and 10 μL of 10% BHT in hexane were added to prevent free radical-catalyzed peroxidation. Prostanoids were extracted by adding 4 mL of hexane–ethyl acetate (50 + 50, v/v) followed by vortex mixing for at least 1 min. After centrifugation at 3500 × g for 10 min, the upper organic phase was collected. The extraction procedure was repeated, and the organic phases were combined and evaporated to dryness under a stream of nitrogen gas. Immediately before analysis, each extract was reconstituted in 50 μL methanol–water (1 + 1, v/v) and centrifuged at 12 000 × g for 10 min. The final concentration of each internal standard was 56.3 nM (20 ng/mL; 21).
Selectivity
Selectivity was evaluated by analyzing DMEM containing 10% pooled blank human serum from six different lots (BRH 460480, BRH 458812, BRH 458813, BRH 458814, BRH 458815, and BRH 458816) to test for potential matrix interference with prostanoids and internal standards during UHPLC/MS/MS.
Calibration Curves
The construction of the calibration curves was based on the analysis of the calibration standards (n = 4) at 14 concentration levels ranging from 0.05 to 1000 ng/mL and plotting the peak area ratios of prostanoids to internal standard against the nominal calibration standard concentration. Following the evaluation of different weighting factors, linear regression analysis was carried out with a 1/x2 (x being the concentration) weighting factor. The zero value was not used as a point, and the calibration curve was not forced through it. To be valid, (R) of the calibration curve had to the correlation coefficient be >0.99. Furthermore, the LLOQ had to be determined with a precision <20% and accuracy between 80 and 120%, with S/N > 5.
Intraday and Interday Precision and Accuracy
The intraday and interday precision expressed as RSD and the accuracy were evaluated by repeated analysis of five replicates of QC samples at their respective LLOQ, low QC, medium QC, and high QC levels (as detailed in the Preparation of Standard Solutions and QC Samples section). The interday precision and accuracy were assessed by analyzing four levels of all QC samples (0.1, 4, 400, and 750 ng/mL) on 4 consecutive days. The concentration of each sample was calculated using a calibration curve of calibration standards prepared and analyzed on the same day. The criteria for acceptability of the data included accuracy within 85–115% of the nominal values and precision within ±15% RSD, except for the LLOQ, which should be within 80–120% for accuracy and <20% RSD for precision.
Recovery
The relative recovery (%) of prostanoids from DMEM was evaluated by comparing five replicates of QC samples at the four QC concentration levels (0.1, 4, 400, and 750 ng/mL) for prostanoids and at 20 ng/mL for the internal standards with those of postextraction spiked samples.
Matrix Effects
To determine the potential for serum matrix effects to cause suppression or enhancement of ionization of prostanoids and internal standards, six lots of pooled blank human serum (BRH 460480, BRH 458812, BRH 458813, BRH 458814, BRH 458815, and BRH 458816) were processed and then reconstituted with prostanoids at four concentration levels (0.1, 4, 400, and 750 ng/mL) with internal standards (20 ng/mL). The corresponding peak areas of these samples (A) were compared with those of equivalent concentrations of prostanoids (working standards) and internal standards in mobile phase [methanol–water (50 + 50, v/v; B)]. The ratio A/B × 100 was used to determine the percentage of possible matrix effects on the ionization efficiency of prostanoids and internal standards.
Stability Study
The stabilities of prostanoids and internal standards in the injection solvent were determined by analyzing pretreated QC samples stored in the autosampler at 4°C for 24 and 48 h after the initial injection. The initial peak areas of the prostanoids and internal standards were used as the references to determine stability. The stabilities of prostanoids in DMEM for 2, 6, and 24 h (benchtop) were determined at ambient temperature (30 ± 2°C) at three concentration levels (5, 100, and 800 ng/mL) in three replicates. Short-term stability was assessed at −80°C for 4 days, and long-term stability at −80°C for 44 days. Freeze-thaw stability was evaluated after three freeze-thaw cycles, which consisted of storage at −80°C for a minimum of 12 h, followed by thawing at room temperature (30 ± 2°C) for 1 h (all at three concentration levels, 5, 100, and 800 ng/mL). The samples were processed using the same procedure as described in the Preparation of Standard Solutions and QC Samples section. Samples were considered stable if assay values were within the acceptable limits of accuracy (85–115% of the nominal value) and precision (± 15% RSD).
Dilution Effect
To demonstrate the ability to dilute and analyze samples containing prostanoids at concentrations above the upper limit of quantitation (ULOQ), prostanoid-spiked DMEM samples were prepared at 4× the corresponding ULOQ and diluted with blank DMEM (containing 10% pooled blank human serum) by factors of 10, 20, and 40 in three replicates. The diluted samples were then processed according to the Preparation of Standard Solutions and QC Samples section and analyzed. These replicates had to comply with a precision (RSD) of less than 15% and an accuracy of 100 ± 15%.
Results and Discussion
Analytical Method Development and Optimization
Since all the prostanoids used in this study are carboxylic acids (Figure 1), abundant [M-H]− ions were formed during negative ESI and no chemical derivatization was required to enhance ionization or improve stability. During MS/MS with CID, the collision energy was optimized for each analyte to generate the most abundant fragment ions of the deprotonated molecule precursors. The precursor ion/product ion pairs of each analyte that were used for SRM and the optimized collision energies and related parameters are shown in Table 1. The SRM dwell times were selected to ensure that at least 15 data points were acquired across each chromatographic peak for reproducible peak integration. The UHPLC column, mobile phase, and column temperature were optimized for separation of all six prostanoids within 0.5 min. For example, UHPLC/MS/MS SRM chromatograms showing all six analytes and both internal/surrogate standards are shown in Figure 2.
Table 1.
Parameters for prostanoid analysis using UHPLC/MS/MS
| Prostanoid | SRM transition, m/z | UHPLC/MS/MS
|
||||
|---|---|---|---|---|---|---|
| Retention time, min | Dwell time, ms | Q1 pre-bias, V | Collision energy, eV | Q3 pre-bias, V | ||
| PGE2 | 351 > 271 | 0.356 | 15 | 20 | −20 | 14 |
| PGD2 | 351 > 271 | 0.399 | 15 | 30 | −20 | 14 |
| 8-iso-PGF2α | 353 > 193 | 0.282 | 15 | 10 | −35 | 18 |
| PGF2α | 353 > 193 | 0.327 | 15 | 21 | −35 | 14 |
| 6-keto-PGF1α | 369 > 163 | 0.232 | 15 | 11 | −30 | 12 |
| TXB2 | 369 > 169 | 0.283 | 15 | 20 | −25 | 19 |
| d4-PGE2 | 355 > 275 | 0.355 | 15 | 20 | −20 | 14 |
| d4-PGD2 | 355 > 275 | 0.398 | 15 | 20 | −20 | 14 |
Figure 2.
Negative ESI UHPLC/MS/MS SRM chromatograms of PGE2, PGD2, 8-iso-PGF2α, PGF2α, 6-keto-PGF1α, and TXB2 (1 ng/mL each) and internal standards d4-PGE2, and d4-PGD2 (20 ng/mL each) extracted from DMEM containing 10% pooled blank human serum.
Selectivity
The selectivity of the method was evaluated by comparing calibration standards, blank, and zero samples (mobile phase solvent alone). All batches of blank DMEM were found to be free of interfering peaks due to endogenous plasma substances at the retention times of all the prostanoids. This demonstrated that the UHPLC/MS/MS assay had adequate selectivity.
Calibration Curves
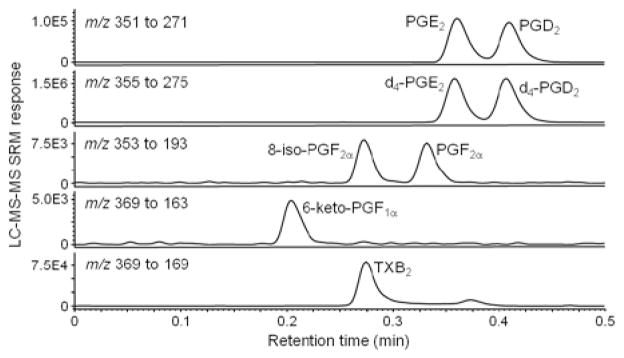
Dynamic range and linearity were determined using an isotope dilution approach with constant d4-PGE2 and d4-PGD2 initial amounts as internal/surrogate standards and variable concentrations of prostanoids in standard mixtures. Good linearity was observed over the concentration ranges 0.1 to 1000 ng/mL for PGE2, PGD2, and TXB2, and 0.5 to 1000 ng/mL for 8-iso-PGF2α, PGF2α, and 6-keto-PGF1α. The deviations of back-calculated prostanoid amounts for each analyte in these ranges of concentration were within the acceptable value of 15% of their nominal concentrations. The average R (n = 4) for each standard curve was >0.999, indicating excellent linearity for the UHPLC/MS/MS assay. The LLOQ values (defined as S/N = 5) were 0.020 ng/mL for PGE2, 0.027 ng/mL for PGD2, 0.15 ng/mL for 8-iso-PGF2α, 0.18 ng/mL for PGF2α and 6-keto-PGF1α, and 0.013 ng/mL for TXB2. Chromatograms of these compounds ≥ LLOQ are shown in Figure 3.
Figure 3.

Negative ESI UHPLC/MS/MS SRM chromatograms of (A) PGE2 and PGD2 (0.05 ng/mL), (B) 8-iso-PGF2α and PGF2α (0.5 ng/mL), (C) 6-keto-PGF1α (0.5 ng/mL), and (D) TXB2 (0.05 ng/mL) extracted from DMEM containing 10% pooled blank human serum.
Intraday and Interday Precision and Accuracy
The intraday and interday precision and accuracy of the methods were determined by analyzing QC samples (n = 5) on 4 consecutive days. The intraday and interday precision and accuracy for all prostanoids were less than 15% using UHPLC/MS/MS (Table 2). The RSD of the peak retention time of each prostanoid was found to be <0.2% for intraday runs and <0.4% for analyses carried out on 7 consecutive days using UHPLC/MS/MS (data not shown). A separate experiment also showed no carryover (data not shown).
Table 2.
Intraday and interday precision and accuracy for prostanoids determined in DMEM containing 10% pooled drug-free blank human serum using UHPLC/MS/MS
| Prostanoid | Nominal concn, ng/mL | UHPLC/MS/MS (4 days)
|
|||||
|---|---|---|---|---|---|---|---|
| Intraday (n = 5)
|
Interday (n = 20)
|
||||||
| SD | RSD, % | Accuracy, % | SD | RSD, % | Accuracy, % | ||
| PGE2 | 0.10 | 0.02 | 10.2 | 98.0 | 0.02 | 10.1 | 98.8 |
| 4.00 | 0.33 | 8.15 | 101 | 0.43 | 10.5 | 102 | |
| 400 | 17.5 | 4.24 | 103 | 22.7 | 5.56 | 102 | |
| 750 | 19.1 | 2.59 | 98.3 | 21.2 | 2.84 | 99.4 | |
| PGD2 | 0.10 | 0.03 | 14.4 | 104 | 0.03 | 14.7 | 102 |
| 4.00 | 0.29 | 7.20 | 101 | 0.33 | 8.27 | 99.7 | |
| 400 | 18.3 | 4.45 | 103 | 21.9 | 5.21 | 105 | |
| 750 | 28.3 | 3.72 | 101 | 37.1 | 4.85 | 102 | |
| 8-iso-PGF2α | 0.10 | N/Aa | N/A | N/A | N/A | N/A | N/A |
| 4.00 | 0.43 | 10.9 | 98.3 | 0.55 | 13.8 | 99.4 | |
| 400 | 25.4 | 5.99 | 106 | 26.1 | 6.21 | 105 | |
| 750 | 38.5 | 4.98 | 103 | 43.0 | 5.46 | 105 | |
| PGF2α | 0.10 | N/A | N/A | N/A | N/A | N/A | N/A |
| 4.00 | 0.39 | 10.0 | 97.2 | 0.47 | 12.0 | 97.8 | |
| 400 | 31.4 | 8.14 | 96.4 | 33.4 | 8.51 | 98.1 | |
| 750 | 28.5 | 3.76 | 101 | 36.3 | 4.65 | 104 | |
| 6-keto-PGF1α | 0.10 | N/A | N/A | N/A | N/A | N/A | N/A |
| 4.00 | 0.59 | 13.5 | 109 | 0.63 | 14.1 | 112 | |
| 400 | 41.2 | 10.6 | 97.5 | 45.9 | 11.6 | 99.3 | |
| 750 | 18.5 | 2.61 | 94.6 | 25.7 | 3.58 | 95.7 | |
| TXB2 | 0.10 | 0.02 | 10.0 | 99.9 | 0.03 | 15.0 | 100 |
| 4.00 | 0.29 | 7.42 | 97.7 | 0.33 | 8.38 | 98.5 | |
| 400 | 13.2 | 3.27 | 101 | 17.0 | 4.21 | 101 | |
| 750 | 16.6 | 2.23 | 99.3 | 19.4 | 2.59 | 99.9 | |
N/A = Not available (below LLOQ).
Recovery
The two-step liquid–liquid extraction approach provided good recovery of each prostanoid (Table 3). Recovery exceeded 93% for each prostanoid except for PGD2 (n = 3). Because of the instability of PGD2, its recovery was slightly lower at 87.9%. Good values of RSD (within 15%) indicated reproducible extraction that is essential for a reliable bioanalytical method.
Table 3.
Recovery of prostanoids from DMEM containing 10% pooled drug-free blank human serum (n = 3) using liquid–liquid extraction followed by UHPLC/MS/MS analysis
| Nominal concn, ng/mL | PGE2
|
PGD2
|
8-iso-PGF2α
|
PGF2α
|
6-keto-PGF1α
|
TXB2
|
||||||
|---|---|---|---|---|---|---|---|---|---|---|---|---|
| Recovery, % | RSD, % | Recovery, % | RSD, % | Recovery, % | RSD, % | Recovery, % | RSD, % | Recovery, % | RSD, % | Recovery, % | RSD, % | |
| 0.10 | 93.7 | 11.3 | 87.9 | 4.79 | <LLOQ | <LLOQ | <LLOQ | <LLOQ | <LLOQ | <LLOQ | 97.8 | 11.8 |
| 4.00 | 96.8 | 8.66 | 91.4 | 10.8 | 93.4 | 9.42 | 94.4 | 5.30 | 92.3 | 12.2 | 96.0 | 6.49 |
| 400 | 97.1 | 8.12 | 86.5 | 13.5 | 98.4 | 10.5 | 94.5 | 14.6 | 92.1 | 10.0 | 94.8 | 13.2 |
| 750 | 95.2 | 13.3 | 89.8 | 8.45 | 99.6 | 12.2 | 98.2 | 9.89 | 93.5 | 5.88 | 96.3 | 7.95 |
Matrix Effects
As shown in Table significant differences were 4, no observed in UHPLC/MS/MS measurements of each prostanoid extracted from DMEM containing pooled blank human serum from six different lots and in the mobile phase alone. Therefore, the DMEM or pooled blank human serum matrix did not produce any discernible matrix effects such as prostanoid signal suppression or enhancement.
Stability Study
Stability studies were carried out in DMEM containing pooled blank human serum at three prostanoid concentrations (Table 5), and the stabilities of extracted prostanoids were determined separately (Table 6). Comparing the mean values after incubation with the initial values, each prostanoid was determined to be stable after extraction with storage at 4°C in the autosampler for up to 48 h (Table 6), in DMEM for three freeze-thaw cycles, or up to 4 days at −80°C (Table 5). The presence or absence of light had little effect on prostanoid stability (Table 5). TXB2 was stable under all conditions tested (Tables 5 and 6). Because most prostanoids showed evidence of degradation when stored at room temperature for more than 2 h, these studies indicated that prostanoids should be processed at temperatures as cold as possible (preferably below room temperature) and analyzed within 2 h.
Table 5.
Stabilities of prostanoids in DMEM containing 10% pooled blank human serum determined using UHPLC/MS/MS
| Nominal concn, ng/mL | Stability, n = 3 | Time point, h | PGE2 | PGD2 | 8-iso-PGF2α | PGF2α | 6-keto-PGF1α | TXB2 | ||||||
|---|---|---|---|---|---|---|---|---|---|---|---|---|---|---|
|
| ||||||||||||||
| RSD, % | Accuracy, % | RSD, % | Accuracy, % | RSD, % | Accuracy, % | RSD, % | Accuracy, % | RSD, % | Accuracy, % | RSD, % | Accuracy, % | |||
| 5.00 | Three freeze-thaw cycles | 8.13 | 102 | 6.82 | 85.6 | 11.7 | 97.2 | 9.42 | 104 | 12.1 | 107 | 8.14 | 101 | |
| 4 days at 80°C | 8.85 | 103 | 7.11 | 103 | 8.57 | 102 | 8.93 | 99.5 | 13.8 | 98.0 | 7.50 | 102 | ||
| 44 days at 80°C | 7.14 | 100 | 6.93 | 74.5 | 10.25 | 96.3 | 9.01 | 103 | 11.4 | 97.7 | 6.98 | 99.2 | ||
| Room temp, 30 ± 2°C, dark | 2 | 5.89 | 95.9 | 10.3 | 67.3 | 11.0 | 106 | 8.30 | 97.5 | 10.3 | 102 | 5.27 | 105 | |
| 6 | 9.95 | 84.3 | 6.05 | 30.5 | 10.3 | 89.7 | 9.21 | 78.1 | 13.3 | 86.1 | 7.45 | 99.8 | ||
| 24 | 8.31 | 58.0 | 9.79 | 1.45 | 8.74 | 83.6 | 11.7 | 73.4 | 9.51 | 72.9 | 5.03 | 97.5 | ||
| Room temp, 30 ± 2°C, light | 2 | 7.42 | 97.1 | 7.94 | 65.5 | 9.92 | 99.4 | 9.55 | 94.8 | 10.1 | 98.6 | 6.67 | 104 | |
| 6 | 7.73 | 86.7 | 8.87 | 28.9 | 7.25 | 87.5 | 10.8 | 77.4 | 8.99 | 84.7 | 6.94 | 103 | ||
| 24 | 8.15 | 60.4 | 10.2 | 1.78 | 8.54 | 85.0 | 7.92 | 75.5 | 12.2 | 75.4 | 8.25 | 98.9 | ||
| 100 | Three freeze-thaw cycles | 4.67 | 100 | 3.89 | 88.3 | 3.97 | 98.4 | 5.24 | 99.0 | 6.03 | 97.7 | 3.64 | 101 | |
| 4 days at 80°C | 3.28 | 99.8 | 5.36 | 99.6 | 2.59 | 101 | 4.37 | 100 | 3.32 | 103 | 4.13 | 97.0 | ||
| 44 days at 80°C | 4.09 | 104 | 4.32 | 72.6 | 3.88 | 105 | 4.09 | 95.7 | 5.62 | 97.4 | 2.56 | 102 | ||
| Room temp, 30 ± 2°C, dark | 2 | 2.88 | 92.5 | 3.78 | 62.6 | 2.90 | 97.5 | 2.80 | 103 | 2.32 | 101 | 1.97 | 98.6 | |
| 6 | 4.13 | 88.7 | 6.57 | 27.4 | 3.35 | 92.4 | 3.58 | 73.5 | 5.28 | 83.7 | 4.84 | 106 | ||
| 24 | 3.97 | 63.2 | 9.29 | 1.38 | 2.41 | 86.7 | 3.14 | 76.5 | 3.71 | 77.4 | 2.96 | 102 | ||
| Room temp, 30 ± 2°C, light | 2 | 4.02 | 95.8 | 5.60 | 64.0 | 3.05 | 101 | 4.04 | 98.4 | 4.52 | 103 | 3.26 | 100 | |
| 6 | 3.66 | 86.0 | 7.88 | 25.5 | 2.99 | 89.0 | 5.27 | 77.9 | 6.09 | 88.6 | 2.83 | 99.4 | ||
| 24 | 4.57 | 61.1 | 10.1 | 1.79 | 3.74 | 85.1 | 2.77 | 74.2 | 3.38 | 73.0 | 4.01 | 96.6 | ||
| 800 | Three freeze-thaw cycles | 1.30 | 98.0 | 2.80 | 86.2 | 1.26 | 102 | 1.77 | 97.3 | 2.44 | 99.5 | 1.67 | 98.8 | |
| 4 days at 80°C | 1.98 | 98.2 | 3.54 | 96.1 | 1.38 | 99.1 | 2.28 | 105 | 1.39 | 98.1 | 1.92 | 103 | ||
| 44 days at 80°C | 1.73 | 101 | 1.59 | 78.2 | 2.37 | 102 | 2.00 | 97.5 | 1.77 | 101 | 1.20 | 98.4 | ||
| Room temp, 30 ± 2°C, dark | 2 | 1.87 | 99.1 | 3.79 | 71.4 | 1.42 | 104 | 2.39 | 97.1 | 3.53 | 99.6 | 2.61 | 107 | |
| 6 | 2.05 | 84.8 | 7.44 | 29.8 | 1.17 | 92.5 | 1.68 | 79.7 | 2.64 | 85.6 | 1.36 | 97.9 | ||
| 24 | 3.74 | 67.7 | 8.45 | 1.20 | 2.33 | 88.3 | 2.54 | 77.3 | 1.74 | 71.9 | 1.50 | 102 | ||
| Room temp, 30 ± 2°C, light | 2 | 2.46 | 96.7 | 4.32 | 65.0 | 2.54 | 101 | 1.97 | 100 | 3.37 | 104 | 3.00 | 105 | |
| 6 | 2.38 | 88.9 | 9.57 | 33.3 | 1.63 | 89.7 | 1.89 | 78.9 | 3.94 | 85.1 | 1.66 | 100 | ||
| 24 | 4.42 | 62.1 | 7.91 | 1.13 | 1.90 | 86.4 | 4.36 | 75.0 | 3.12 | 76.3 | 1.43 | 101 | ||
Table 6.
Stabilities of prostanoids extracted from DMEM containing 10% pooled blank human serum (n = 3) determined using UHPLC/MS/MS
| Nominal concn, ng/mL | Stability, n = 3 | PGE2 | PGD2 | 8-iso PGF2α | PGF2α | 6-keto PGF1α | TXB2 | ||||||
|---|---|---|---|---|---|---|---|---|---|---|---|---|---|
|
| |||||||||||||
| RSD, % | Accuracy, % | RSD, % | Accuracy, % | RSD, % | Accuracy, % | RSD, % | Accuracy, % | RSD, % | Accuracy, % | RSD, % | Accuracy, % | ||
| 0.10 | 24 h, 4°C autosampler | 9.17 | 109 | 10.0 | 110 | <LLOQ | <LLOQ | <LLOQ | <LLOQ | <LLOQ | <LLOQ | 8.32 | 104 |
| 48 h, 4°C autosampler | 7.77 | 103 | 12.2 | 107 | N/A | <LLOQ | <LLOQ | <LLOQ | <LLOQ | <LLOQ | 9.56 | 108 | |
| 4.00 | 24 h, 4°C autosampler | 7.30 | 98.5 | 5.16 | 102 | 9.03 | 97.2 | 11.4 | 99.2 | 12.5 | 102 | 3.78 | 98.7 |
| 48 h, 4°C autosampler | 6.11 | 102 | 3.64 | 103 | 10.2 | 102 | 10.6 | 101 | 9.85 | 107 | 6.24 | 99.6 | |
| 400 | 24 h, 4°C autosampler | 4.19 | 99.6 | 3.43 | 101 | 4.88 | 105 | 3.36 | 99.1 | 3.77 | 96.2 | 1.05 | 109 |
| 48 h, 4°C autosampler | 5.70 | 101 | 1.90 | 103 | 6.72 | 102 | 2.92 | 98.3 | 4.02 | 97.5 | 1.31 | 103 | |
| 750 | 24 h, 4°C autosampler | 1.76 | 98.0 | 1.78 | 101 | 2.87 | 97.6 | 2.09 | 99.7 | 1.89 | 99.8 | 2.44 | 102 |
| 48 h, 4°C autosampler | 3.53 | 99.5 | 3.40 | 101 | 2.35 | 103 | 1.54 | 102 | 3.13 | 97.1 | 1.87 | 98.7 | |
Unlike the other prostanoids, PGD2 was unstable during long-term storage (44 days) at −80°C (Table 5). PGD2 was also unstable during storage at room temperature in light or dark for only 2 h, which is consistent with our previous studies (21). Because PGD2 was so unstable, it was important to use d4-PGD2 as a surrogate standard to correct for its decomposition during sample processing and analysis. A separate internal standard, d4-PGE2, was used for the other five more stable prostanoids.
Dilution Effect
The results of the sample dilution study for prostanoid concentrations of 4000 ng/mL, expressed as precision and accuracy are shown in Table 7. These data indicate that diluting samples with initial concentrations above the ULOQ of the standard curve has little effect on the outcome of the measurement.
Table 7.
Dilution study for prostanoids of high concentration exceeding the ULOQ of the UHPLC/MS/MS standard curve
| Nominal concn, ng/mL | Dilution factor, fold | PGE2 | PGD2 | 8-iso-PGF2α | PGF2α | 6-keto-PGF1α | TXB2 | ||||||
|---|---|---|---|---|---|---|---|---|---|---|---|---|---|
|
| |||||||||||||
| RSD, % | Accuracy, % | RSD, % | Accuracy, % | RSD, % | Accuracy, % | RSD, % | Accuracy, % | RSD, % | Accuracy, % | RSD, % | Accuracy, % | ||
| 4000 | 10 | 1.60 | 96.4 | 1.97 | 105 | 2.76 | 108 | 1.59 | 110 | 2.82 | 96.2 | 1.45 | 98.2 |
| 20 | 3.27 | 96.6 | 2.54 | 99.1 | 3.50 | 104 | 1.94 | 99.4 | 3.49 | 98.7 | 4.77 | 104 | |
| 40 | 4.01 | 101 | 2.29 | 102 | 3.32 | 107 | 4.78 | 103 | 3.53 | 102 | 2.86 | 99.5 | |
Application to the Analysis of Biological Samples
The validated UHPLC/MS/MS method was applied to the analysis of seven biological samples obtained from cell culture experiments using BMDM. Samples were stored for less than 2 weeks at −80°C until analysis. Three aliquots (500 μL) of each sample were extracted and analyzed by UHPLC/MS/MS; the results are shown in Table 8. Representative chromatograms of the BMDM sample analysis are shown in Figure 4. Although 8-iso-PGF2α, PGF2α, and 6-keto-PGF1α were not detected in these BMDM samples and therefore do not appear to be produced by BMDM, PGE2, PGD2, and TXB2 were detected and measured.
Table 8.
Quantitation of prostanoids in BMDM cultures using UHPLC/MS/MS (n = 3)a
| No. | PGE2, ng/mL | PGD2, ng/mL | TXB2, ng/mL | |||
|---|---|---|---|---|---|---|
|
| ||||||
| Mean ± SD | RSD, % | Mean ± SD | RSD, % | Mean ± SD | RSD, % | |
| 1 | 37.4 ± 1.8 | 4.69 | 61.8 ± 3.1 | 5.08 | 23.5 ± 1.7 | 7.07 |
| 2 | 159.9 ± 5.1 | 3.22 | 175.8 ± 6.1 | 3.45 | 68.8 ± 3.1 | 4.50 |
| 3 | 9.3 ± 0.3 | 3.57 | <LLOQ | <LLOQ | 8.2 ± 0.6 | 6.71 |
| 4 | 26.9 ± 1.0 | 3.72 | <LLOQ | <LLOQ | 16.8 ± 1.4 | 8.05 |
| 5 | 423.0 ± 19.1 | 4.52 | 133.8 ± 2.4 | 1.79 | 150.2 ± 4.2 | 2.80 |
| 6 | 260.5 ± 17.4 | 6.67 | 38.7 ± 2.0 | 5.25 | 134.8 ± 5.1 | 3.79 |
| 7 | 144.2 ± 3.1 | 2.16 | 155.2 ± 6.5 | 4.18 | 67.4 ± 4.5 | 6.67 |
No 8-iso-PGF2α, PGF2α, or 6-keto-PGF1α was detected.
Figure 4.
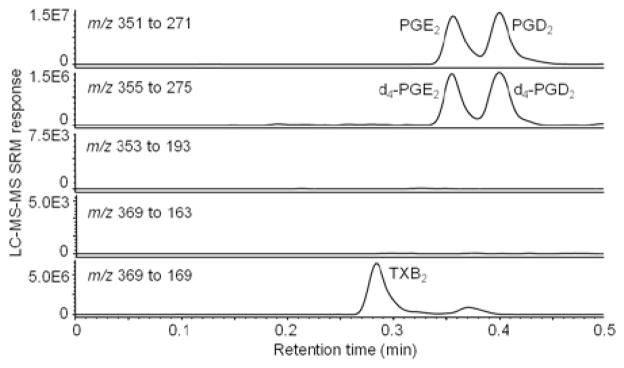
Negative ESI UHPLC/MS/MS SRM chromatograms of PGE2, PGD2, 8-iso-PGF2α, PGF2α, 6-keto-PGF1α, and TXB2, d4-PGE2, and d4-PGD2 extracted from BMDM cell culture. Note that 8-iso-PGF2α, PGF2α, or 6-keto-PGF1α was not detected in these cells (see chromatograms for the SRM transitions of m/z 353 to m/z 193 and m/z 369 to m/z 163, respectively).
Conclusions
A UHPLC/MS/MS method was developed and validated for the simultaneous quantitative analysis of six prostanoids in cell culture media. This UHPLC/MS/MS method is approximately 26-fold faster than our previous HPLC/MS/MS method (21) and shows equivalent or superior accuracy, precision, and LLOQ values. Compared to other recent studies that include UHPLC/MS/MS (26–28), our UHPLC/MS/MS method is at least 11-fold faster, with comparable or better LLOQ values. Because UHPLC peaks (<3 s) in this analysis were eight-fold narrower than the corresponding HPLC peaks (approximately 24 s; 21), a new generation of high-speed triple quadrupole mass spectrometer was used that can switch between SRM transitions of multiple analytes much faster than previous systems and obtain sufficient numbers of data points across each peak. Finally, although PGD2 was found to be relatively unstable during stability studies, the use of d4-PGD2 as a surrogate standard controlled specifically for PGD2 degradation during sample handling, while d4-PGE2 served as a suitable internal standard for the other five prostanoids.
Table 4.
Matrix effects on UHPLC/MS/MS quantitative analysis of prostanoids extracted from DMEM containing 10% pooled blank human serum from six different lots
| Prostanoid | UHPLC/MS/MS, mean matrix effects, % ± SD, n = 18a
|
||||
|---|---|---|---|---|---|
| Nominal prostanoid concn, ng/mL
|
Nominal IS conc, ng/mLb
|
||||
| 0.10 | 4.00 | 400 | 750 | 20.0 | |
| PGE2 | 97.4 ± 8.2c | 96.8 ± 6.3 | 96.1 ± 3.9 | 94.8 ± 4.3 | 96.0 ± 4.7 |
| PGD2 | 97.9 ± 8.4 | 98.1 ± 7.4 | 96.8 ± 6.7 | 96.6 ± 5.6 | 96.6 ± 2.6 |
| 8-iso-PGF2α | <LLOQ | 93.9 ± 9.3 | 94.4 ± 4.0 | 94.1 ± 3.6 | 95.1 ± 4.2 |
| PGF2α | <LLOQ | 97.1 ± 5.4 | 96.2 ± 5.8 | 96.4 ± 3.3 | 96.5 ± 3.9 |
| 6-keto-PGF1α | <LLOQ | 95.5 ± 4.4 | 95.9 ± 4.2 | 94.7 ± 4.7 | 94.2 ± 6.7 |
| TXB2 | 98.2 ± 7.5 | 96.0 ± 4.7 | 96.1 ± 4.3 | 95.3 ± 3.8 | 97.4 ± 5.8 |
Each sample was analyzed three times for six different lots, n = (3 × 6) = 18.
IS = Internal standard.
The ratio of corresponding peak areas of prostanoids and internal standards extracted from DMEM containing 10% pooled blank human serum from six different lots (A) was compared with that of equivalent concentrations of prostanoids and internal standards working standard solutions in mobile phase (methanol–water, 50 + 50, v/v; B); matrix effect, % = (A/B × 100).
Acknowledgments
This research was supported by National Institutes of Health (NIH) grant P50 AT000155 from the Office of Dietary Supplements and the National Center for Complementary and Alternative Medicine (RvB), NIH R01 HL075557 HL068610 (JWC) and T32HL082547 (JWC), the Department of Veterans Affairs Merit Review Grant 5I01BX000108 (JWC), NIH grants 5R01 HL083218 (LX) and 3R01 HL083218-01A2S1 (LX), and a UIC Faculty Scholarship Support Program grant (LX). We thank Shunyan Mo for helpful discussions and assistance.
Contributor Information
Rui Yu, University of Illinois at Chicago, Department of Medicinal Chemistry and Pharmacognosy, Chicago, IL 60612-7231.
Guiqing Zhao, University of Illinois at Chicago, Department of Medicine, Section of Pulmonary, Critical Care, Sleep and Allergy, Chicago, IL 60612-7323.
John W. Christman, University of Illinois at Chicago, Department of Medicine, Section of Pulmonary, Critical Care, Sleep and Allergy, Chicago, IL 60612-7323 The Jesse Brown Veterans Affairs Medical Center, Chicago, Illinois 60612-3728
Lei Xiao, University of Illinois at Chicago, Department of Medicine, Section of Pulmonary, Critical Care, Sleep and Allergy, Chicago, IL 60612-7323.
Richard B. van Breemen, University of Illinois at Chicago, Department of Medicinal Chemistry and Pharmacognosy, Chicago, IL 60612-7231.
References
- 1.Nicolaou A. In: Bioactive Lipids. Nicolaou A, Kokotos G, editors. Oily Press; Bridgwater, UK: 2004. pp. 197–222. [Google Scholar]
- 2.Yu R, Xiao L, Zhao G, Christman JW, van Breemen RB. J Pharmacol Exp Ther. 2011;339:716–725. doi: 10.1124/jpet.111.185405. http://dx.doi.org/10.1124/jpet.111.185405. [DOI] [PMC free article] [PubMed] [Google Scholar]
- 3.Smyth EM, Grosser T, Wang M, Yu Y, FitzGerald GA. J Lipid Res. 2009:S423–S428. doi: 10.1194/jlr.R800094-JLR200. [DOI] [PMC free article] [PubMed] [Google Scholar]
- 4.McAdam BF, Catella-Lawson F, Mardini IA, Kapoor S, Lawson JA, FitzGerald GA. Proc Natl Acad Sci USA. 1999;96:272–277. doi: 10.1073/pnas.96.1.272. http://dx.doi.org/10.1073/pnas.96.1.272. [DOI] [PMC free article] [PubMed] [Google Scholar]
- 5.Bhagwat SS, Hamann PR, Still WC, Bunting S, Fitzpatrick FA. Nature. 1985;315:511–513. doi: 10.1038/315511a0. http://dx.doi.org/10.1038/315511a0. [DOI] [PubMed] [Google Scholar]
- 6.Dahl JH, van Breemen RB. Anal Biochem. 2010;404:211–216. doi: 10.1016/j.ab.2010.05.023. http://dx.doi.org/10.1016/j.ab.2010.05.023. [DOI] [PMC free article] [PubMed] [Google Scholar]
- 7.Zeilhofer HU. Biochem. 2007;73:165–174. doi: 10.1016/j.bcp.2006.07.037. [DOI] [PubMed] [Google Scholar]
- 8.McAdam BF, Mardini IA, Habib A, Burke A, Lawson JA, Kapoor S, FitzGerald GA. J Clin Invest. 2000;105:1473–1482. doi: 10.1172/JCI9523. http://dx.doi.org/10.1172/JCI9523. [DOI] [PMC free article] [PubMed] [Google Scholar]
- 9.Pettipher R, Hansel TT, Armer R. Nat Rev Drug Discov. 2007;6:313–325. doi: 10.1038/nrd2266. http://dx.doi.org/10.1038/nrd2266. [DOI] [PubMed] [Google Scholar]
- 10.FitzGerald GA. Am J Cardiol. 1991;68:11B–15B. doi: 10.1016/0002-9149(91)90379-y. http://dx.doi.org/10.1016/0002-9149(91)90379-Y. [DOI] [PubMed] [Google Scholar]
- 11.Vane JR. Br Heart J. 1983;49:405–409. doi: 10.1136/hrt.49.5.405. http://dx.doi.org/10.1136/hrt.49.5.405. [DOI] [PMC free article] [PubMed] [Google Scholar]
- 12.Wang MT, Honn KV, Nie D. Cancer Metastasis Rev. 2007;26:525–534. doi: 10.1007/s10555-007-9096-5. http://dx.doi.org/10.1007/s10555-007-9096-5. [DOI] [PubMed] [Google Scholar]
- 13.Hébert RL, Carmosino M, Saito O, Yang G, Jackson CA, Qi Z, Breyer RM, Natarajan C, Hata AN, Zhang Y, Guan Y, Breyer MD. J Biol Chem. 2005;280:35028–35037. doi: 10.1074/jbc.M505852200. http://dx.doi.org/10.1074/jbc.M505852200. [DOI] [PubMed] [Google Scholar]
- 14.Weems CW, Weems YS, Randel RD. Vet J. 2006;171:206–228. doi: 10.1016/j.tvjl.2004.11.014. http://dx.doi.org/10.1016/j.tvjl.2004.11.014. [DOI] [PubMed] [Google Scholar]
- 15.McGeer PL, McGeer EG. J Leukoc Biol. 1999;65:409–415. doi: 10.1002/jlb.65.4.409. [DOI] [PubMed] [Google Scholar]
- 16.Pradelles P, Grassi J, Maclouf J. Methods Enzymol. 1990;187:24–34. doi: 10.1016/0076-6879(90)87005-n. http://dx.doi.org/10.1016/0076-6879(90)87005-N. [DOI] [PubMed] [Google Scholar]
- 17.Hofer G, Bieglmayer C, Kopp B, Janisch H. Prostaglandins. 1993;45:413–426. doi: 10.1016/0090-6980(93)90118-q. http://dx.doi.org/10.1016/0090-6980(93)90118-Q. [DOI] [PubMed] [Google Scholar]
- 18.Yue H, Strauss KI, Borenstein MR, Barbe MF, Rossi LJ, Jansen SA. J Chromatogr B. 2004;803:267–277. doi: 10.1016/j.jchromb.2003.12.027. http://dx.doi.org/10.1016/j.jchromb.2003.12.027. [DOI] [PubMed] [Google Scholar]
- 19.Tsukamoto H, Hishinuma T, Mikkaichi T, Nakamura H, Yamazaki T, Tomioka Y, Mizugaki M. J Chromatogr B. 2002;774:205–214. doi: 10.1016/s1570-0232(02)00220-9. http://dx.doi.org/10.1016/S1570-0232(02)00220-9. [DOI] [PubMed] [Google Scholar]
- 20.Capdevila JH, Wei S, Yan J, Karara A, Jacobson HR, Falck JR, Guengerich FP, Dubois RN. J Biol Chem. 1992;267:21720–21726. [PubMed] [Google Scholar]
- 21.Cao H, Xiao L, Park GY, Wang X, Azim A, Christman JW, van Breemen RB. Anal Biochem. 2008;372:41–51. doi: 10.1016/j.ab.2007.08.041. http://dx.doi.org/10.1016/j.ab.2007.08.041. [DOI] [PMC free article] [PubMed] [Google Scholar]
- 22.Hishinuma T, Suzuki K, Saito M, Yamaguchi H, Suzuki N, Tomioka Y, Kaneko I, Ono M, Goto J. Prostag Leukotr Ess. 2007;76:321–329. doi: 10.1016/j.plefa.2007.04.005. http://dx.doi.org/10.1016/j.plefa.2007.04.005. [DOI] [PubMed] [Google Scholar]
- 23.Masoodi M, Nicolaou A. Rapid Commun Mass Spectrom. 2006;20:3023–3029. doi: 10.1002/rcm.2697. http://dx.doi.org/10.1002/rcm.2697. [DOI] [PMC free article] [PubMed] [Google Scholar]
- 24.Ultra Performance Liquid Chromatography (UPLC) [accessed December 5, 2012];New Boundaries for the Chromatography Laboratory White Paper, Waters. http://waters.com/webassets/cms/library/docs/720000819en.pdf.
- 25.Guillarme D, Nguyen DTT, Rudaz S, Veuthey JL. J Chromatogr A. 2007;1149:20–29. doi: 10.1016/j.chroma.2006.11.014. http://dx.doi.org/10.1016/j.chroma.2006.11.014. [DOI] [PubMed] [Google Scholar]
- 26.Mal M, Koh PK, Cheah PY, Chan ECY. Rapid Commun Mass Spectrom. 2011;25:755–764. doi: 10.1002/rcm.4926. http://dx.doi.org/10.1002/rcm.4926. [DOI] [PubMed] [Google Scholar]
- 27.Sterz K, Scherer G, Ecker J. J Lipid Res. 2012;53:1026–1036. doi: 10.1194/jlr.D023739. http://dx.doi.org/10.1194/jlr.D023739. [DOI] [PMC free article] [PubMed] [Google Scholar]
- 28.Medina S, Domínguez-Perles R, Gil JI, Ferreres F, García-Viguera C, Martínez-Sanz JM, Gil-Izquierdo A. Rapid Commun Mass Spectrom. 2012;26:1249–1257. doi: 10.1002/rcm.6224. http://dx.doi.org/10.1002/rcm.6224. [DOI] [PubMed] [Google Scholar]
- 29.Guidance for Industry: Bioanalytical Method Validation. U.S. Department of Health and Human Services, Food and Drug Administration, Center for Drug Evaluation and Research; 2001. [accessed December 5, 2012]. http://www.fda.gov/downloads/Drugs/GuidanceComplianceRegulatoryInformation/Guidances/UCM070107.pdf. [Google Scholar]