Abstract
The present study was to evaluate the accuracy of bedside index for severity in acute pancreatitis (BISAP) in predicting the severity and prognoses of acute pancreatitis (AP) in Chinese patients. Clinical data for 497 patients with AP were analyzed retrospectively to compare BISAP with acute physiology and chronic health evaluation II, Ranson, and computed tomography severity index scores in predicting the severity of AP and the occurrence of pancreatic necrosis, mortality, and organ failure in patients with severe AP (SAP) using the area under the receiver-operating characteristic curve. Of the 497 patients, 396 had mild AP and 101 had SAP. There were significant correlations between the scores of any two systems. BISAP performed similarly to other scoring systems in predicting SAP, as well as pancreatic necrosis, mortality, and organ failure in SAP patients, in terms of the area under the receiver-operating characteristic curve. BISAP score is valuable in predicting the severity of AP and prognoses of SAP in Chinese patients.
Keywords: Acute pancreatitis, Scoring system, BISAP, Severity, Prognosis
Acute pancreatitis (AP) is a sudden inflammation of the pancreas characterized by activation of pancreatic enzymes to cause self-digestion of the pancreas. In most cases, AP is mild, self-limiting, and requires no special treatment; however, 20% to 30% of patients develop a severe disease that can progress to systemic inflammation and cause pancreatic necrosis, multiorgan failure, and potentially death.1 Early, quick, and accurate risk stratification of AP patients would permit evidence-based early initiation of intensive care therapy for patients with severe AP (SAP) to prevent adverse outcomes and allow treatment of mild AP (MAP) on the common ward. Therefore, a reliable risk stratification tool to predict the severity and prognoses of AP is of great clinical importance for the management of this disease.
An ideal scoring system should promise an early, quick, simple, accurate, and reproducible description of disease severity. Currently, a variety of scoring systems are available to evaluate the severity of AP, including Ranson criteria,2 acute physiology and chronic health evaluation (APACHE) II,3 and computed tomography severity index (CTSI).4 However, all scoring systems have their own distinct pros and cons. For example, the main limitation of the Ranson criteria is that the evaluation cannot be completed until 48 hours following admission, which may lead to missing an early therapeutic window and increased mortality.5 APACHE II has the advantage of allowing determination of disease severity on the day of admission, but complexity is its major drawback.6,7 CTSI is calculated based on CT findings of some local complications and cannot reflect the systemic inflammatory response.8,9
In 2008, Wu et al10 retrospectively developed a new scoring system, the bedside index for severity in acute pancreatitis (BISAP), to estimate the risk of in-hospital mortality in patients with AP. The BISAP incorporates 5 variables: blood urea nitrogen level >25 mg/dL, impaired mental status, development of systemic inflammatory response syndrome, age >60 years, and presence of pleural effusion. During the past 3 years, several studies have been conducted in Western countries to validate whether BISAP is a reliable, simple, and accurate means of stratifying patients with AP; however, no studies have been performed in China to validate whether this scoring system is applicable to Chinese patients. The present study was designed to retrospectively evaluate BISAP scores in predicting severity and prognoses of AP in Chinese patients by comparing them with several traditional scoring systems.
Patients and Methods
Patient population and data collection
The study protocol was approved by the Ethics Committee of Wuxi People's Hospital Affiliated to Nanjing Medical University (Wuxi, China). Informed consent was obtained from each patient prior to study enrollment. Clinical data for pancreatitis patients who were hospitalized at our hospital from 2005 to 2010 were retrospectively collected. Patients with incomplete clinical data, those who presented symptoms for more than 3 days at admission, and patients with chronic pancreatitis were excluded. Depending on disease status, all patients underwent fasting, gastrointestinal decompression, acid suppression, suppression of pancreatic enzyme secretion, improvement of microcirculation, anti-infection treatment, fluid infusion, enteral nutrition, or complication treatment.
Diagnostic criteria for AP
AP was defined based on the presence of the following features1: characteristic abdominal pain (occasionally absent); serum amylase level three times the upper limit of normal; the presence or absence of characteristic imaging findings of AP; and exclusion of other diseases.
AP classification
AP was classified as mild or severe according to the 1992 Atlanta classification11 based on the presence or absence of either organ failure or local complications or both. Organ failure was defined as shock (systolic blood pressure ≤90 mmHg), pulmonary insufficiency (arterial PO2 <60 mmHg), renal failure (serum creatinine >177 μmol/L after rehydration), or gastrointestinal bleeding (>500 mL per 24 hours).11 Local complications included pancreatic necrosis, abscess, and pseudocyst.
Score calculation and data analyses
BISAP and APACHE II scores were calculated using data from the first 24 hours following admission, and the Ranson score was calculated using data from the first 48 hours following admission. CTSI was calculated in patients who underwent contrast-enhanced CT within 3 days following symptom presentation. The ability of the BISAP, APACHE II, and Ranson scores to predict the severity of AP as well as pancreatic necrosis, organ failure, and mortality in SAP patients, and the ability of the BISAP and CTSI scores to predict organ failure and mortality were compared.
Statistical analysis
Statistical analyses were performed using SPSS 17.0 (SPSS Inc, Chicago, Illinois). Numeric data are presented as mean ± SD. Variables that follow a normal distribution were compared using a t test, whereas those not following a normal distribution were compared using the rank sum test. Correlations between scores of difference systems were evaluated using Spearman correlation coefficient. The ability of each scoring system to predict AP severity and SAP complications was measured and compared by the area under the receiver-operating curve (AUC) through generating receiver-operating characteristic curves using MedCalc software (SolidWorks, Concord, MA). Sensitivity, specificity, positive predictive value (PPV), and negative predictive value (NPV) for individual scoring systems were calculated based on Youden index.
Results
Patient characteristics
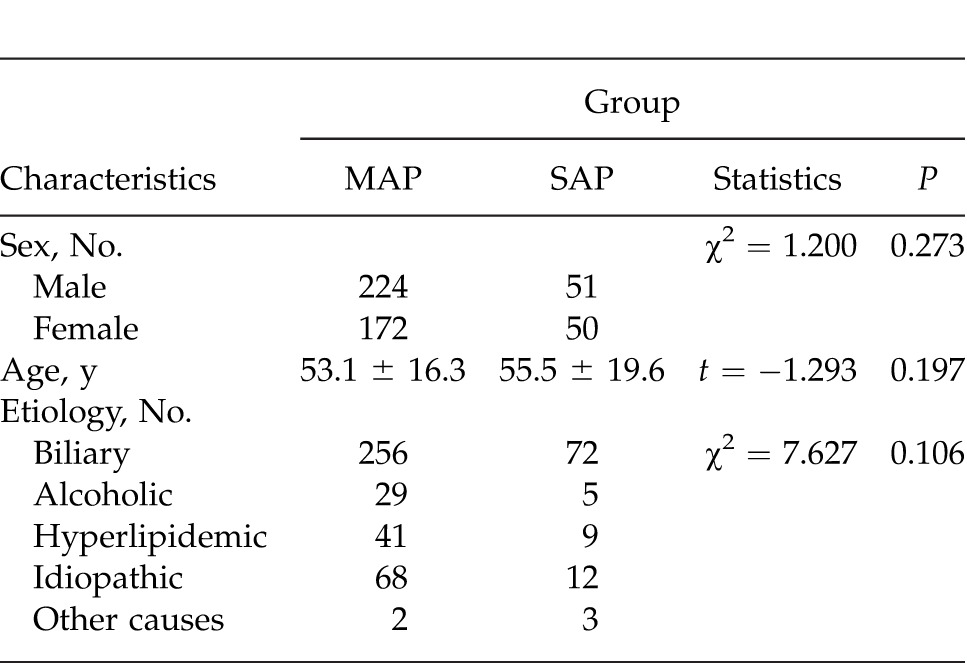
A total of 497 Chinese patients with AP, including 275 men (55.3%) and 222 women (44.7%), were retrospectively enrolled. Median age was 53.6 ± 16.6 years. Table 1 shows the characteristics of patients included in this study. Of all patients, 101 (20.3%) had SAP and 396 (79.6%) had MAP; 328 (66.0%) had biliary pancreatitis, 34 (6.8%) had alcoholic pancreatitis, 50 (10.1%) had hyperlipidemic pancreatitis, 80 (16.1%) had idiopathic pancreatitis, and 5 (1.0%) had pancreatitis of other causes. Of patients with SAP, 29 (28.7%) developed organ failure, 26 (25.7%) developed pancreatic necrosis, and 13 (12.8%) died; 81 (80.2%) underwent contrast-enhanced CT. Of the patients with organ failure, 13 (44.8%) had pulmonary insufficiency, 7 (24.1%) had renal failure, 1 (3.5%) had shock only, 4 (13.8%) developed both pulmonary insufficiency and renal failure, and 4 (13.8%) developed renal failure with shock. There were no significant differences in sex distribution, age, and etiology distribution between the 2 groups of patients (P > 0.05 for all).
Table 1 .
Characteristics of patients included in the present study

Correlations among BISAP, APACHE II, and Ranson scores in Chinese AP patients
As shown in Table 2, BISAP, APACHE II, and Ranson scores were significantly higher in the SAP group than in the MAP group (P = 0.000 for all). Spearman correlation coefficient was 0.612 between BISAP and APACHE II scores, 0.568 between BISAP and Ranson scores, and 0.577 between APACHE II and Ranson scores (P = 0.000 for all), suggesting significant correlations among the 3 scoring systems.
Table 2 .
Comparison of BISAP, APACHE II, and Ranson scores between patients with MAP and those with SAP

Comparison of BISAP with APACHE II and Ranson scoring systems in predicting SAP in Chinese patients
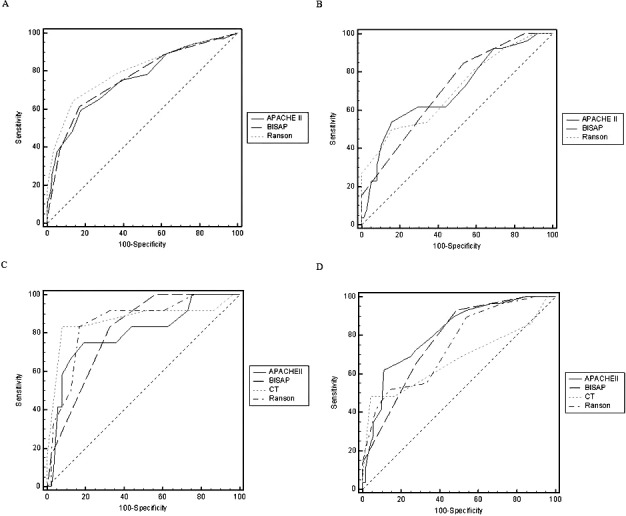
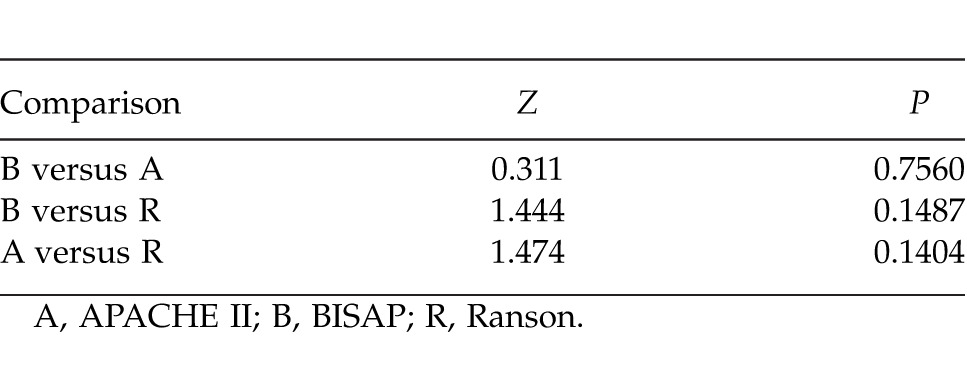
Receiver-operating characteristic (ROC) curves yielded an AUC of 0.762 (95% CI, 0.722–0.799) for BISAP, 0.755 (95% CI, 0.714–0.792) for APACHE II, and 0.801 (95% CI, 0.763–0.835) for Ranson in predicting SAP (Fig. 1A), with no significant differences among the 3 groups (P > 0.05 for all; Table 3). The best cutoff values calculated using Youden index for BISAP, APACHE II, and Ranson scores were 2, 8, and 3, respectively. Using these cutoff values, the sensitivity, specificity, PPV, and NPV of various scoring systems in predicting SAP were calculated and are shown in Table 4.
Fig. 1 .

Receiver-operator characteristic curves. Shown are comparison of BISAP, APACHE II, and Ranson scores in predicting SAP (A) and pancreatic necrosis (B), and comparison of BISAP, APACHE II, Ranson, and CTSI scores in predicting mortality (C) and organ failure (D).
Table 3 .
Comparisons of AUCs of various scoring systems in predicting SAP

Table 4 .
Sensitivity, specificity, PPV, and NPV of different scoring systems in predicting SAP

Comparison of BISAP with the other scoring systems in predicting the prognoses of Chinese SAP patients
Pancreatic necrosis
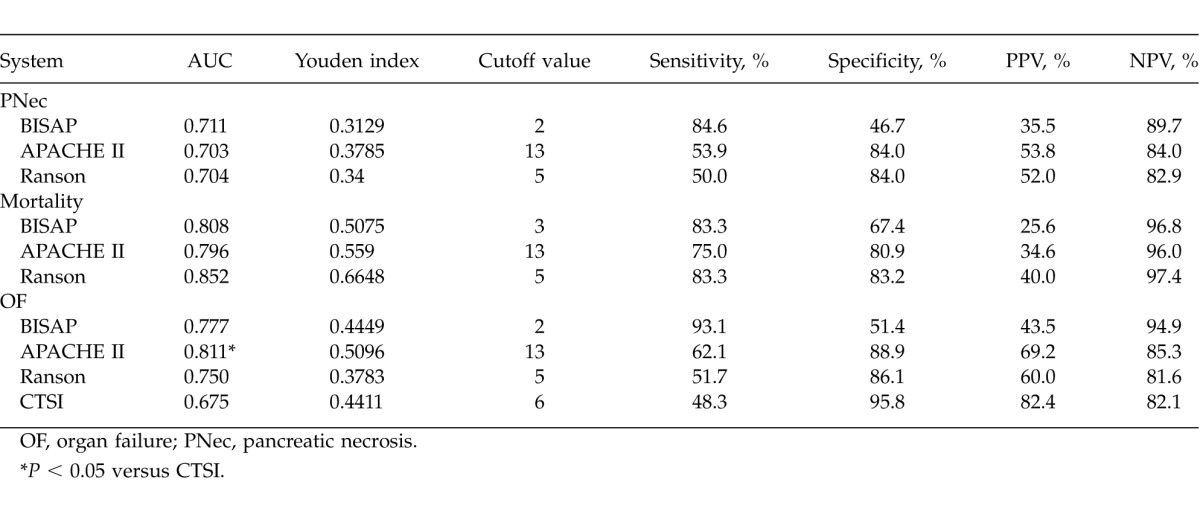
ROC curves yielded an AUC of 0.711 [95% confidence interval (95% CI), 0.612–0.797] for BISAP, 0.703 (95% CI, 0.603–0.789) for APACHE II, and 0.704 (95% CI, 0.605–0.791) for Ranson in predicting pancreatic necrosis (Fig. 1B), with no significant differences among the 3 groups (P > 0.05 for all; Table 5). The best cutoff values calculated using Youden index for BISAP, APACHE II, and Ranson scores were 2, 13, and 5, respectively. Using these cutoff values, the sensitivity, specificity, PPV, and NPV of various scoring systems in predicting pancreatic necrosis were calculated and are shown in Table 6.
Table 5 .
Comparisons of AUCs of various scoring systems in predicting pancreatic necrosis, mortality, and organ failure

Table 6 .
Sensitivity, specificity, PPV, and NPV of different scoring systems in predicting SAP prognoses

Mortality
ROC curves yielded an AUC of 0.808 (95% CI, 0.718–0.880) for BISAP, 0.796 (95% CI, 0.705–0.870) for APACHE II, 0.852 (95% CI, 0.768–0.915) for Ranson, and 0.868 (95% CI, 0.787–0.927) for CTSI in predicting mortality (Fig. 1C), with no significant differences among the 4 groups (P > 0.05 for all; Table 5). The best cutoff values calculated using Youden index for BISAP, APACHE II, Ranson, and CTSI scores were 3, 13, 5, and 6, respectively. Using these cutoff values, the sensitivity, specificity, PPV, and NPV of different scoring systems in predicting mortality were calculated and are shown in Table 6.
Organ failure
ROC curves yielded an AUC of 0.777 (95% CI, 0.683–0.854) for BISAP, 0.811 (95% CI, 0.721–0.882) for APACHE II, 0.750 (95% CI, 0.653–0.830) for Ranson, and 0.675 (95% CI, 0.574–0.765) for CTSI in predicting organ failure (Fig. 1D), with no significant differences among the 4 groups (P > 0.05 for all) except between APACHE II and CTSI (Table 5). The best cutoff values were calculated using Youden index for BISAP, APACHE II, Ranson, and CTSI scores were 2, 13, 5, and 6, respectively. Using these cutoff values, the sensitivity, specificity, PPV, and NPV of different scoring systems in predicting mortality were calculated and are shown in Table 6.
Discussion
At present, multiple scoring systems are available for evaluating the severity of AP. The Atlanta classification is a clinically based classification system that is most widely used and relatively universally accepted.12,13 It defines the severity and complications of AP by evaluating both local and systemic changes in the development and progression of the disease.14 Although the Atlanta classification cannot meet the requirement for early evaluation of AP, it is a relatively objective index for assessing the severity of AP. Many previous studies have applied Atlanta criteria to define the severity of AP.14,15 For these reasons, AP was defined according to the Atlanta classification in this retrospective study.
Ranson and APACHE II scores are two commonly used indices to predict severity of AP. A Ranson score of 3 or more or an APACHE II score of 8 or more is commonly used to classify a patient as having severe disease. These 2 cutoff values are consistent with those obtained by ROC analyses in the current study. In an American Gastroenterological Association Institute technical review on AP,16 it was reported that using the above cutoff values, Ranson score had a sensitivity of 75%, a specificity of 77%, a PPV of 49%, and an NPV of 91% in predicting SAP, and the corresponding values for APACHE II were 65%, 76%, 43%, and 89%.17 Compared with these data, sensitivity data obtained for Ranson and APACHE II scores in the present study were higher, but the specificity data were lower. We speculate that this discrepancy is caused by patient selection bias.
BISAP is a newly developed scoring system for predicting AP severity and prognosis.10 Currently, only limited data are available regarding the validation of this system among different patient populations. A study by Papachristou et al18 reported that with the cutoff value set at 3, BISAP score had a sensitivity of 37.5%, a specificity of 92.4%, a PPV of 57.7%, and an NPV of 84.3% in predicting SAP. In the present study, setting a cutoff value at 3 yielded a comparable sensitivity (38.6%), specificity (93.2%), PPV (59.1%), and NPV (85.6%). However, the best cutoff value calculated using Youden index for BISAP was 2, and using this cutoff value yielded a sensitivity of 61.4%, a specificity of 83.1%, a PPV of 48.1%, and an NPV of 89.4%. Compared with previous data, the sensitivity obtained for BISAP scores in the present study was higher; however, the specificity was lower. Several factors may contribute to these differences. First, there are differences in the characteristics of study participants, such as race, lifestyle, and genetic basis. In addition, etiologic distribution may also explain the noted differences. Actually, the present study included a much higher percentage of patients with biliary pancreatitis but a lower percentage of patients with alcoholic pancreatitis than previous studies. Finally, the criteria used for the diagnosis of SAP might be different among various studies.
BISAP comprises 5 variables, all of which are easy to obtain within 24 hours of admission. Compared with APACHE II scores, BISAP scores are easier to calculate. Besides, the BISAP score has the advantage over the Ranson score of being calculated within 24 hours of admission and permits early evaluation. Thus, BISAP has the advantages of simplicity and speed over traditional scoring systems.19 In the present study, we found that BISAP performed similarly to Ranson and APACHE II scores in predicting SAP in terms of AUC, sensitivity, and specificity, suggesting that BISAP is a reliable means of stratifying Chinese patients with AP.
We also compared BISAP with other scoring systems in predicting pancreatic necrosis, organ failure, and mortality in patients with SAP. BISAP was comparable to other scoring systems in predicting the prognoses of SAP in terms of AUC. We demonstrated that the best cutoff value for BISAP was 2 for predicting pancreatic necrosis and organ failure, and 3 for predicting mortality. Using these cutoff values, we found that BISAP exhibited sensitivities of 84.6%, 93.10%, and 83.3%, and specificities of 46.7%, 51.4%, and 67.4% in predicting pancreatic necrosis, organ failure, and mortality, respectively. Based on the presence of organ failure as the criterion for the diagnoses of SAP, Papachristou et al18 found that with a cutoff value of 3, BISAP had sensitivities of 33.3% and 57.1% and specificities of 90.6% and 87.6% in predicting pancreatic necrosis and mortality, respectively. Slightly higher specificity but lower sensitivity was observed in the present study. This may be caused by differences in SAP definitions or characteristics of the study participants. In addition, compared with other scoring systems evaluated in the present study, BISAP demonstrated a higher sensitivity but a lower specificity in predicting pancreatic necrosis and organ failure.
Compared with a previous study10 of Chinese patients, Ranson score had a lower sensitivity but a higher specificity in predicting organ failure, APACHE II scores had a higher sensitivity in predicting pancreatic necrosis but a higher specificity in predicting mortality, and CTSI scores had a higher sensitivity and specificity in predicting organ failure and mortality in our study. As stated above, etiologic distribution may partly explain such differences. In addition, the composition of patients developing different complications varies among different studies. Compared with previous studies, in the current study the percentage of patients developing organ failure was higher and that of patients developing pancreatic necrosis was lower.
In conclusion, we compared BISAP scores with Ranson, APACHE II, and CTSI scores in predicting the severity and prognoses of AP in Chinese patients. We demonstrated that BISAP has the advantages of simplicity and speed over traditional scoring systems and performed similarly to other scoring systems in predicting SAP and the prognoses of SAP in AUC. We confirmed that the BISAP score is an accurate means for risk stratification and prognostic prediction in Chinese patients with AP.
Acknowledgments
We thank Medjaden Bioscience Limited for assisting in the preparation of this manuscript.
References
- 1.The Pancreatology Working Group of Chinese Society of Gastroenterology of Chinese Medical Association. Draft criteria for diagnosis and treatment of acute pancreatitis in China. Mod Dig Interv. 2007;12(3):206–208. [Google Scholar]
- 2.Ranson JH, Rifkind KM, Roses DF, Fink SD, Eng K, Spencer FC. Prognostic signs and the role of operative management in acute pancreatitis. Surg Gynecol Obstet. 1974;139(1):69–81. [PubMed] [Google Scholar]
- 3.Knaus WA, Draper EA, Wagner DP, Zimmerman JE. APACHE. II: a severity of disease classification system. Crit Care Med. 1985;13(10):818–829. [PubMed] [Google Scholar]
- 4.Balthazar EJ, Robinson DL, Megibow AJ, Ranson JH. Acute pancreatitis: value of CT in establishing prognosis. Radiology. 1990;174(2):331–336. doi: 10.1148/radiology.174.2.2296641. [DOI] [PubMed] [Google Scholar]
- 5.Ranson JH, Pasternack BS. Statistical methods for quantifying the severity of clinical acute pancreatitis. J Surg Res. 1977;22(2):79–91. doi: 10.1016/0022-4804(77)90045-2. [DOI] [PubMed] [Google Scholar]
- 6.Yeung YP, Lam BY, Yip AW. APACHE system is better than Ranson system in the prediction of severity of acute pancreatitis. Hepatobiliary Pancreat Dis Int. 2006;5(2):294–299. [PubMed] [Google Scholar]
- 7.Larvin M, McMahon MJ. APACHE-II score for assessment and monitoring of acute pancreatitis. Lancet. 1989;2(8656):201–205. doi: 10.1016/s0140-6736(89)90381-4. [DOI] [PubMed] [Google Scholar]
- 8.Ju S, Chen F, Liu S, Zheng K, Teng G. Value of CT and clinical criteria in assessment of patients with acute pancreatitis. Eur J Radiol. 2006;57(1):102–107. doi: 10.1016/j.ejrad.2005.07.010. [DOI] [PubMed] [Google Scholar]
- 9.Kaya E, Dervisoglu A, Polat C. Evaluation of diagnostic findings and scoring systems in outcome prediction in acute pancreatitis. World J Gastroenterol. 2007;13(22):3090–3094. doi: 10.3748/wjg.v13.i22.3090. [DOI] [PMC free article] [PubMed] [Google Scholar]
- 10.Wu BU, Johannes RS, Sun X, Tabak Y, Conwell DL, Banks PA. The early prediction of mortality in acute pancreatitis: a large population-based study. Gut. 2008;57(12):1698–1703. doi: 10.1136/gut.2008.152702. [DOI] [PubMed] [Google Scholar]
- 11.Bradley EL., III A clinically based classification system for acute pancreatitis: summary of the International Symposium on Acute Pancreatitis, Atlanta, Ga, September 11 through 13, 1992. Arch Surg. 1993;128(5):586–590. doi: 10.1001/archsurg.1993.01420170122019. [DOI] [PubMed] [Google Scholar]
- 12.Bollen TL, Besselink MG, van Santvoort HC, Gooszen HG, van Leeuwen MS. Toward an update of the Atlanta classification on acute pancreatitis: review of new and abandoned terms. Pancreas. 2007;35(2):107–113. doi: 10.1097/mpa.0b013e31804fa189. [DOI] [PubMed] [Google Scholar]
- 13.Petrov MS, Windsor JA. Classification of the severity of acute pancreatitis: how many categories make sense? Am J Gastroenterol. 2010;105(1):74–76. doi: 10.1038/ajg.2009.597. [DOI] [PubMed] [Google Scholar]
- 14.Stimac D, Miletić D, Radić M, Krznarić I, Mazur-Grbac M, Perković D, et al. The role of nonenhanced magnetic resonance imaging in the early assessment of acute pancreatitis. Am J Gastroenterol. 2007;102(5):997–1004. doi: 10.1111/j.1572-0241.2007.01164.x. [DOI] [PubMed] [Google Scholar]
- 15.Liu Y, Lu Z, Li ZS, Dong YH, Zhang WJ, Pan X. Prediction of outcome in acute pancreatitis: a comparative study of APACHE II, Ranson and Balthazar computed tomography scoring systems. Chin J Pancreatol. 2006;6(4):196–200. [Google Scholar]
- 16.Forsmark CE, Baillie J. AGA Institute Clinical Practice and Economics Committee; AGA Institute Governing Board. AGA Institute technical review on acute pancreatitis. Gastroenterology. 2007;132(5):2022–2044. doi: 10.1053/j.gastro.2007.03.065. [DOI] [PubMed] [Google Scholar]
- 17.Larvin M. Assessment of clinical severity and prognosis. In: Beger HG, Warshaw AL, Buchler MW, Carr-Locke D, Neoptolemos JP, Russell C, editors. The Pancreas. Oxford, England: Blackwell Science; 1998. pp. 489–502. In. , eds. [Google Scholar]
- 18.Papachristou GI, Muddana V, Yadav D, O'Connell M, Sanders MK, Slivka A, et al. Comparison of BISAP, Ranson's, APACHE-II and CTSI scores in predicting organ failure, complications, and mortality in acute pancreatitis. Am J Gastroenterol. 2010;105(2):435–441. doi: 10.1038/ajg.2009.622. [DOI] [PubMed] [Google Scholar]
- 19.Singh VK, Wu BU, Bollen TL, Repas K, Maurer R, Johannes RS, et al. A prospective evaluation of the bedside index for severity in acute pancreatitis score in assessing mortality and intermediate markers of severity in acute pancreatitis. Am J Gastroenterol. 2009;104(4):966–971. doi: 10.1038/ajg.2009.28. [DOI] [PubMed] [Google Scholar]


